
Sep 30, 2022
CF Benchmarks launches CF Bitcoin Interest Rate Curve
CF Benchmarks is excited to launch the first comprehensive interest rate curve for the Bitcoin lending market, the CF Bitcoin Interest Rate Curve, in association with blockchain oracle network Chainlink
CF Bitcoin Interest Rate Curve Basics
The CF Bitcoin Interest Rate Curve (CF BIRC), the first index of its kind published by CF Benchmarks, measures the underlying economic reality of Bitcoin borrowing and lending, whether on an outright basis or an implied basis in tradeable instruments.
The curve is comprised of an institutional-standard Bitcoin interest rate index, derived from thousands of transactional inputs contributed by leading crypto futures exchanges, DeFi lending protocols and OTC crypto lenders.
Denominated in Bitcoin, CF Bitcoin Interest Rate Curve encompasses common interest rate tenors – session, weekly, fortnightly, monthly and so on – up to a maximum 5-month maturity.
The index is published daily at 16:30 London Time, having printed its first value on July 11th, 2022.
Further key details are provided in the tables below.
| Tenor | Instruments Utilized |
|---|---|
| Session Rate | PERPS, DeFi, OTC |
| 1, 2, 3 Weeks | Term Futures, OTC |
| 1, 2, 3, 4, 5 Months | Term Futures, OTC |
Contributing Sources
| Source | Market |
|---|---|
| CME | Term Futures |
| BitMex | PERPS, Term Futures |
| Binance | PERPS, Term Futures |
| OKX | PERPS, Term Futures |
| ByBit | PERPS |
| AAVE | DeFi |
| Compound | DeFi |
| CeFi Platforms | OTC |
Why is the CF Bitcoin Interest Rate Curve needed?
The curve brings institutional standards of interest rate discovery to fast-growing collateralized crypto lending and DeFi markets for the first time.
It is also a superior, reliable Bitcoin interest rate index for the ever-increasing range of institutional lending products and services available from crypto prime brokers.
All published individual interest rates that, as a whole, constitute the interest rate curve, represent transparent indicators and build on CF Benchmark’s experience, to accelerate the professionalisation of cryptocurrency trading and associated borrowing and lending activity.
Each point on the interest rate curve aims to be representative, replicable and efficient, to facilitate the creation of financial products such as interest rate derivative contracts.
Transactions can be priced as a spread to this rate to add transparency and unlock risk management solutions at scale.
Providers of Bitcoin loans and lending platforms, or Bitcoin derivatives that incorporate a Bitcoin Interest Rate into their products, should seek out CF Bitcoin Interest Rate Curve as an optimal solution.
Understanding the CF Bitcoin Interest Rate Curve
The CF Bitcoin Interest Rate Curve is similar in principle to conventional Overnight Indexed Swap (OIS) rate curves. Like SOFR, EONIA and SONIA interest rate curves, BIRC's calculation is based on executed transactions.
Therefore, reading the quantitative details of the CF Bitcoin Interest Rate Curve and understanding how its values are applicable to Bitcoin lending markets should pose no difficulties to those familiar with traditional interest rates markets.
Methodology overview
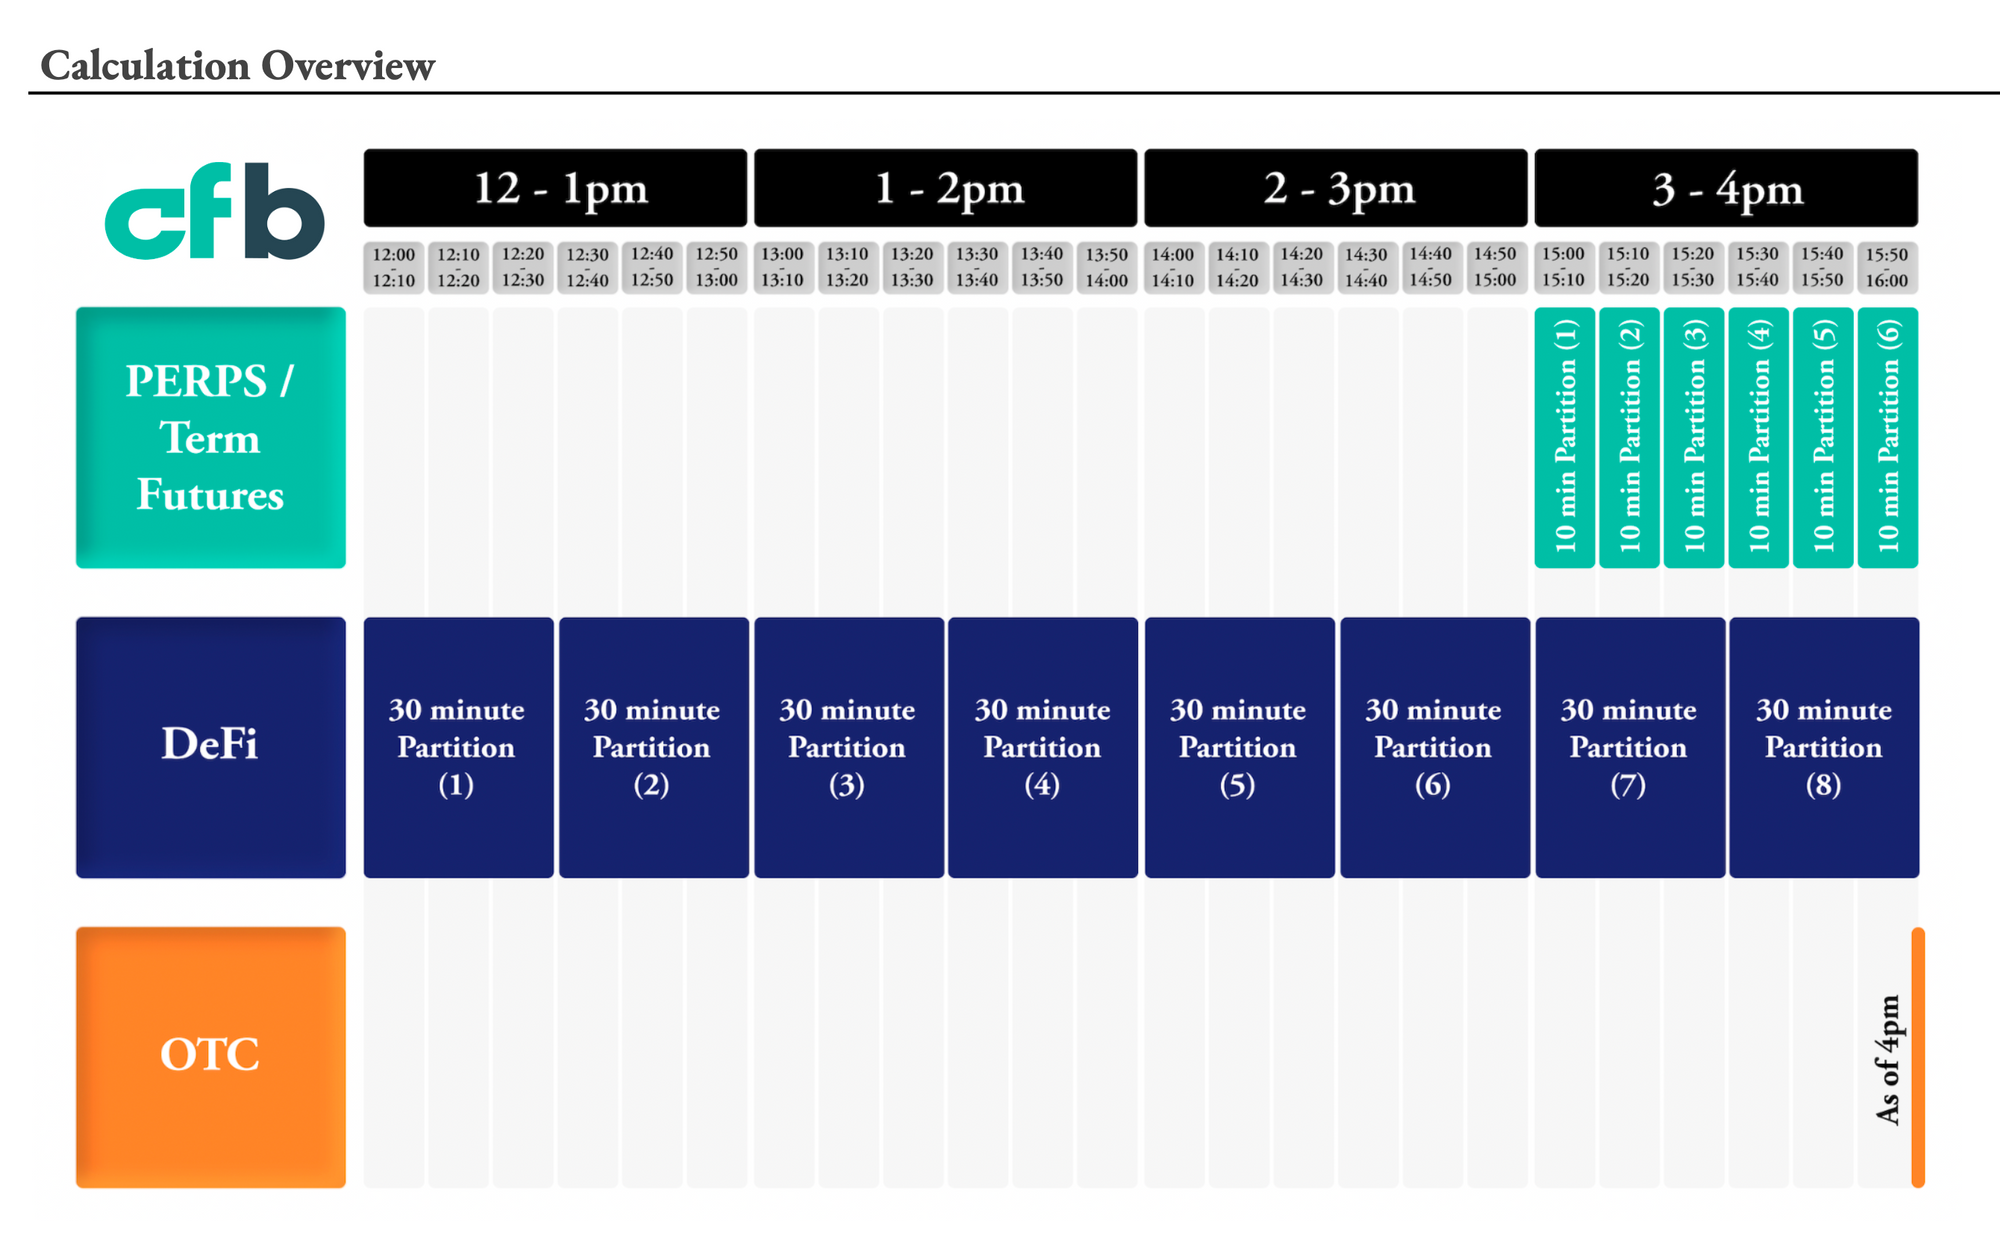
The CF Bitcoin Interest Rate Curve is constructed over a fixed set of tenors.
Tenors are categorised as Intraday, Short Term and Medium Term, where each category is informed by a predefined set of instruments.
Categories, Tenors and Instruments are shown in the table below.
| Category | Relevant Tenors | Instruments |
|---|---|---|
| Session Interest Rate | Intraday | Perp. Futures, DeFi Lending, OTC Loans |
| Short Term | 1 - 3 Week / 1 - 5 Month | Fixed Maturity Futures, OTC Loans |
| Medium Term | 6 - 12 Month | Fixed Maturity Futures, OTC Loans |
A graphic illustrating the calculation windows allotted to each type of contributor of transactional data to CF Bitcoin Interest Rate Curve is provided below.
The full CF Bitcoin Interest Rate Curve Methodology Guide is available here.
The information contained within is for educational and informational purposes ONLY. It is not intended nor should it be considered an invitation or inducement to buy or sell any of the underlying instruments cited including but not limited to cryptoassets, financial instruments or any instruments that reference any index provided by CF Benchmarks Ltd. This communication is not intended to persuade or incite you to buy or sell security or securities noted within. Any commentary provided is the opinion of the author and should not be considered a personalised recommendation. Please contact your financial adviser or professional before making an investment decision.
Note: Some of the underlying instruments cited within this material may be restricted to certain customer categories in certain jurisdictions.
CF Benchmarks Newsletter Issue 103
* Kraken's xStocks Will Power Nasdaq's Tokenized Equities * Hashi: the New Bitcoin Collateral Layer, Priced by CF Benchmarks * CF Benchmarks Research: Understanding Bitcoin's Split from M2 Patience March tallies show how conditional ETF demand has become under the current market regime. U.S. spot Bitcoin ETFs took in $458.2 million on March 2nd, $225.2 million on March 3rd, and $461.9 million on March 4th, a three-session burst of $1.15 billion. Decrypt's 'Bitcoin is Abnormal' commentary c

Ken Odeluga
CFB Talks Digital Assets Episode 55: xStocks: Inside Kraken's Tokenized Equities Revolution
We explore the rise of Kraken's xStocks with Mark Greenberg, Head of B2B at Payward Services / Kraken, and Thomas Erdösi, Head of Product at CF Benchmarks.
Ken Odeluga
Factor Friday - March 27, 2026
Momentum Leads as the Market Sells Off The market declined 3.1% on the week, giving back a portion of the rally that had narrowed the year-to-date drawdown over recent weeks. The year-to-date loss now stands at 30.6%. The best performer this week is momentum, which topped the weekly factor rankings for the first time this year at +1.5%, a meaningful gap over the others. Value held up relatively well at -0.1% on the week, while growth posted a modest decline of 0.5%. Downside beta fell 2.1% on
Mark Pilipczuk