
Oct 05, 2026
Bitcoin Remains Flat as Yields Soar
Weekly Index Highlights, October 5, 2026
Two US data surprises moved short-dated rate expectations but not the long end of the Treasury curve, and the largest digital assets finished the week close to where they started. Core personal consumption expenditures (PCE) inflation printed a tenth below consensus on September 30th and September nonfarm payrolls rose 29,000 against 84,000 expected on October 2nd, pulling priced odds of an October Federal Reserve hike from about 72% to below roughly 25%, yet the 10-year Treasury yield touched 5.34% on October 1st, its highest since 2002. Each data-driven advance in Bitcoin (BTC) faded, and BTC ended up 0.46% week-on-week (w/w), with the eight CF Capitalization Series indices inside a 0.85 percentage point (pp) range. We read macro as having shaped the path of the week more than its outcome. The week's returns came from a few single-name catalysts: The Sandbox (SAND) rose 77.13% after three South Korean exchanges lifted trading caution designations on October 2nd, carrying the CF Digital Culture Composite Index up 12.63% and Culture to the top of the CF Digital Asset Classification Structure (DACS) sub-categories, while Quant (QNT) added 54.34% in a second week of tokenized-deposit follow-through.
Market Performance Update
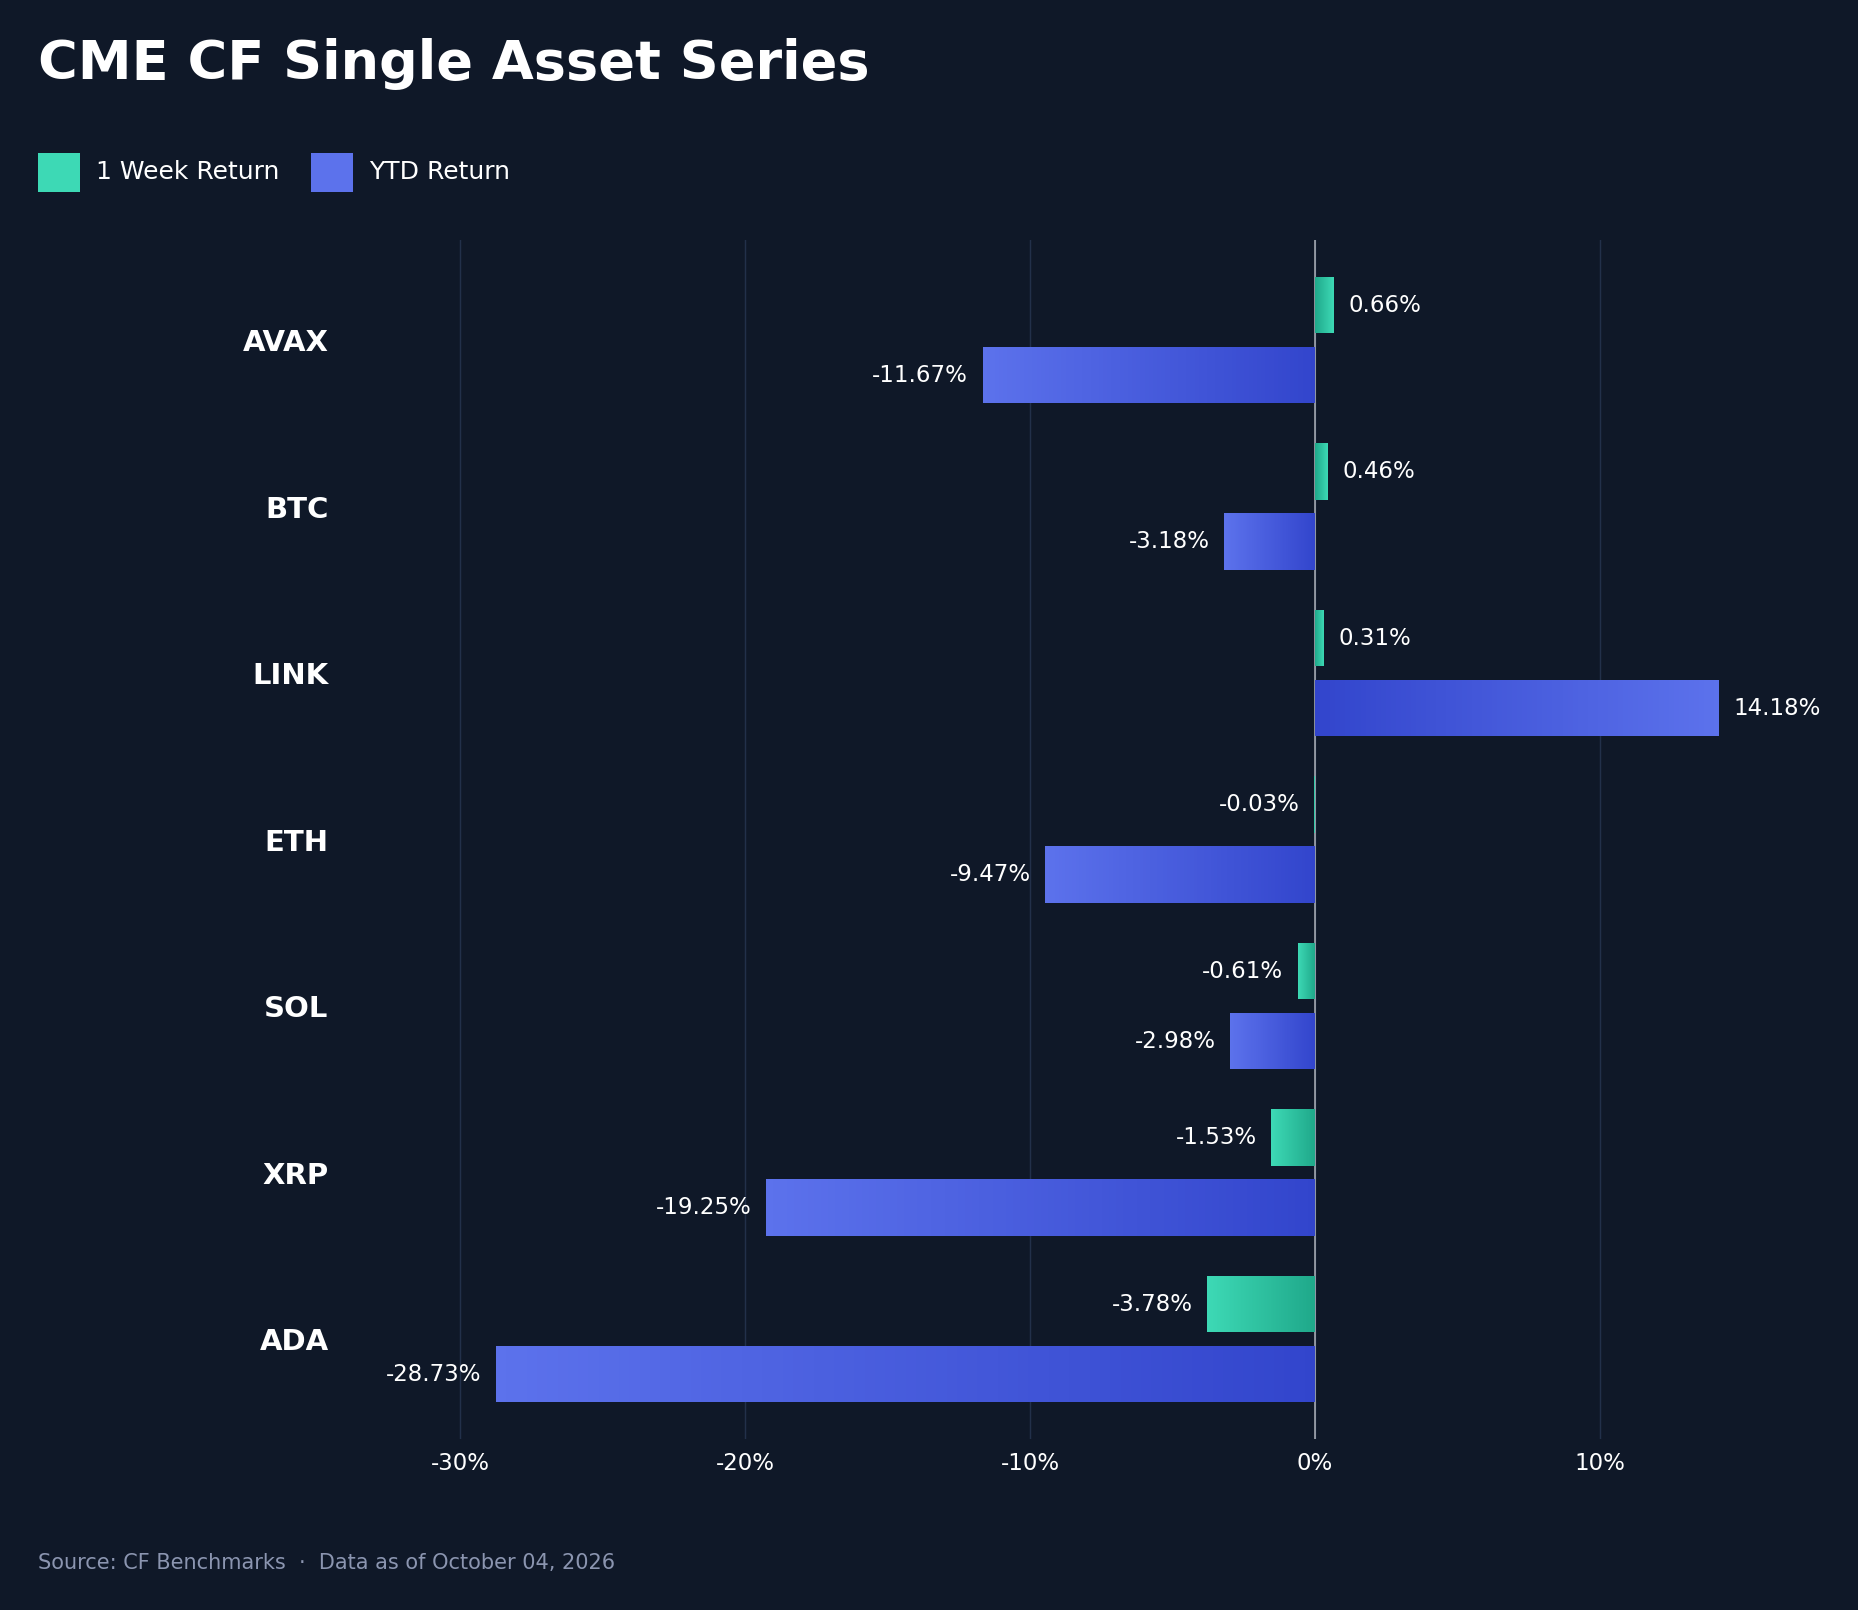
The CF Single Asset Series split three gainers against four decliners within a 4.44 pp range, down from 14.63 pp a week earlier, when all seven names rose. Avalanche (AVAX) led at +0.66% w/w, leaving it 11.67% lower year-to-date (YTD), followed by BTC at +0.46% (YTD -3.18%) and Chainlink (LINK) at +0.31% (YTD +14.18%). Ether (ETH) was flat at -0.03% (YTD -9.47%), Solana (SOL) fell 0.61% (YTD -2.98%) and XRP 1.53% (YTD -19.25%), while Cardano (ADA) gave back 3.78% (YTD -28.73%) a week after gaining 14.88%. The week opened on a geopolitical risk-off: after President Trump rejected Iran's plan to reopen the Strait of Hormuz, Brent rose toward $108 and BTC fell from $84,457 at Monday's open to $82,958 by 7:20 a.m. ET. Each dovish US print that followed coincided with a BTC advance, to about $85,500 after core PCE and to about $87,086 after payrolls, and each faded as the 10-year yield held near 5.3%; BTC's Friday high stopped short of its $87,968.81 start-of-year fix. US spot Bitcoin exchange-traded funds (ETFs) took in about $241 million over five sessions, against $2.39 billion the prior week, while Ether ETFs recorded about $118 million of net redemptions across four straight outflow sessions, consistent with ETH trailing BTC. The largest assets finished close to unchanged despite two downside data surprises, consistent with a market taking its cue from the long end of the Treasury curve.
Volatility Analysis
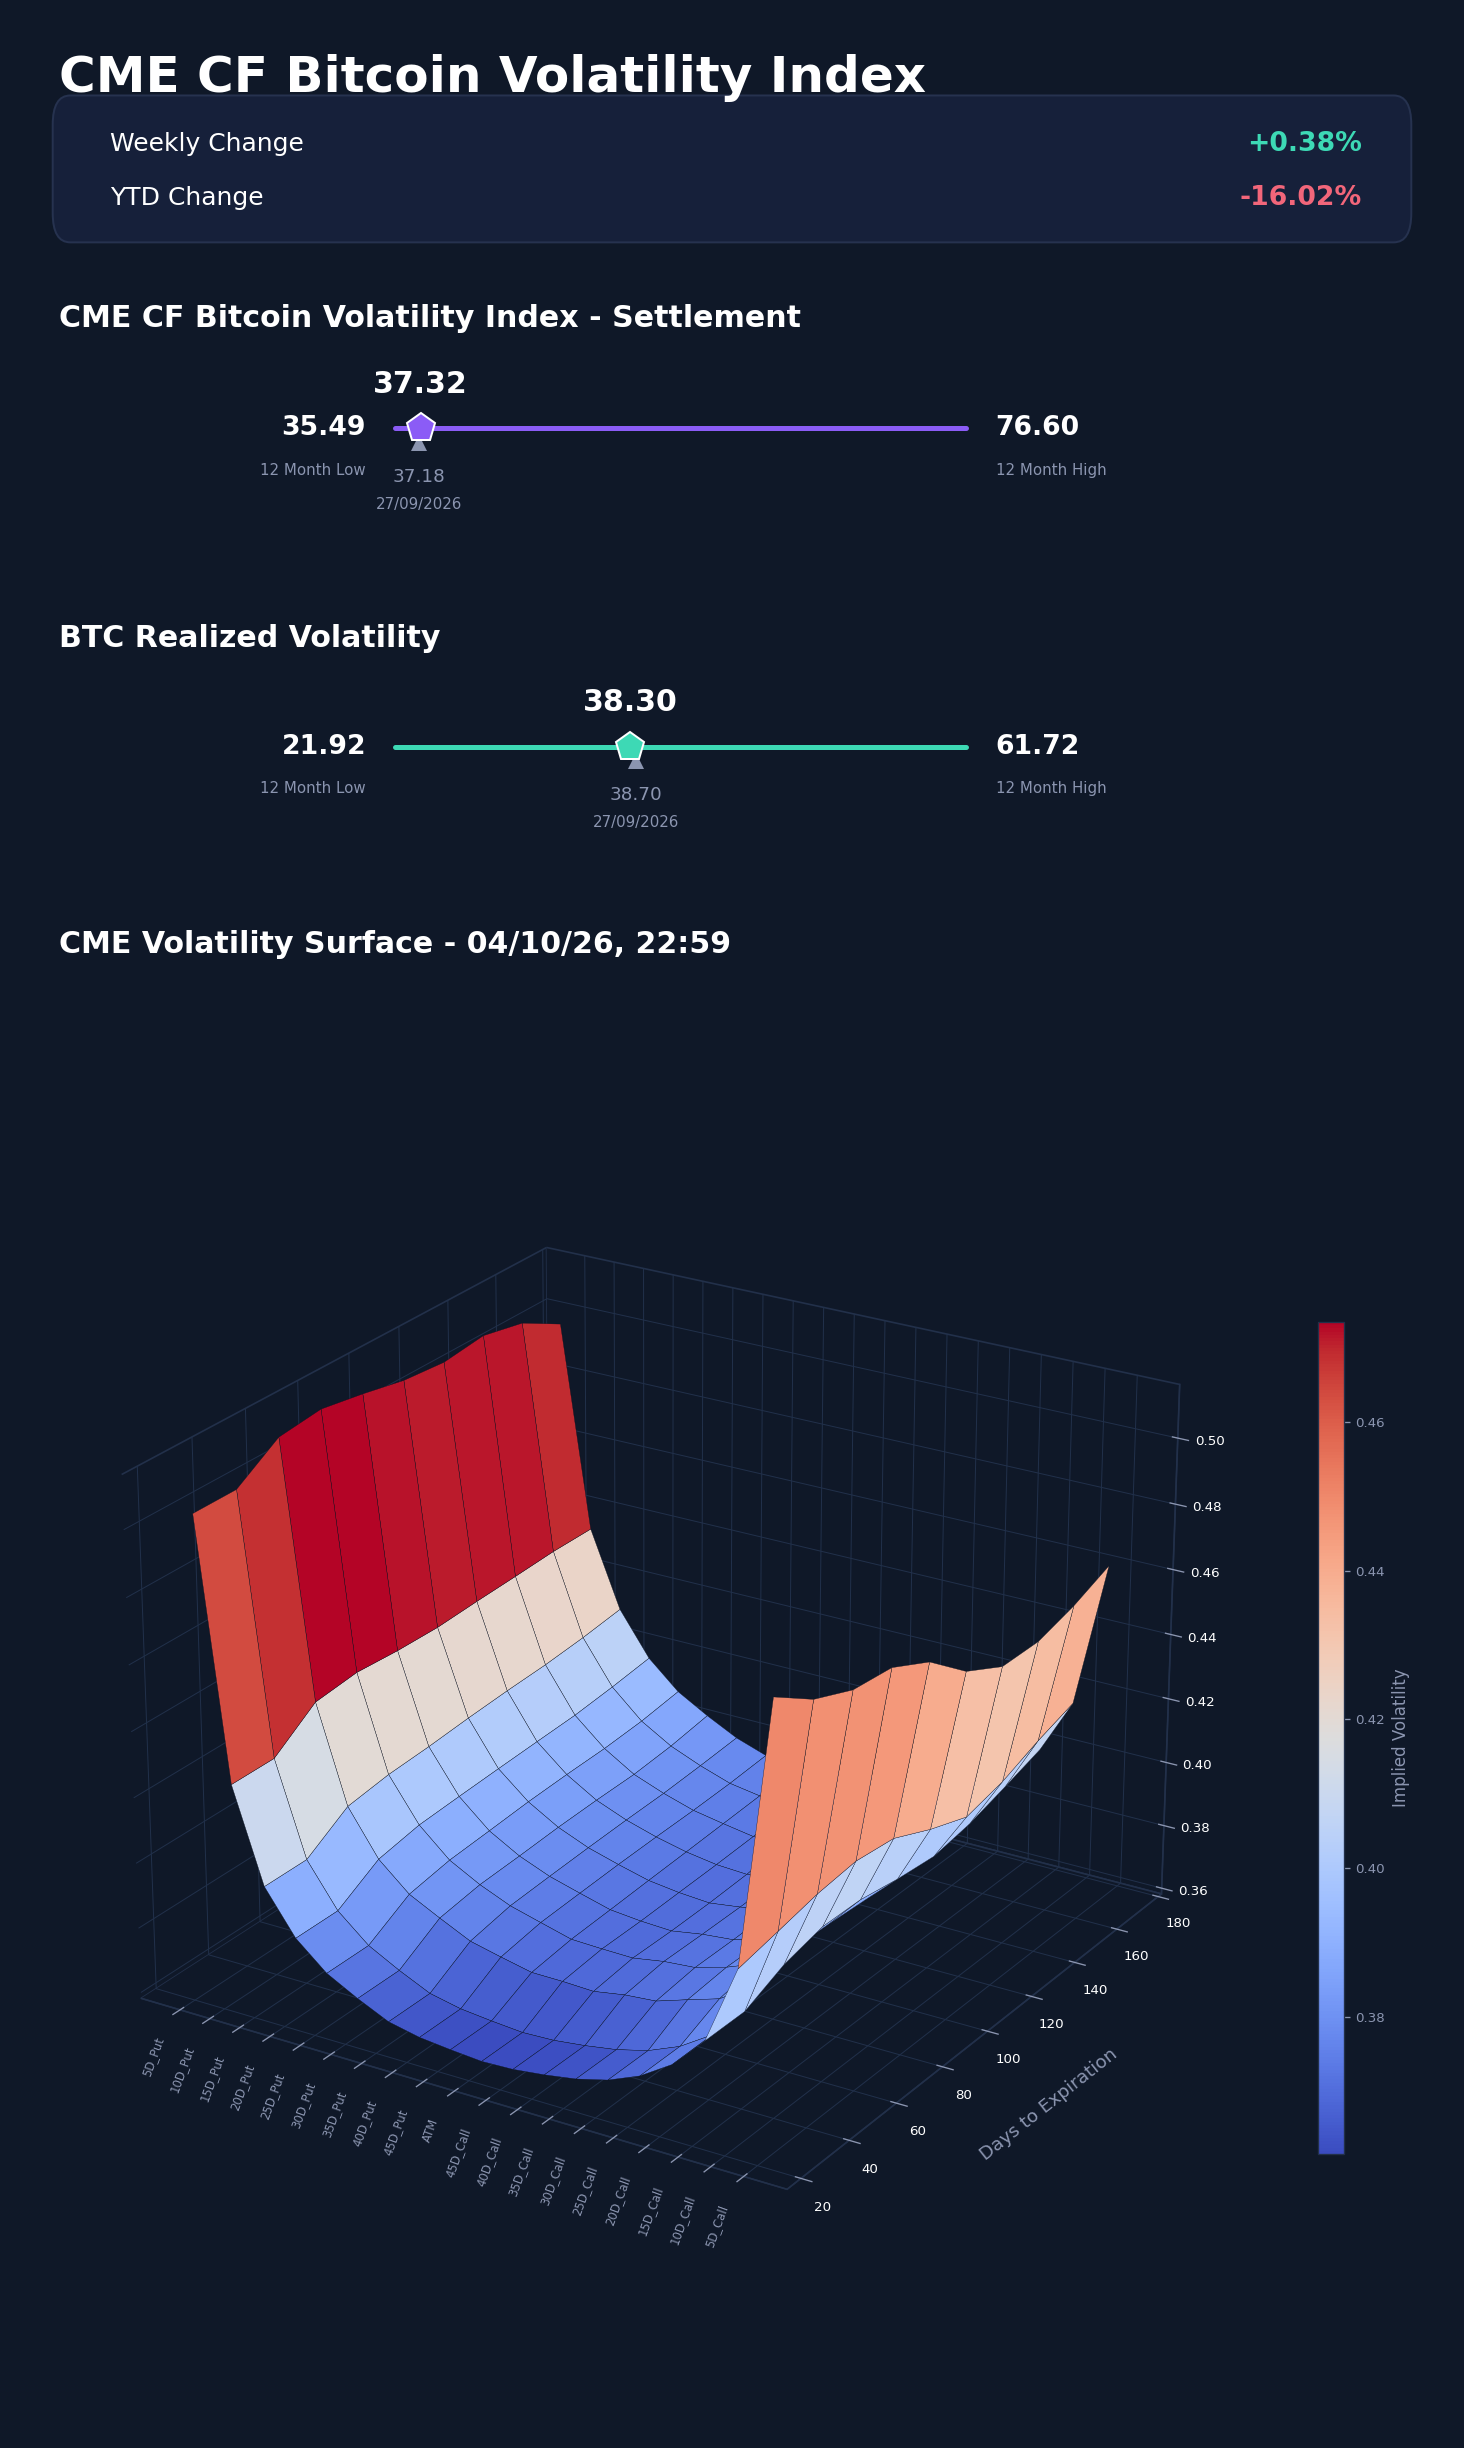
The CME CF Bitcoin Volatility Index Settlement (BVXS) finished October 4th at 37.32, up 0.38% w/w from 37.18. Across the business week it held a 0.63 vol. point band, from 36.91 on Tuesday to 37.54 on Wednesday, and finished Friday's payrolls session at 37.47, so the data surprises moved spot more than the price of protection. Thirty-day realized volatility eased to 38.30 from 38.70, narrowing the implied-minus-realized spread to -0.98 vol. points from -1.52. BVXS sat 1.83 vol. points above its trailing 12-month low of 35.49, within a 35.49-to-76.60 range, and 16.02% below its 44.44 start-of-year reference, while realized volatility sat in the lower half of its 21.92-to-61.72 range. On the surface, the 25-day front row against the prior snapshot's 32-day row showed at-the-money implied volatility at 36.13 against 35.58 and an unchanged 25-delta put premium of 1.33 vol. points against 1.34, but both wings widened: the 5-delta put premium over at-the-money rose to 14.17 vol. points from 11.36 and the 5-delta call premium to 13.07 from 10.87. Part of that wing widening reflects the shorter front tenor, so we would not over-interpret it. The exhibit uses the 22:59 Sunday capture, the only October 4th snapshot to pass the standing skew checks, and its tenor grid now runs from 25 to 171 days. Options continued to price slightly below realized movement, with demand concentrated in the tails rather than in directional skew.
Market Cap Index Performance
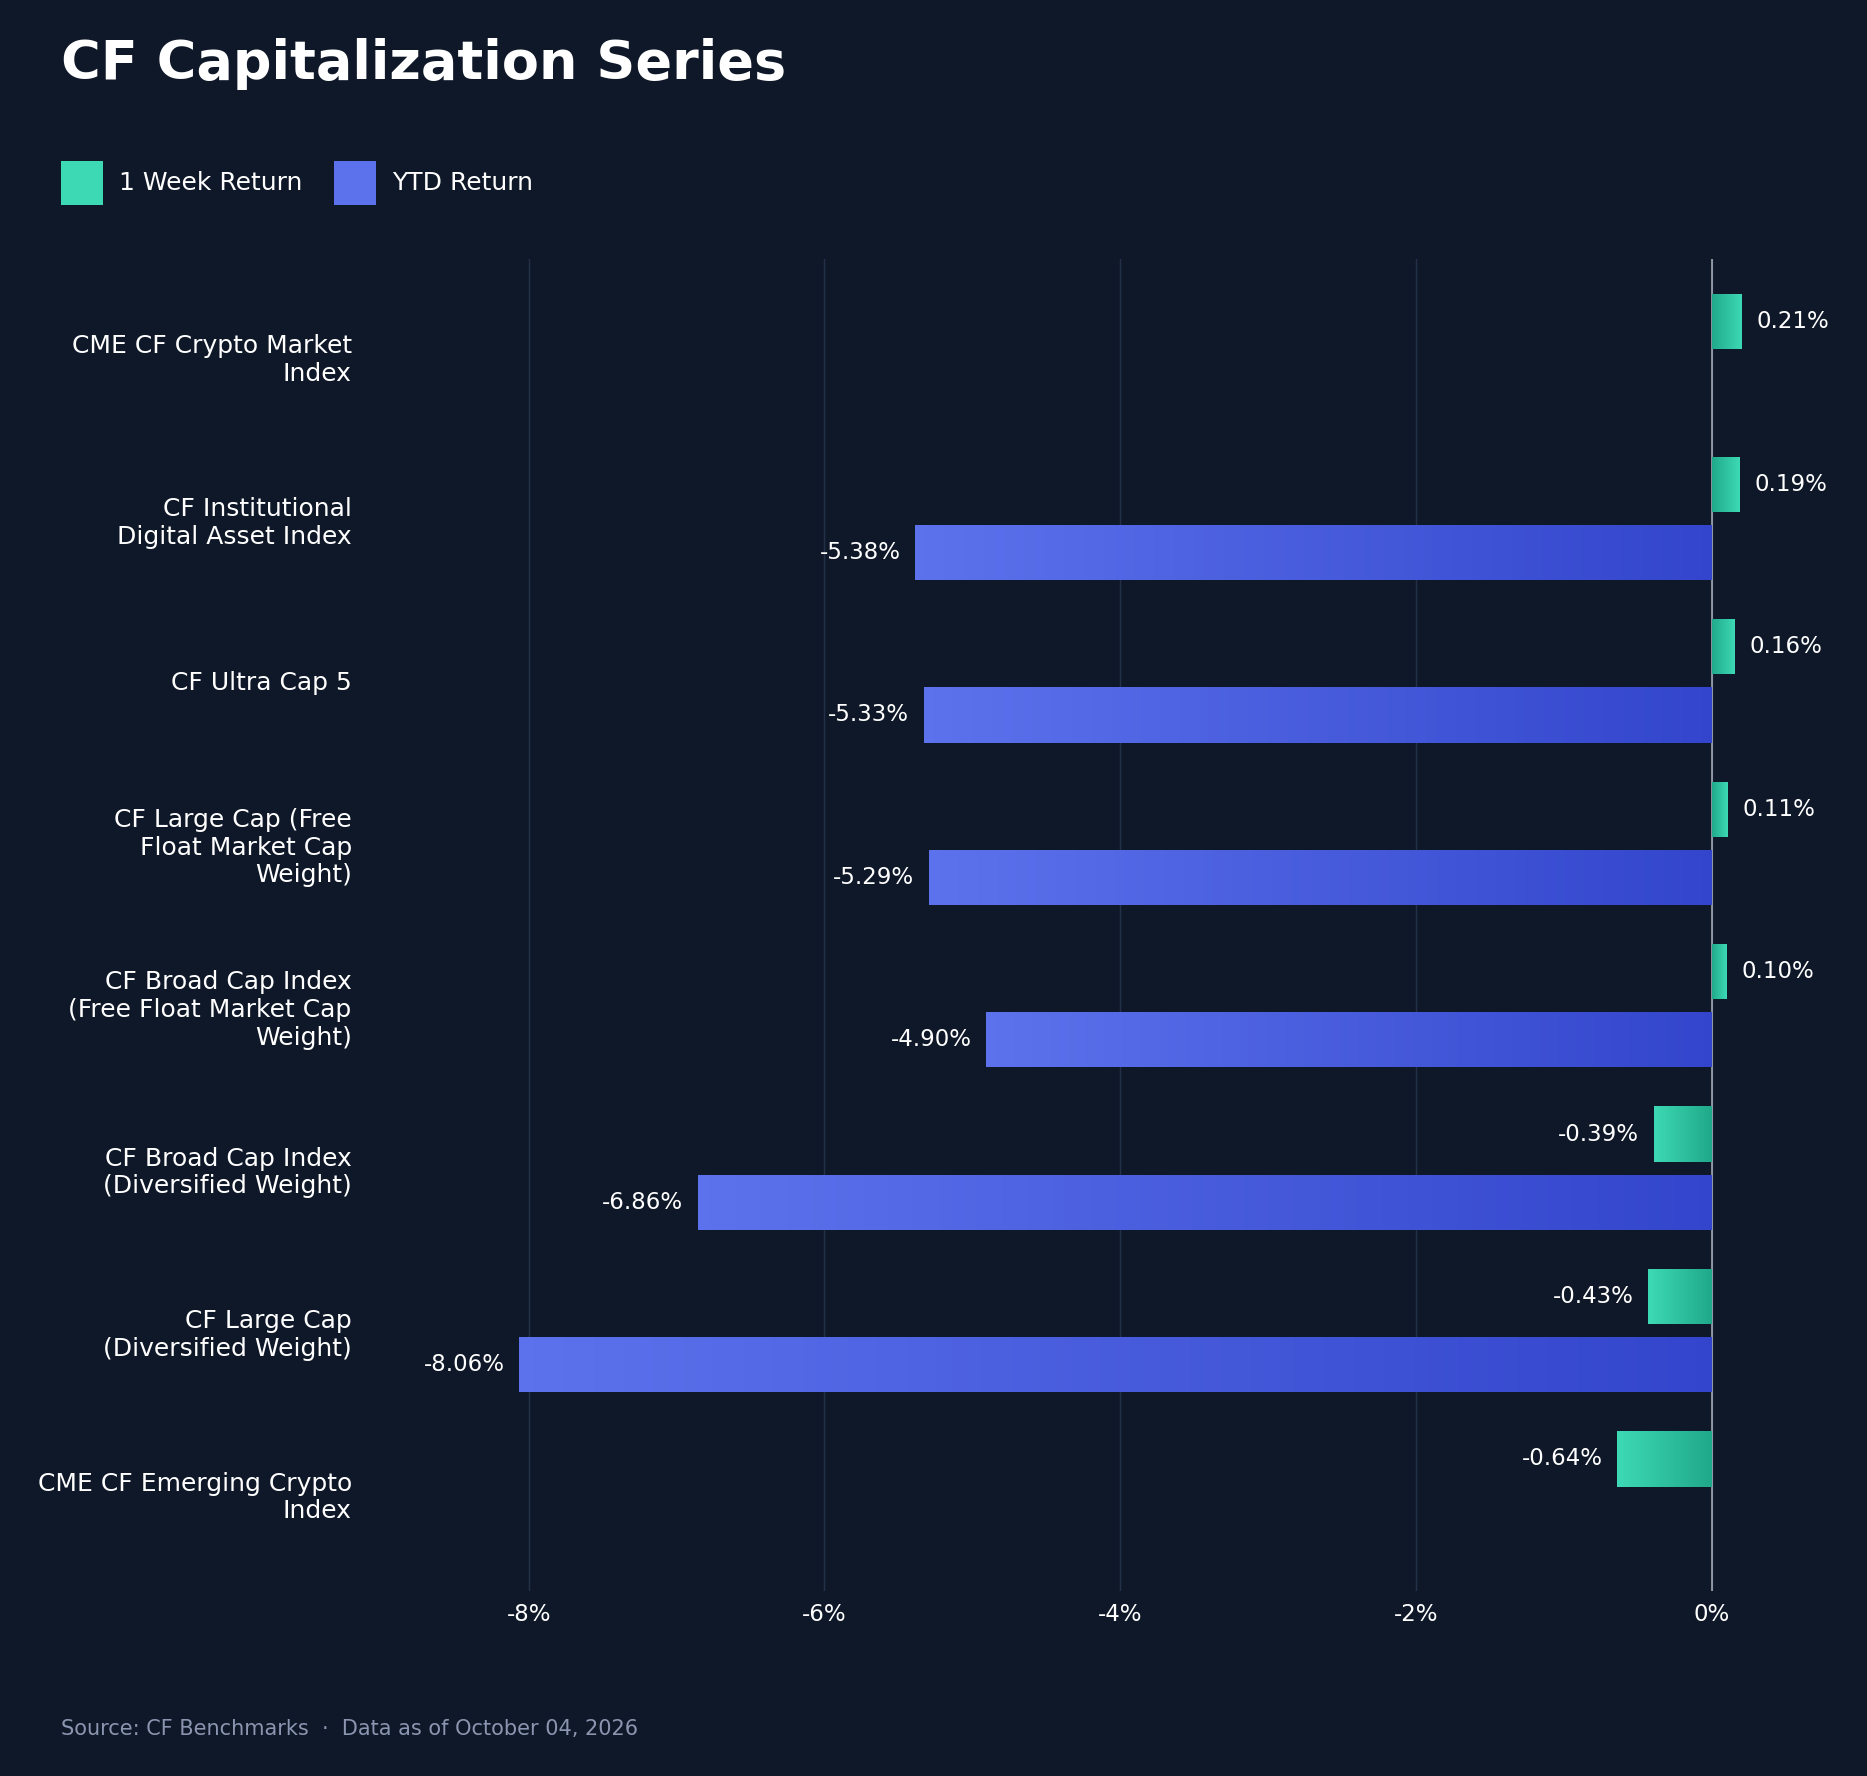
The CF Capitalization Series compressed into a 0.85 pp range, from 2.41 pp a week earlier, and diversified weighting gave back its lead. The CME CF Crypto Market Index led at +0.21% w/w, followed by the CF Institutional Digital Asset Index at +0.19% (YTD -5.38%), CF Ultra Cap 5 at +0.16% (YTD -5.33%), CF Large Cap (Free Float Market Cap Weight) at +0.11% (YTD -5.29%) and CF Broad Cap Index (Free Float Market Cap Weight) at +0.10% (YTD -4.90%). CF Broad Cap Index (Diversified Weight) fell 0.39% (YTD -6.86%), CF Large Cap (Diversified Weight) 0.43% (YTD -8.06%) and the CME CF Emerging Crypto Index 0.64%. Broad Cap Diversified trailed its free-float counterpart by 0.50 pp and Large Cap Diversified by 0.54 pp, reversing leads of 1.72 pp and 0.87 pp the prior week. The macro impulse reached the whole market through rates rather than rotating within it: the collapse in October hike odds, from about 72% to below roughly 25%, was offset by a long end that did not rally, and the free-float indices, weighted toward BTC, held near flat. Friday's $433.6 million of liquidations, 74% of them longs, after the $87,000 rejection coincided with weaker breadth, as the Emerging Crypto Index finished last, and the Digital Culture rally was concentrated in a handful of gaming and virtual-world tokens. YTD values for the Crypto Market and Emerging Crypto indices remain unavailable because their start-of-year fixes are missing.
Factors Analysis
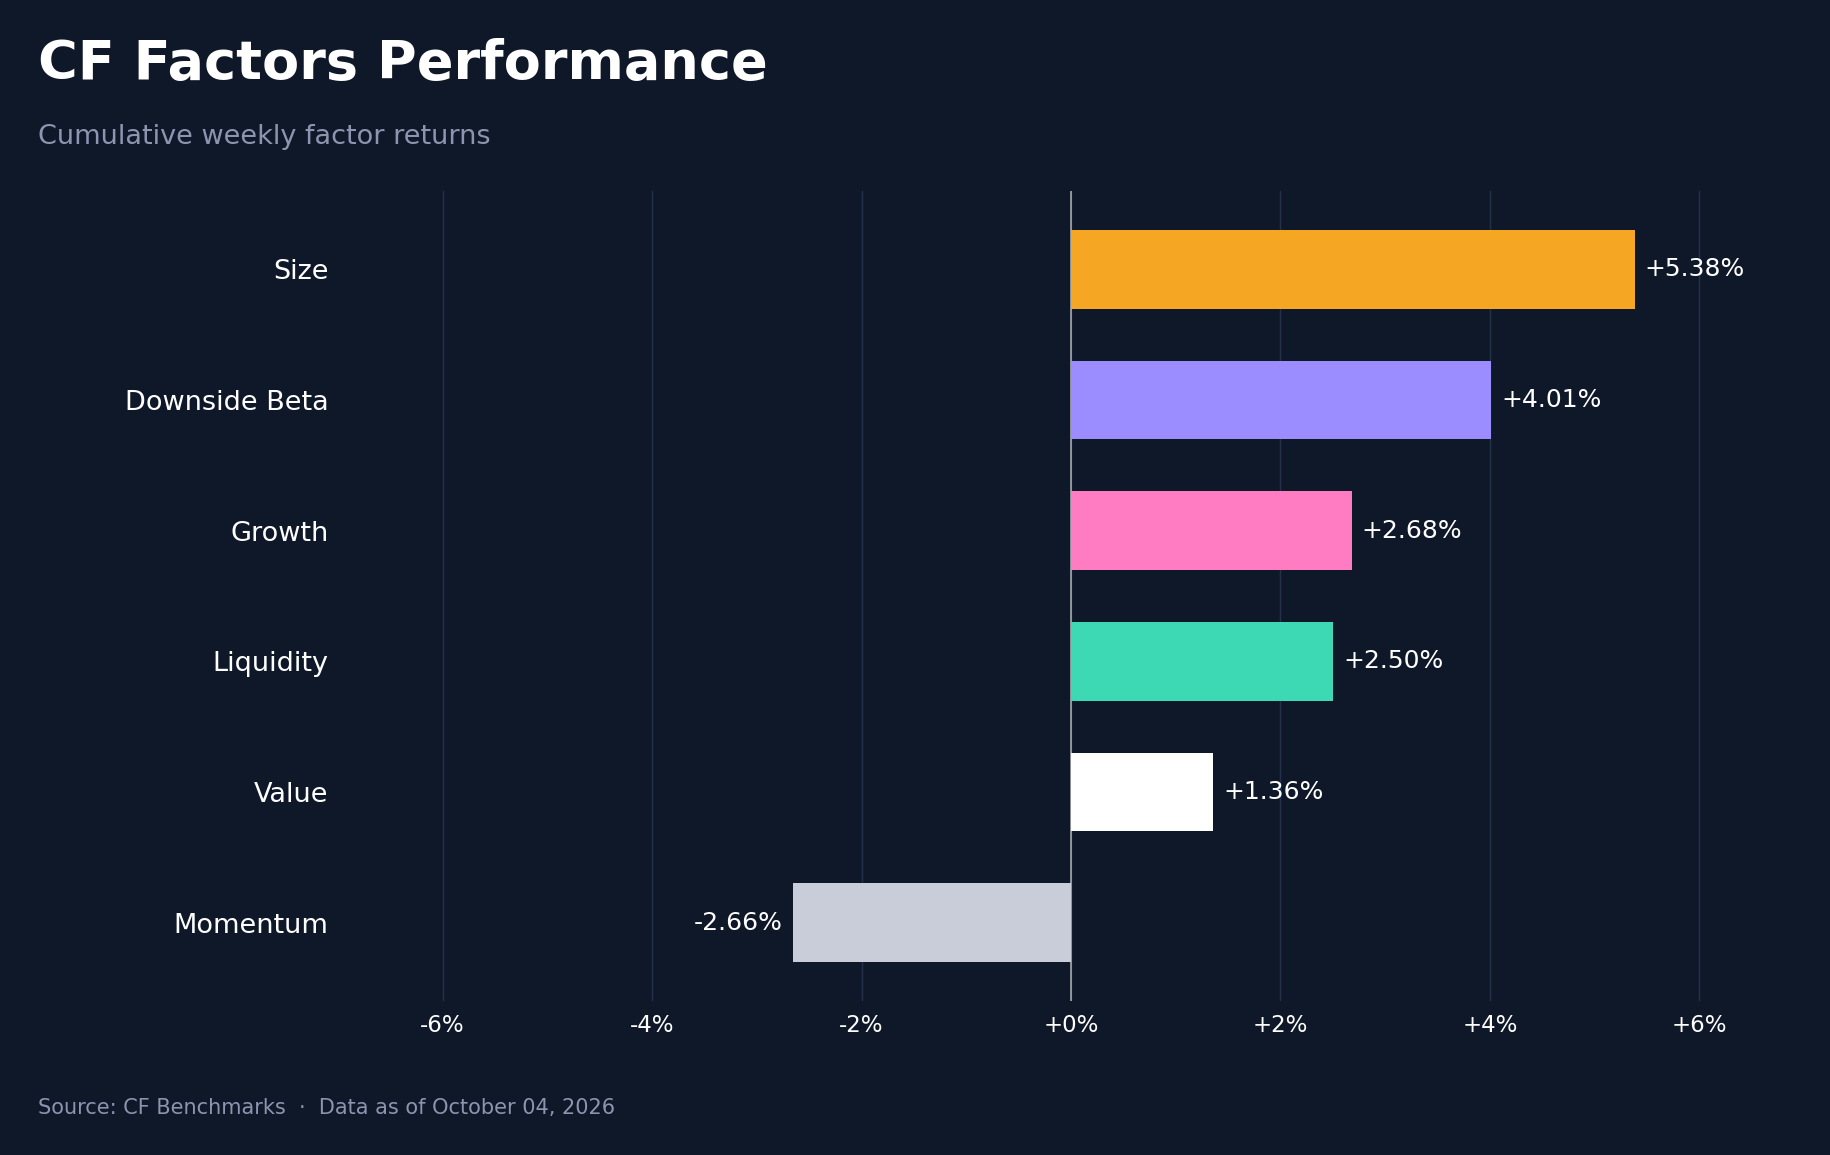
Size led the six CF factors for a second week at +5.38% cumulative, followed by Downside Beta at +4.01%, Growth at +2.68%, Liquidity at +2.50% and Value at +1.36%, while Momentum returned -2.66%. The 8.04 pp range narrowed from 12.59 pp. Downside Beta recorded the largest reversal, improving 7.38 pp from -3.37%, and its entire weekly gain arrived on Monday, when it returned 5.66% in the session that spot sold off on the Hormuz headlines; it ended the week below that Monday level. Growth improved 5.51 pp from -2.83%, and Momentum stayed last for a second week but recovered 3.75 pp from -6.40%. Size added 2.42% on Friday, the payrolls session, before peaking at 5.90% cumulative on Saturday. Value slipped 1.01 pp from +2.36% despite a 1.36% gain on Sunday that turned its weekly return positive. With five of six factors positive against a flat BTC, the factor spread was earned in the cross-section rather than from market direction.
Read our latest weekly crypto factors report: Factor Friday - October 2, 2026
Classification Series Analysis
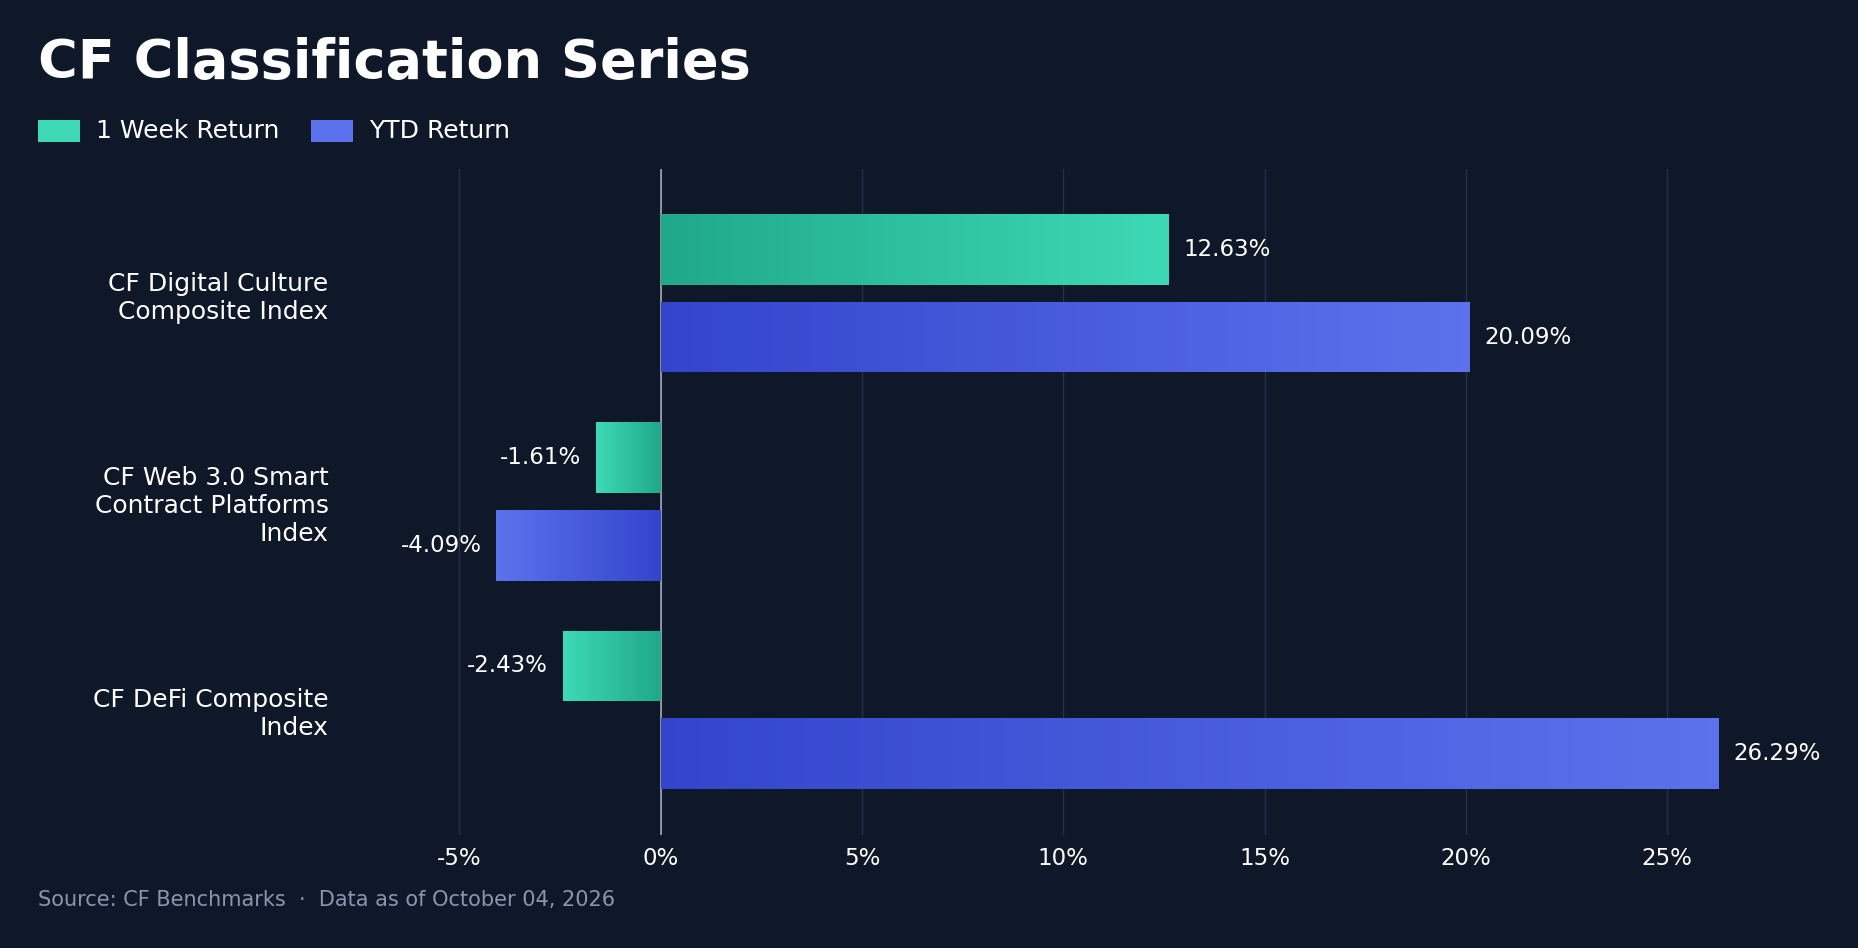
The CF Classification Series produced the widest spread of any index family this week. The CF Digital Culture Composite Index rose 12.63% w/w and lifted its YTD return to +20.09% from +6.63%, while the CF Web 3.0 Smart Contract Platforms Index fell 1.61% (YTD -4.09%) and the CF DeFi Composite Index 2.43% (YTD +26.29%). The 15.06 pp range compared with 5.79 pp a week earlier, and Digital Culture led for a second consecutive week. DeFi remains the YTD leader, but its advantage over Digital Culture narrowed to 6.19 pp from 22.81 pp in one week. Digital Culture also outperformed the best capitalization index by 12.42 pp. The composite's gain coincided with the gaming and virtual-world rally in the CF DACS Culture sub-category, detailed below, while DeFi trading names declined on average, as did most of the larger smart contract platforms.
Sector Analysis
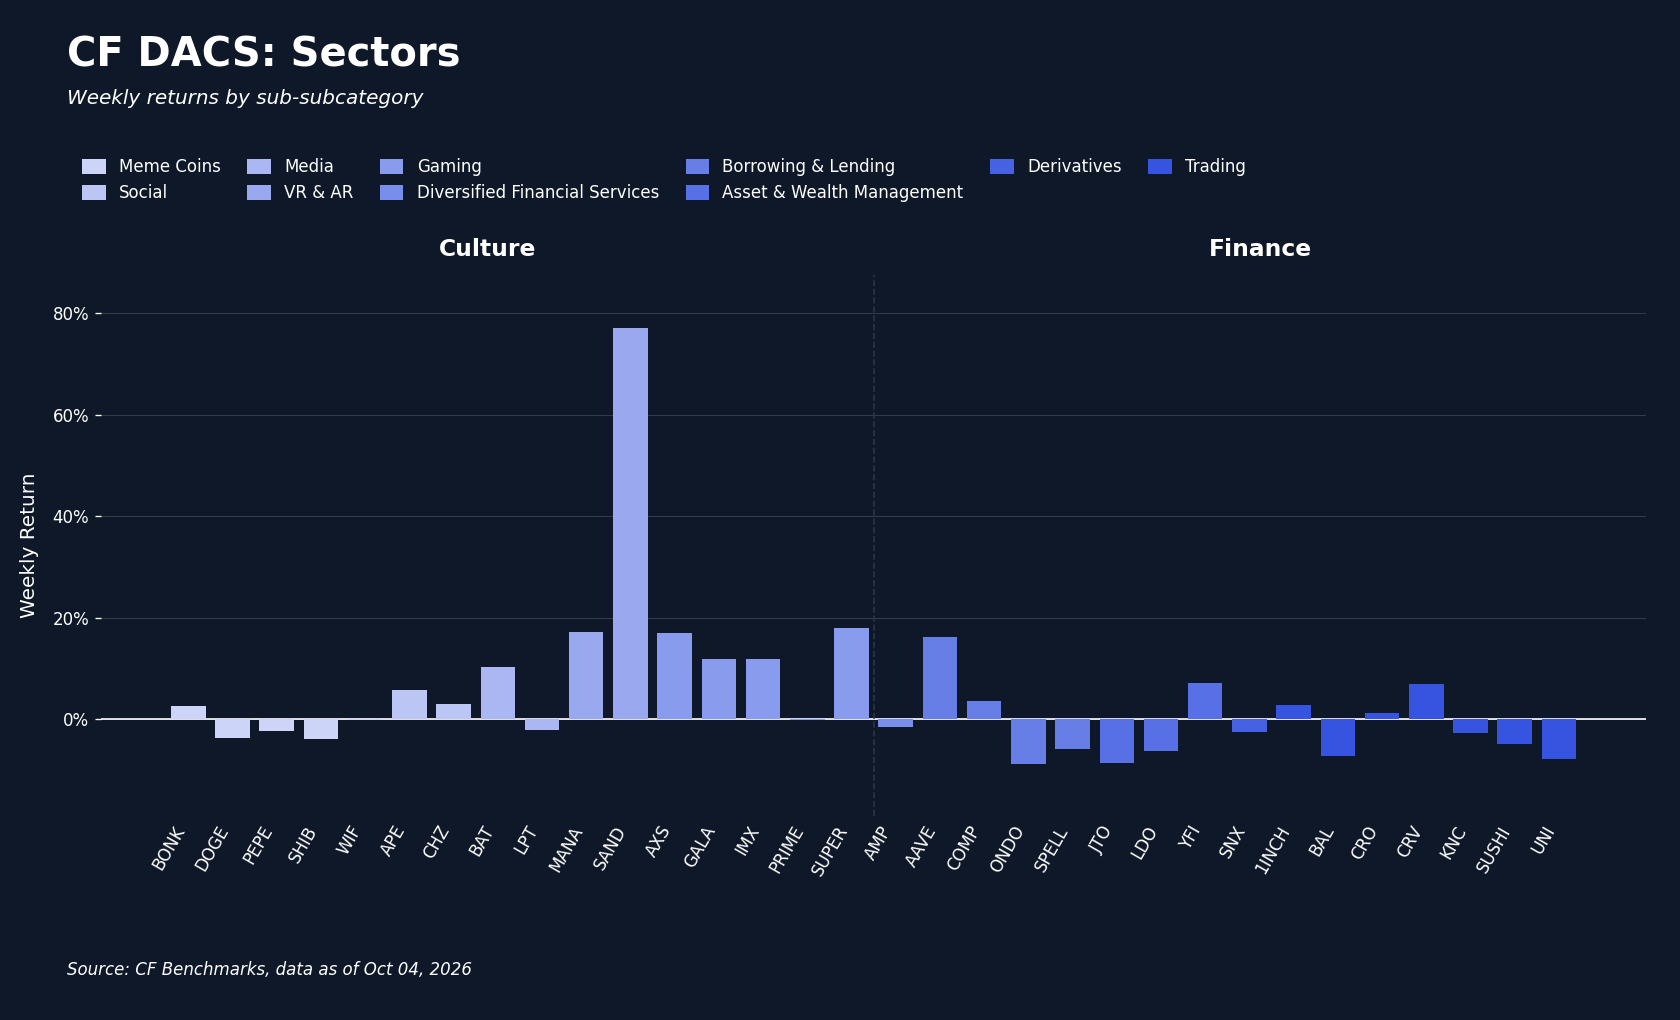
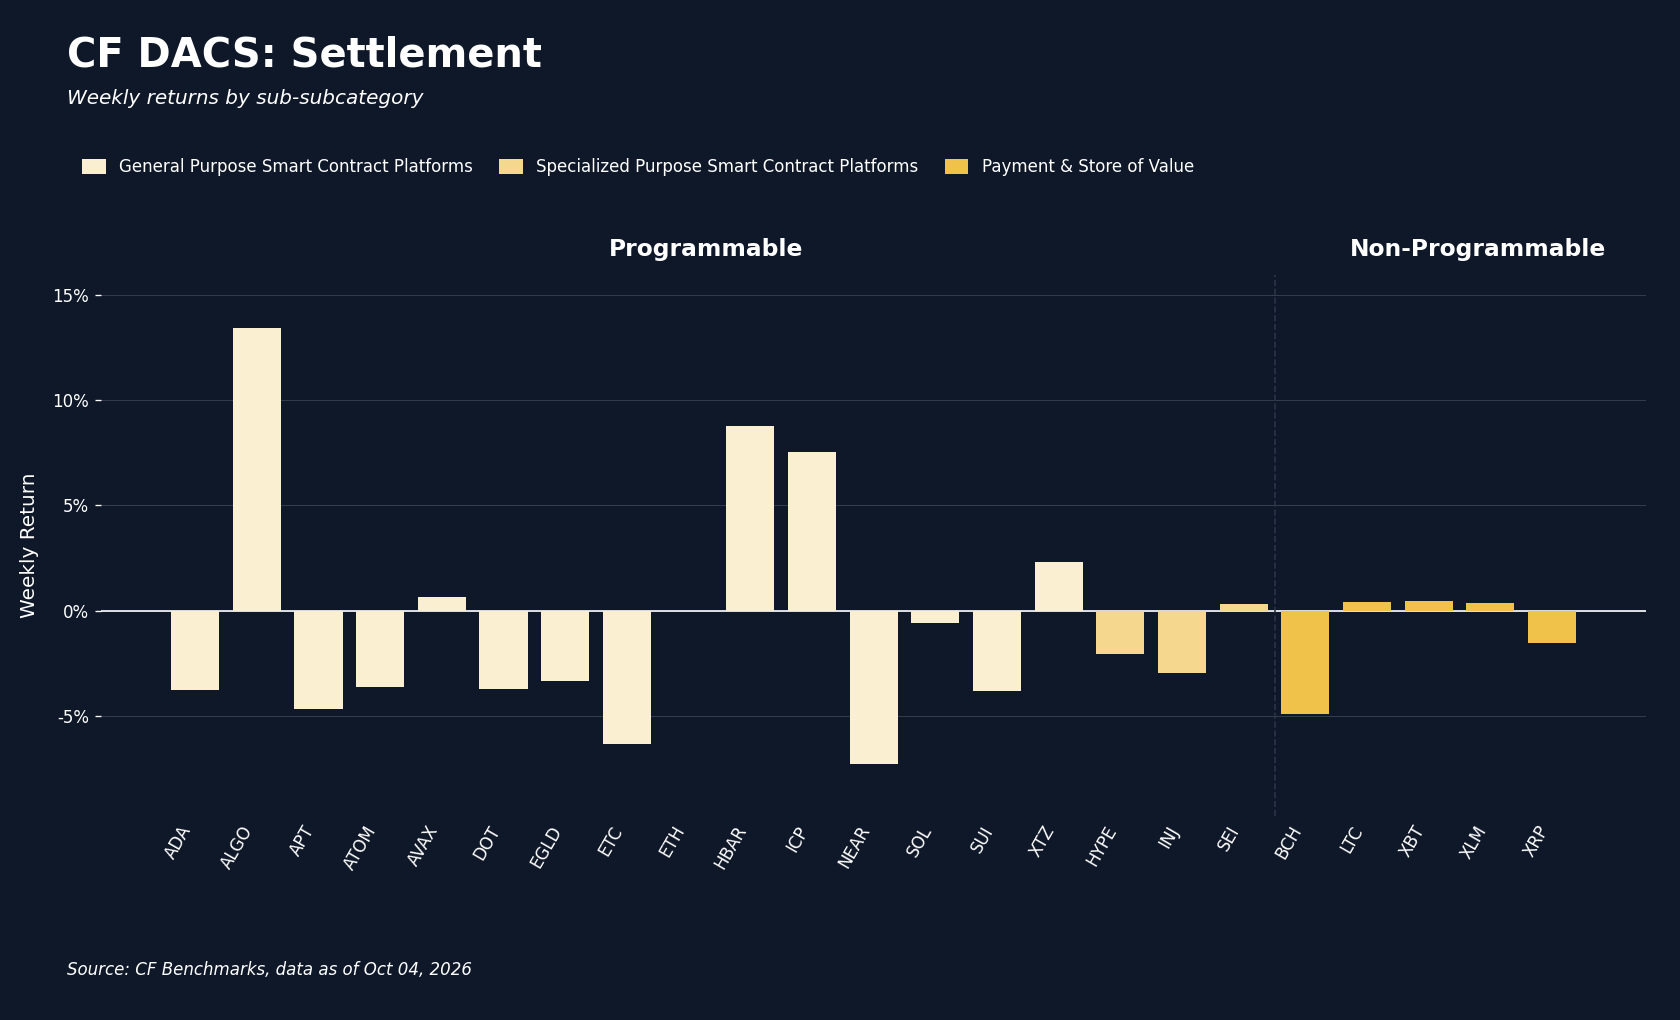
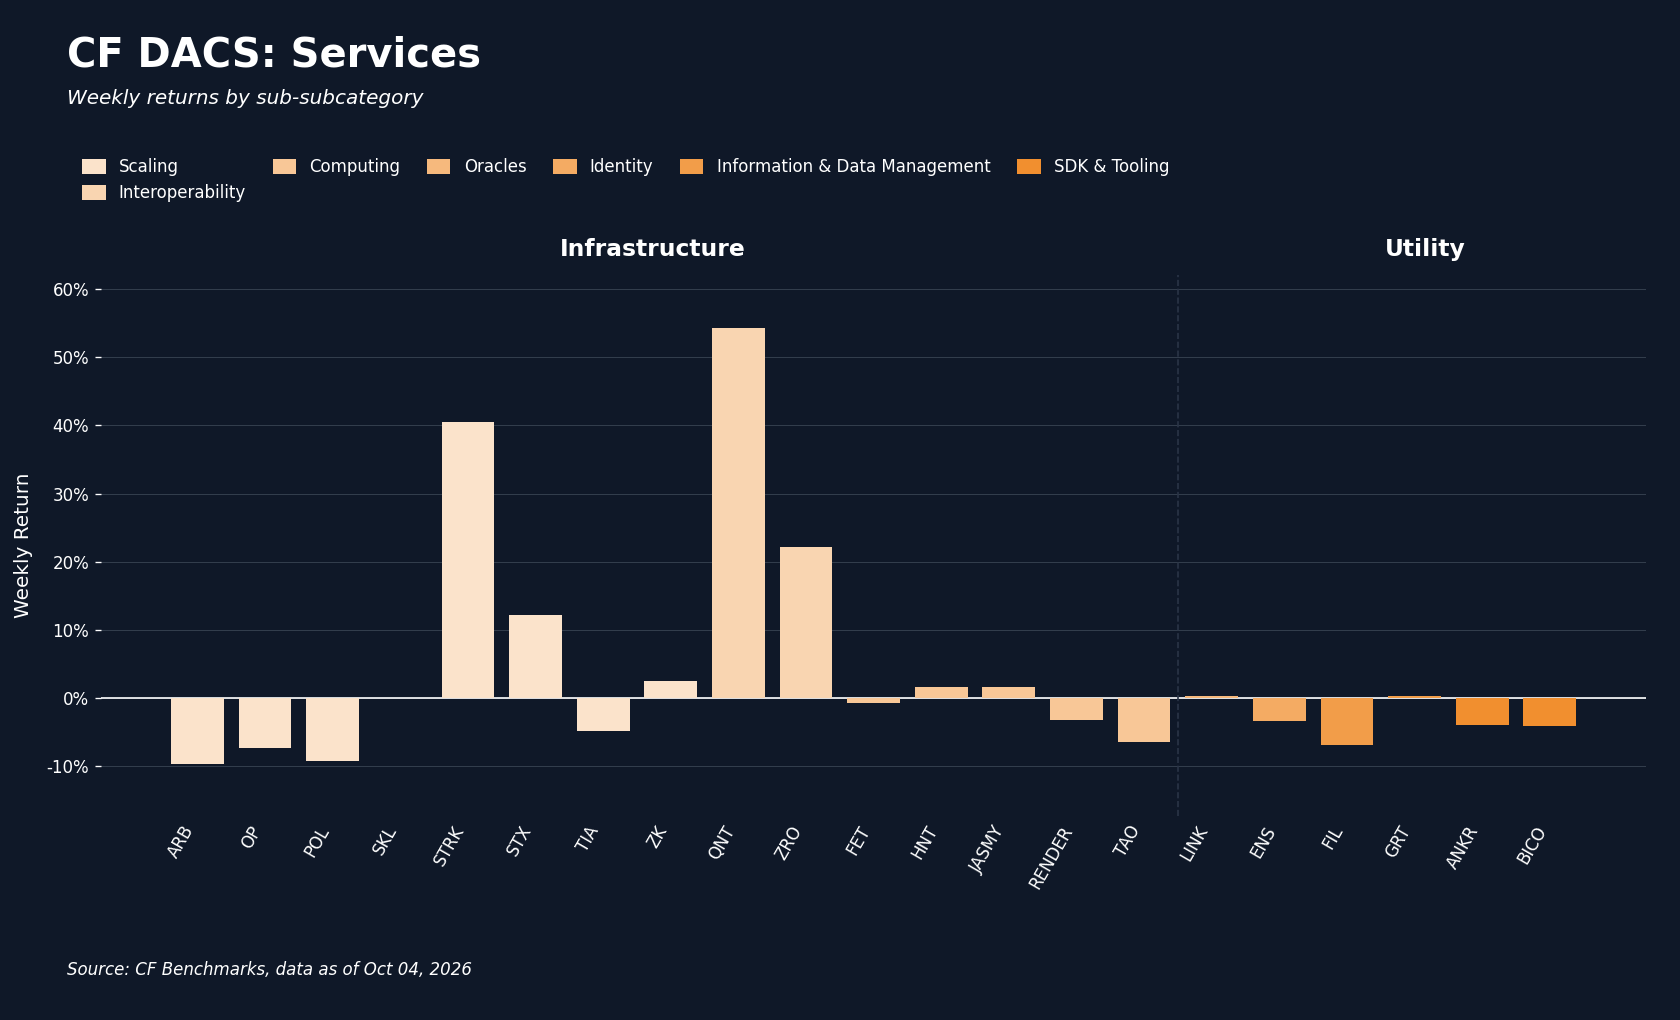
Culture led the CF DACS Sub-Categories at an average of 10.17%, followed by Infrastructure at 6.25%, while the other four averaged declines: Programmable -0.51%, Non-Programmable -1.04%, Finance -1.10% and Utility -2.94%, a 13.11 pp gap from first to last. SAND rose 77.13%, the largest gain among DACS constituents, after Upbit, Bithumb and Coinone lifted on October 2nd the trading caution designations they had imposed after the token's August 22nd bridge exploit, with Bithumb and Coinone also resuming deposits and withdrawals; restored access on the venues that had restricted it coincided with the move, along with $8.71 million of short liquidations reported over the following 24 hours. Excluding SAND lowers the Culture average to 5.71%, which would have ranked second behind Infrastructure. Gaming and virtual-world names also traded higher, with SuperVerse (SUPER) up 18.06%, Decentraland (MANA) 17.26%, Axie Infinity (AXS) 17.07%, Immutable (IMX) 11.96% and Gala (GALA) 11.85%, although no token-specific catalyst was found for them. In Infrastructure, QNT extended The Clearing House mandate rally with no new commercial announcement, with part of the move landing shortly after the September 27th fix, as QNT futures open interest reached a reported record on September 30th, and Starknet (STRK) rose 40.52% after an October 2nd bridge-fee subsidy for its strkBTC asset, reversing last week's -12.69%; excluding QNT lowers the Infrastructure average to 2.82%. Aave (AAVE) gained 16.23% in Finance alongside an October 2nd proposal to place its brand and intellectual property in a Cayman Islands foundation, while Arbitrum (ARB) at -9.62% and Polygon (POL) at -9.24% were the weakest constituents, with no token-specific catalyst identified. Hyperliquid (HYPE), which joins this report's DACS coverage this week in Programmable (Specialized Purpose Smart Contract Platforms), fell 2.06%, as neither its first reserve-yield distribution for buybacks nor a disclosed 3.75 million token over-the-counter transfer produced a measurable price response. Of 76 constituents with valid weekly returns, 34 rose and 41 fell, and SAND and ARB defined an 86.75 pp spread. Sub-category leadership rested on a handful of access and mandate events, with most constituents lower on the week.
CF Staking Series
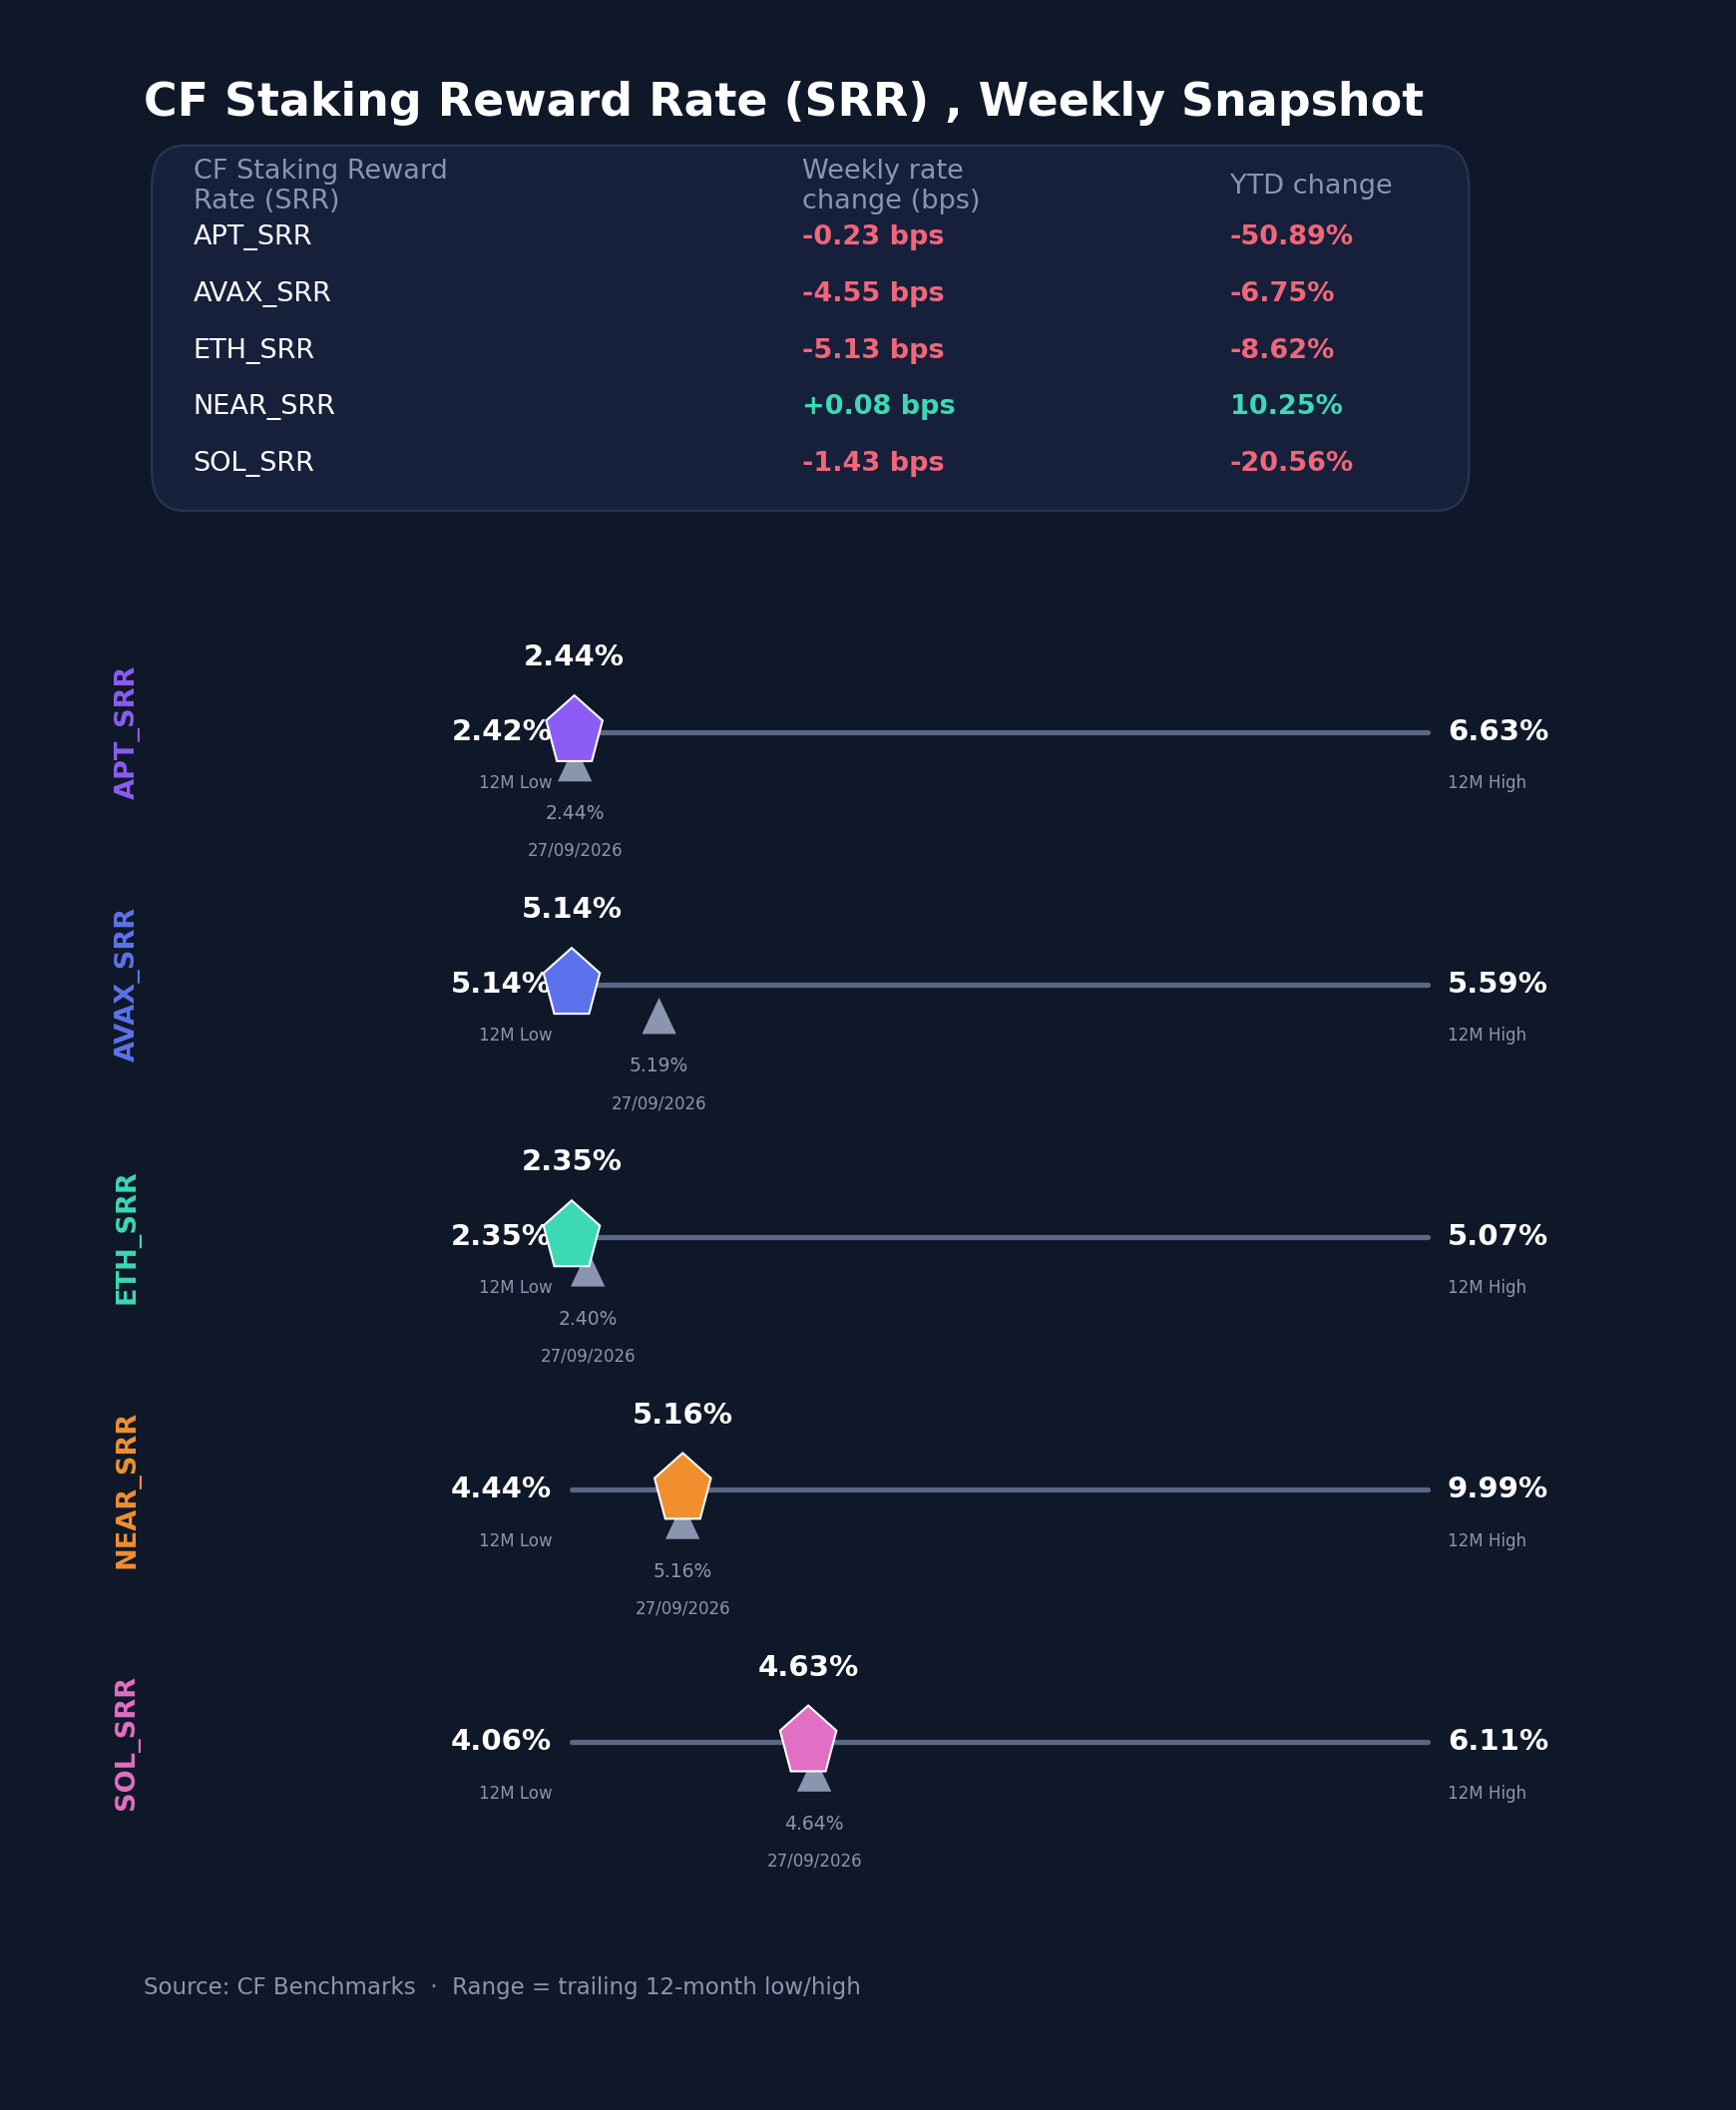
Reward rates eased across most of the CF Staking Series, and Near Protocol (NEAR) moved to the top of the set. Ether (ETH) posted the largest relative decline in its rate index at -2.14% w/w, as its reward rate fell 5.1 basis points (bps) to 2.3472% from 2.3985%. Avalanche (AVAX) declined 0.88%, with its rate down 4.5 bps to 5.1406% from 5.1861%; both now sit at their trailing 12-month lows. Solana (SOL) fell 0.31% as its rate eased 1.4 bps to 4.6271%, and Aptos (APT) 0.09% as its rate slipped 0.2 bps to 2.4375%, 1.3 bps above its 12-month low. NEAR was the only gainer, at +0.02%, its rate edging up 0.1 bps to 5.1619% after increases of 17.5 bps and 19.7 bps over the prior two weeks. That left NEAR 2.1 bps above AVAX, a week after it sat 2.5 bps below. These are relative changes in the rate series, not staking income earned. Reward-rate changes spanned -5.1 bps to +0.1 bps and current rates spanned 2.81 pp, from NEAR at the top to ETH at the bottom. The set was quiet, with ETH and AVAX setting new 12-month lows rather than reacting to the week's spot moves.
Interest Rate Analysis
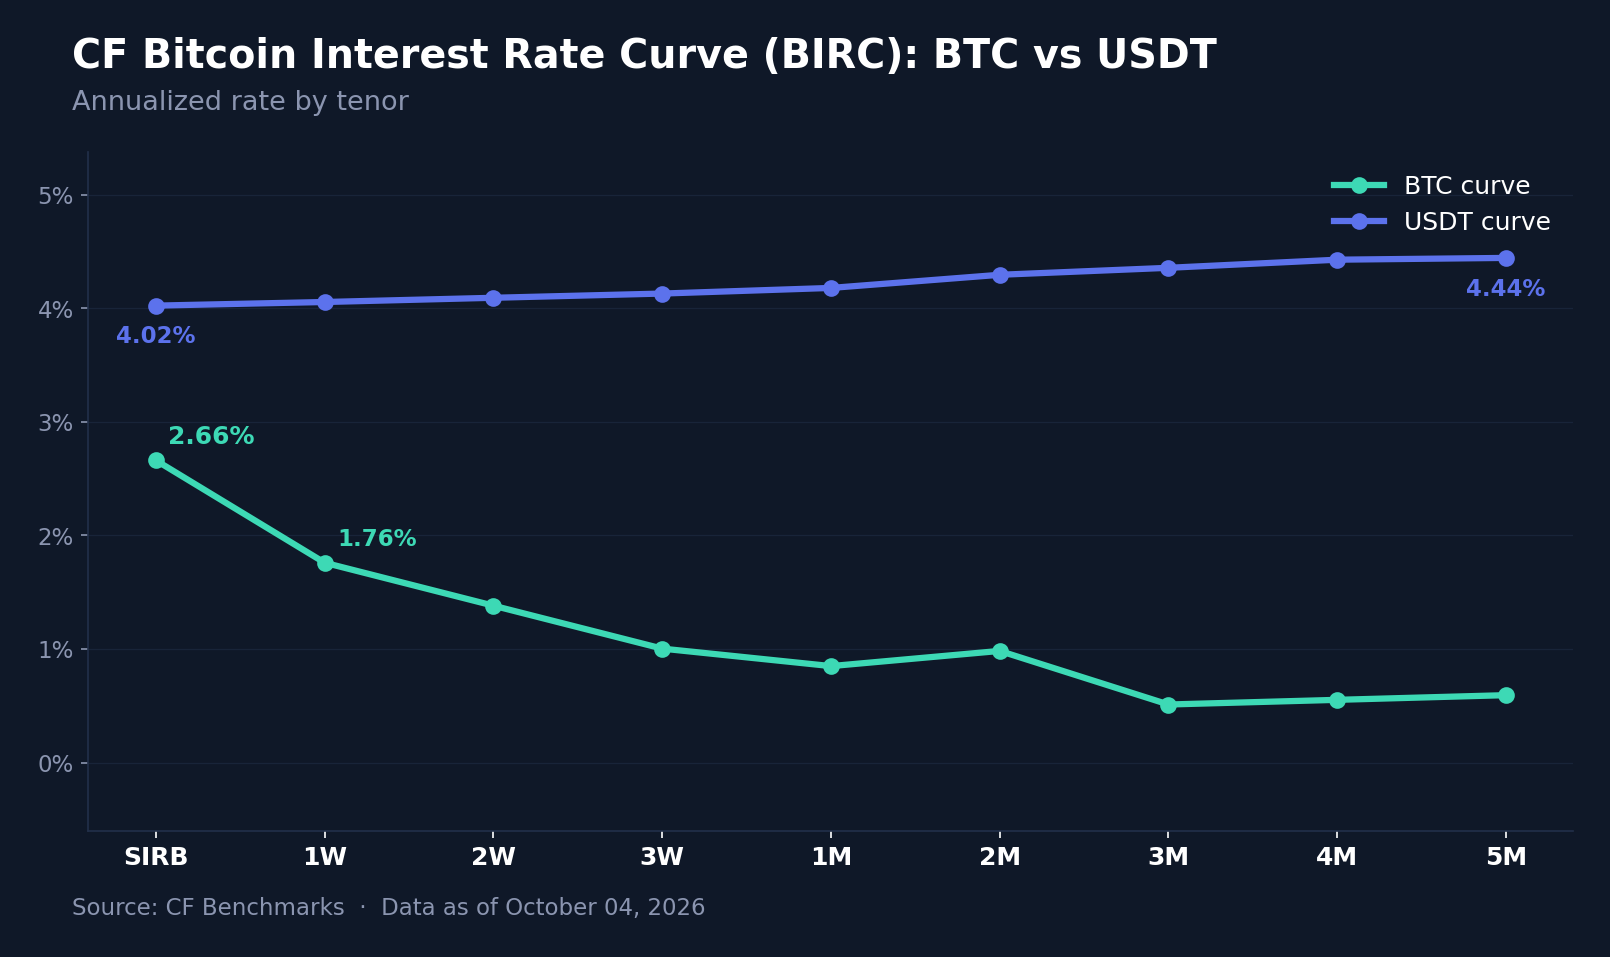
The CF Bitcoin Interest Rate Curve (BIRC) fell at every Tether (USDT) tenor and across the BTC front end, while the BTC back end rose. On the weekly-average basis, BTC's Short-term Interest Rate Benchmark (SIRB) declined 44.4 bps to 2.6605% from 3.1046%, and the decline was steepest in the 2-week and 3-week tenors: 1-week (1W) fell 82.1 bps to 1.7596%, 2-week (2W) 115.3 bps to 1.3817%, 3-week (3W) 114.6 bps to 1.0037% and 1-month (1M) 78.7 bps to 0.8499%, with 2-month (2M) down 40.9 bps to 0.9834%. Beyond that the BTC curve rose, with 3-month (3M) up 16.4 bps to 0.5117%, 4-month (4M) 48.9 bps to 0.5529% and 5-month (5M) 52.7 bps to 0.5940%, after 4M and 5M published only one non-zero print the prior week. The BTC daily prints were unstable, with 1W printing zero from October 2nd to 4th and SIRB ranging from 0.02% to 8.73%, so the weekly means carry more noise than usual. SIRB's premium over 3M narrowed to 214.9 bps from 275.7 bps, leaving the BTC curve inverted but less steeply. USDT fell between 38.5 and 43.0 bps at every tenor, a near-parallel shift that took SIRB to 4.0231%, 1M to 4.1788% and 5M to 4.4431% while preserving the upward slope. USDT's premium over BTC at SIRB widened slightly to 136.3 bps from 133.1 bps. Across both curves, tenor changes ranged from -115.3 bps to +52.7 bps. The parallel decline in dollar stablecoin funding costs coincided with the dovish repricing of front-end Fed expectations, while the BTC curve flattened from the front.
Closing Synthesis
Macro shaped the path of the week more than its outcome. Softer inflation and payrolls data cut priced odds of an October hike, but each BTC advance faded with the 10-year yield near 5.3%, and Friday's reversal from above $87,000 forced out mostly long positions. The largest assets and the capitalization indices finished close to flat, diversified weighting lost its lead, and Ether ETFs recorded net redemptions. Returns concentrated in single-name events: the lifting of SAND's South Korean trading caution designations carried the CF Digital Culture Composite and the Culture sub-category, QNT and STRK carried Infrastructure, and Size and a Monday rebound in Downside Beta led the factors with BTC flat. BVXS held a narrow band while the surface's wings widened, ETH and AVAX reward rates reached 12-month lows, and the USDT curve fell in parallel with front-end rate expectations. The result was a range-bound market at the index level, with the week's dispersion carried by idiosyncratic news beneath it.
The information contained within is for educational and informational purposes ONLY. It is not intended nor should it be considered an invitation or inducement to buy or sell any of the underlying instruments cited including but not limited to cryptoassets, financial instruments or any instruments that reference any index provided by CF Benchmarks Ltd. This communication is not intended to persuade or incite you to buy or sell security or securities noted within. Any commentary provided is the opinion of the author and should not be considered a personalised recommendation. Please contact your financial adviser or professional before making an investment decision.
Note: Some of the underlying instruments cited within this material may be restricted to certain customer categories in certain jurisdictions.
Bitcoin Remains Flat as Yields Soar
Digital assets traded flat over the week as softer US data failed to lift the majors against firm long-end yields. Breadth was weak and leadership narrow: gaming and virtual-world tokens and a few interoperability names carried returns, implied volatility held steady, funding costs eased.

Mark Pilipczuk
Factor Friday - October 2, 2026
Size led the factor table at 8.86% as the Market finished flat, with Downside Beta and Liquidity next and Momentum last. Much of the move traces to Quant (QNT), up 200% on the week, so the rotation is narrower than the rankings suggest.
Mark Pilipczuk
Crypto Rallies After The CLARITY Act Stalls
Digital assets rallied in September despite the Fed's first rate hike since 2023 and a failed Senate vote on the CLARITY Act. All eight CF Benchmarks indices rose, led by DeFi at 31.8%, as smaller caps outpaced the majors and fund inflows slowed to $3.8 billion, down 35.3% from August.
Mark Pilipczuk
By clicking Accept, you consent to CF Benchmarks's use of cookies.
Visit Cookie Settings to learn how CF Benchmarks uses cookies and to adjust your preferences.