
Jul 13, 2026
Bitcoin ETF Outflow Streak Ends as BVX Falls to a 12-Month Low
Weekly Index Highlights, July 13, 2026
Digital assets advanced despite continued macro pressures. Wednesday July 8th's June FOMC minutes read hawkish, a unanimous hold at 3.50% to 3.75% with the easing bias gone and staff inflation forecasts raised, and Bitcoin traded roughly 2.7% lower around the release before retracing the dip by Friday; the week's direction was set instead by the return of ETF demand, with spot Bitcoin funds posting their first weekly net inflow in more than two months and the Ether funds snapping an eight-week outflow run in the same week. That demand arrived narrowly. Only three of the seven CF Single Asset Series names closed higher, the free-float capitalization indices outran their diversified counterparts by more than one and a half percentage points, and BVXS compressed to within three vol. points of its 12-month low. Our read: the market is rebuilding exposure through the flagship wrappers, not re-risking across the board.
Market Performance Update
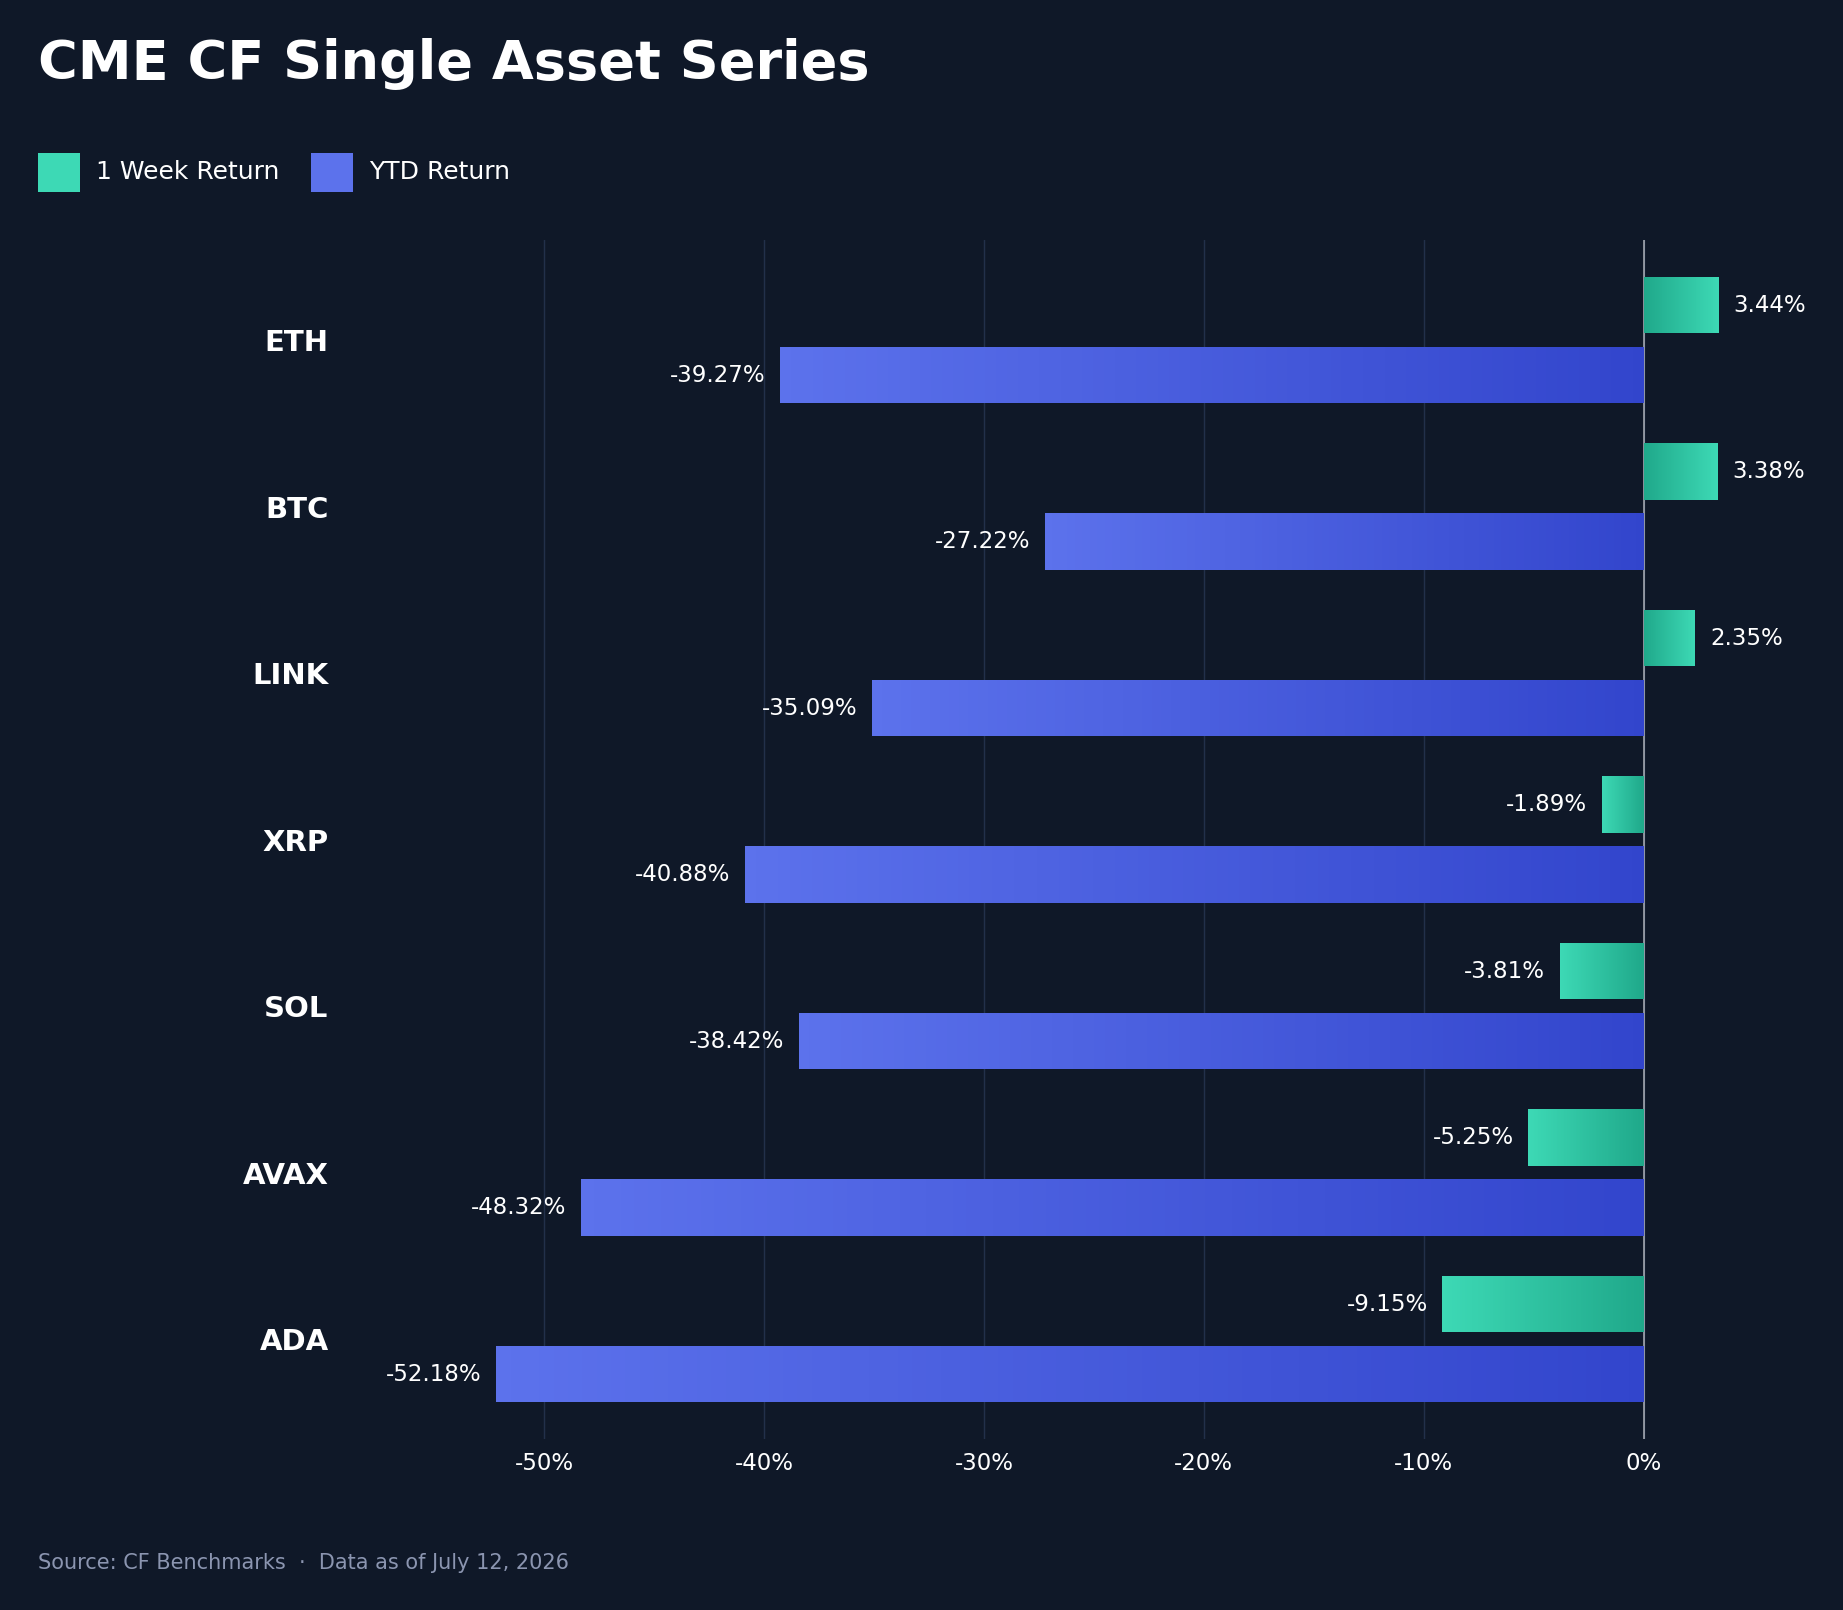
Digital assets split along a single line in the July 6th to July 12th window: three names rose, led by the two ETF-wrapped majors, and the other four fell. Ether (ETH) led the CF Single Asset Series at +3.44% week-on-week (w/w), leaving it -39.3% year-to-date (YTD), with Bitcoin (BTC) at +3.38% (YTD -27.2%) and Chainlink (LINK) the only other gainer at +2.4% (YTD -35.1%). The rest of the set declined: XRP lost 1.9% (YTD -40.9%), Solana (SOL) 3.8% (YTD -38.4%), Avalanche (AVAX) 5.2% (YTD -48.3%) and Cardano (ADA) 9.2% (YTD -52.2%), a 12.6 percentage point (pp) weekly range in which ADA gave back part of the prior week's +31.1% recovery leg. The macro calendar shaped the path more than the destination: BTC had held the $63,000 area into the minutes with options positioning call-heavy, traded near $62,240 in the session after the release, roughly 2.7% lower over the surrounding 24 hours, then retraced the dip by Friday as 10-year yields eased for a second session; Monday's ISM Services print (54.0% against a 54.2% consensus) and Thursday's claims (215k against 217k) were non-events the tape ignored. What set the week's direction was flow. Spot Bitcoin ETFs posted their first weekly net inflow in more than two months, the Ether funds snapped an eight-week outflow run alongside, and the week's gains concentrated in exactly the two assets those wrappers hold.
Volatility Analysis
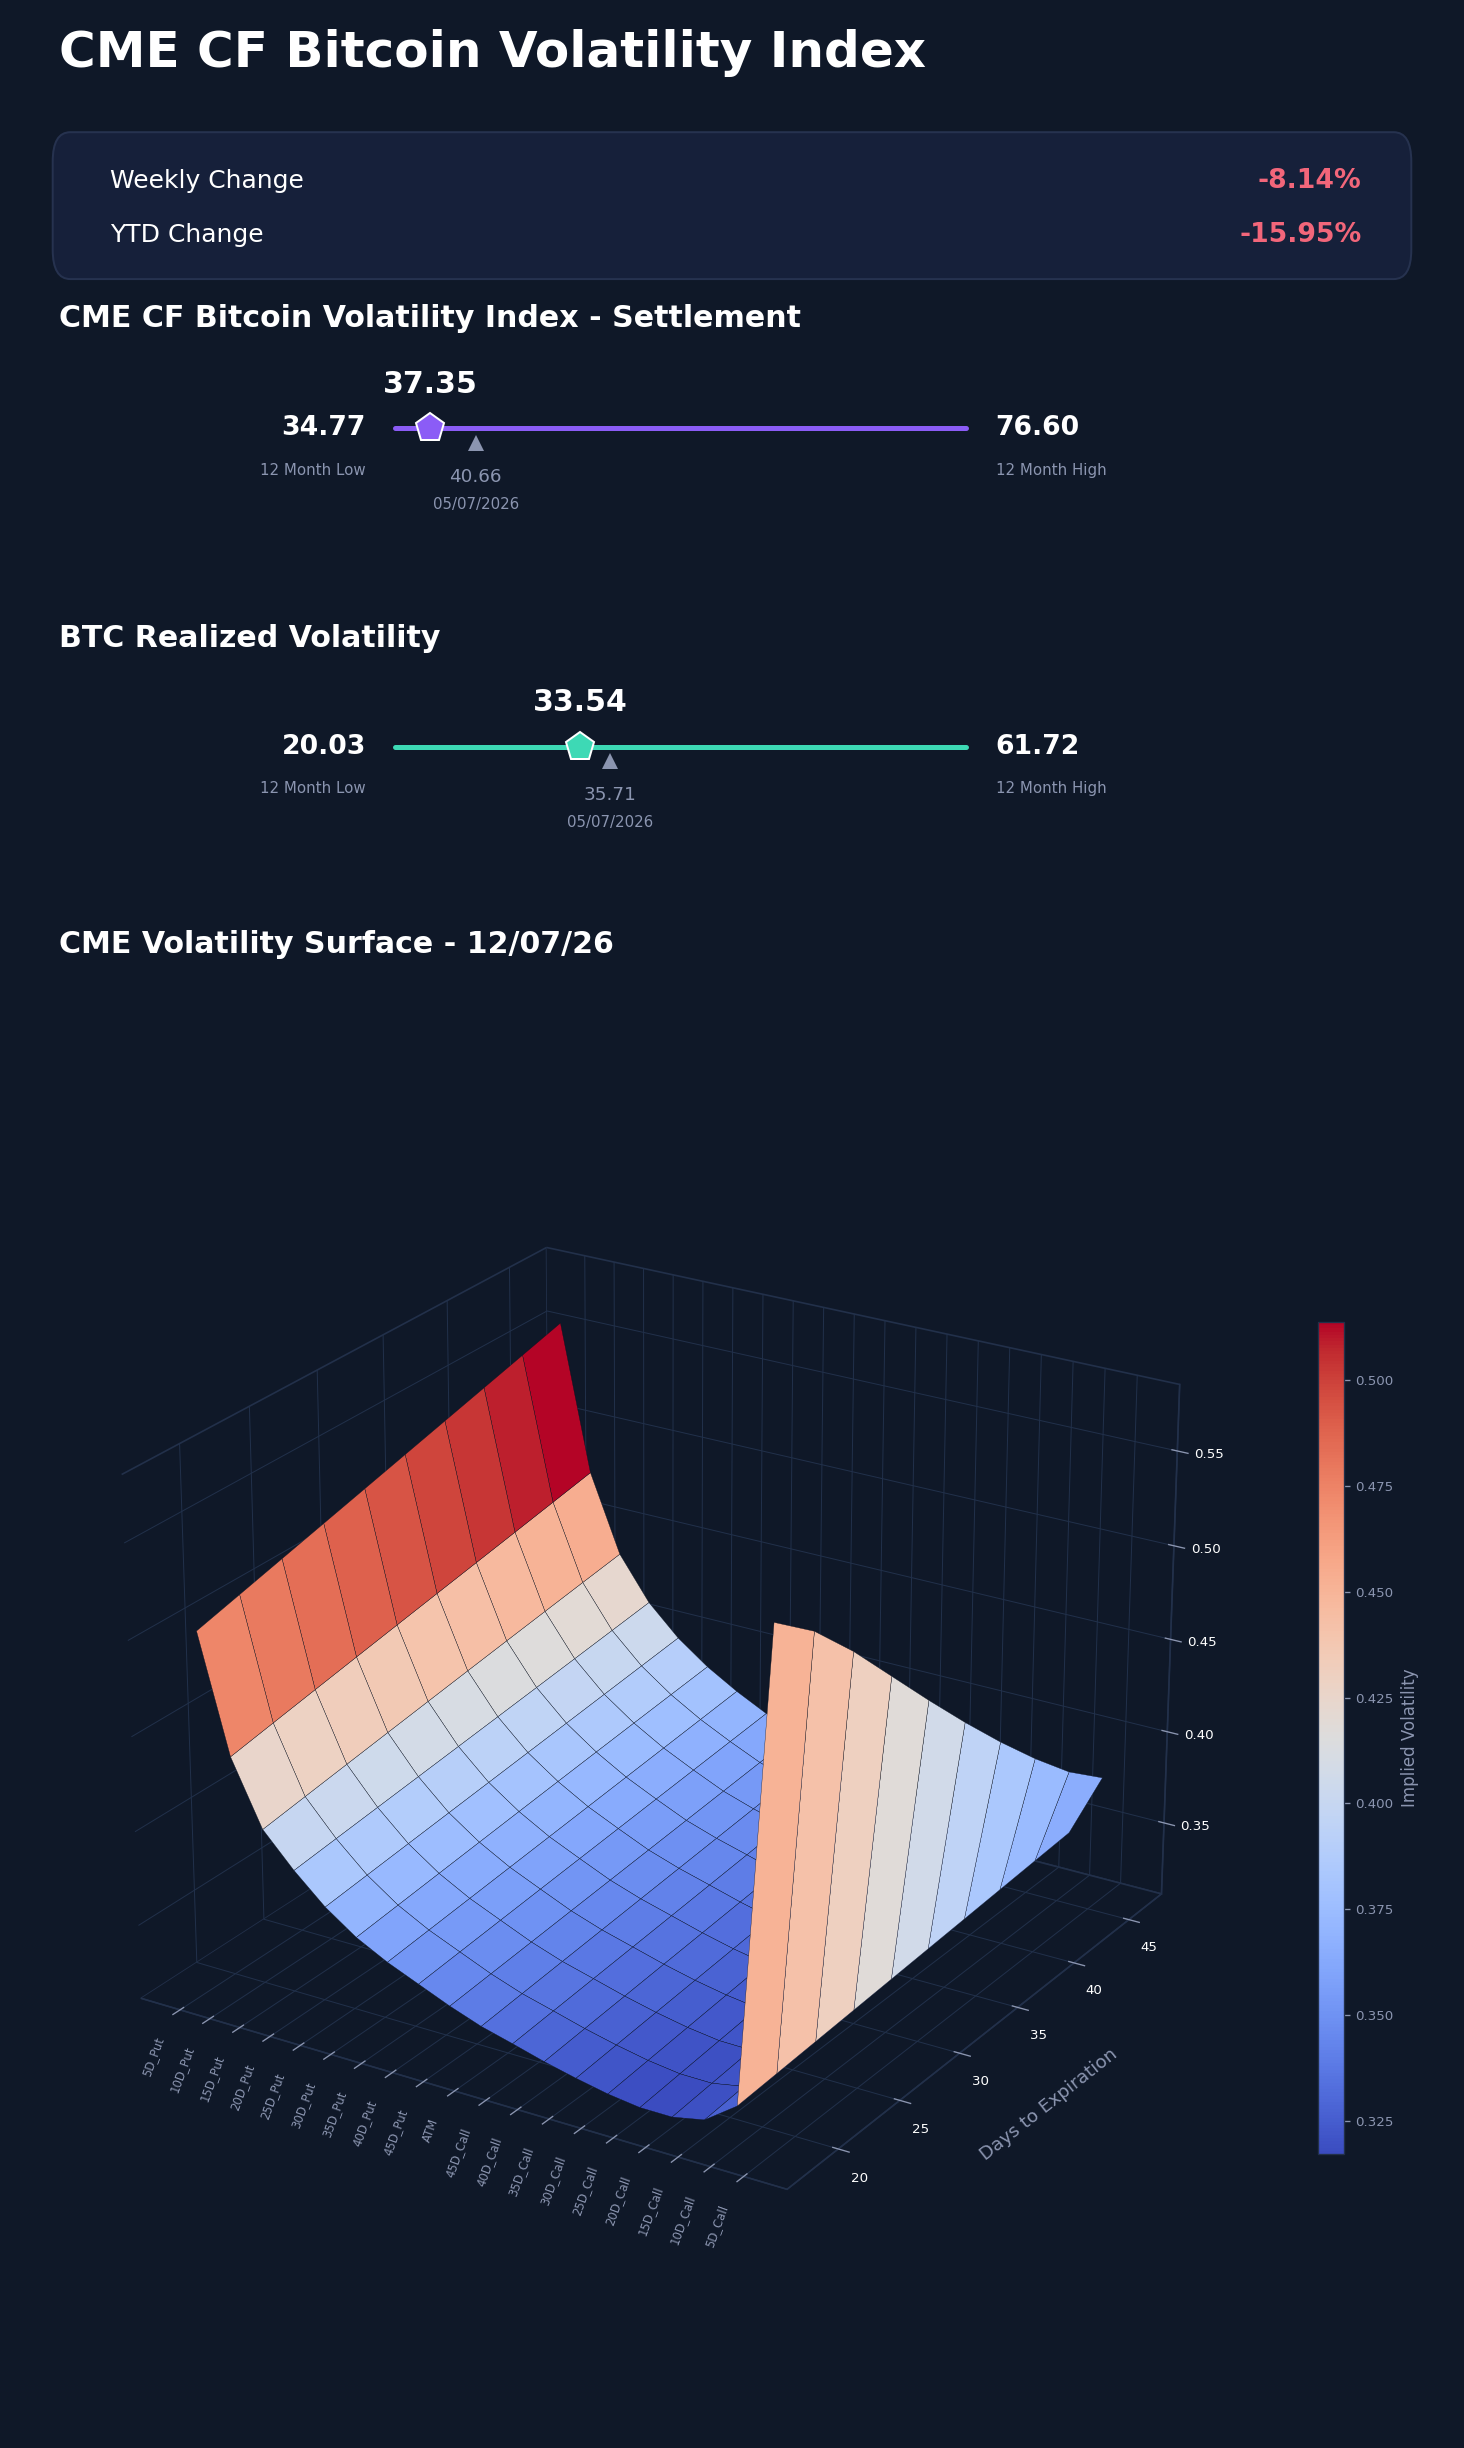
Bitcoin volatility compressed for a second consecutive week, and the path shows the compression was event-shaped. Our CME CF Bitcoin Volatility Index - Settlement (BVXS) opened the week at 40.94, printed its weekly high of 41.41 on Wednesday July 8th as the FOMC minutes landed, then stepped down through 38.82 and 37.91 to finish Sunday July 12th at 37.35, 3.31 vol. points below the prior Sunday's 40.66 close; options markets paid up for protection into the release and let it bleed once the minutes confirmed June's hawkishness rather than escalating it. Realized volatility fell alongside, from 35.71 at the prior weekly close to 33.54, a 2.16 vol. point decline, so the implied premium over realized narrowed from 4.95 vol. points to 3.81. The index now sits 2.58 vol. points above its 34.77 twelve-month low, while realized volatility remains 13.51 points above its own 20.03 floor, and BVXS closed 15.95% below its 44.44 start-of-year reference. The surface confirms the unwind and adds one wrinkle: against the prior week's snapshot, implied vol was marked down roughly 3.4 to 4.9 vol. points across the put wing and ATM with the downside put skew marginally flatter, while the shortest-dated call wing went the other way, 5-delta calls under three weeks to expiry pricing near 58 vol. against an ATM trough near 33.5, a kink absent a week earlier. Protection bought during the June hike-risk stretch keeps getting cheaper, and the one pocket of fresh options demand sat in inexpensive short-dated upside rather than downside cover.
Market Cap Index Performance
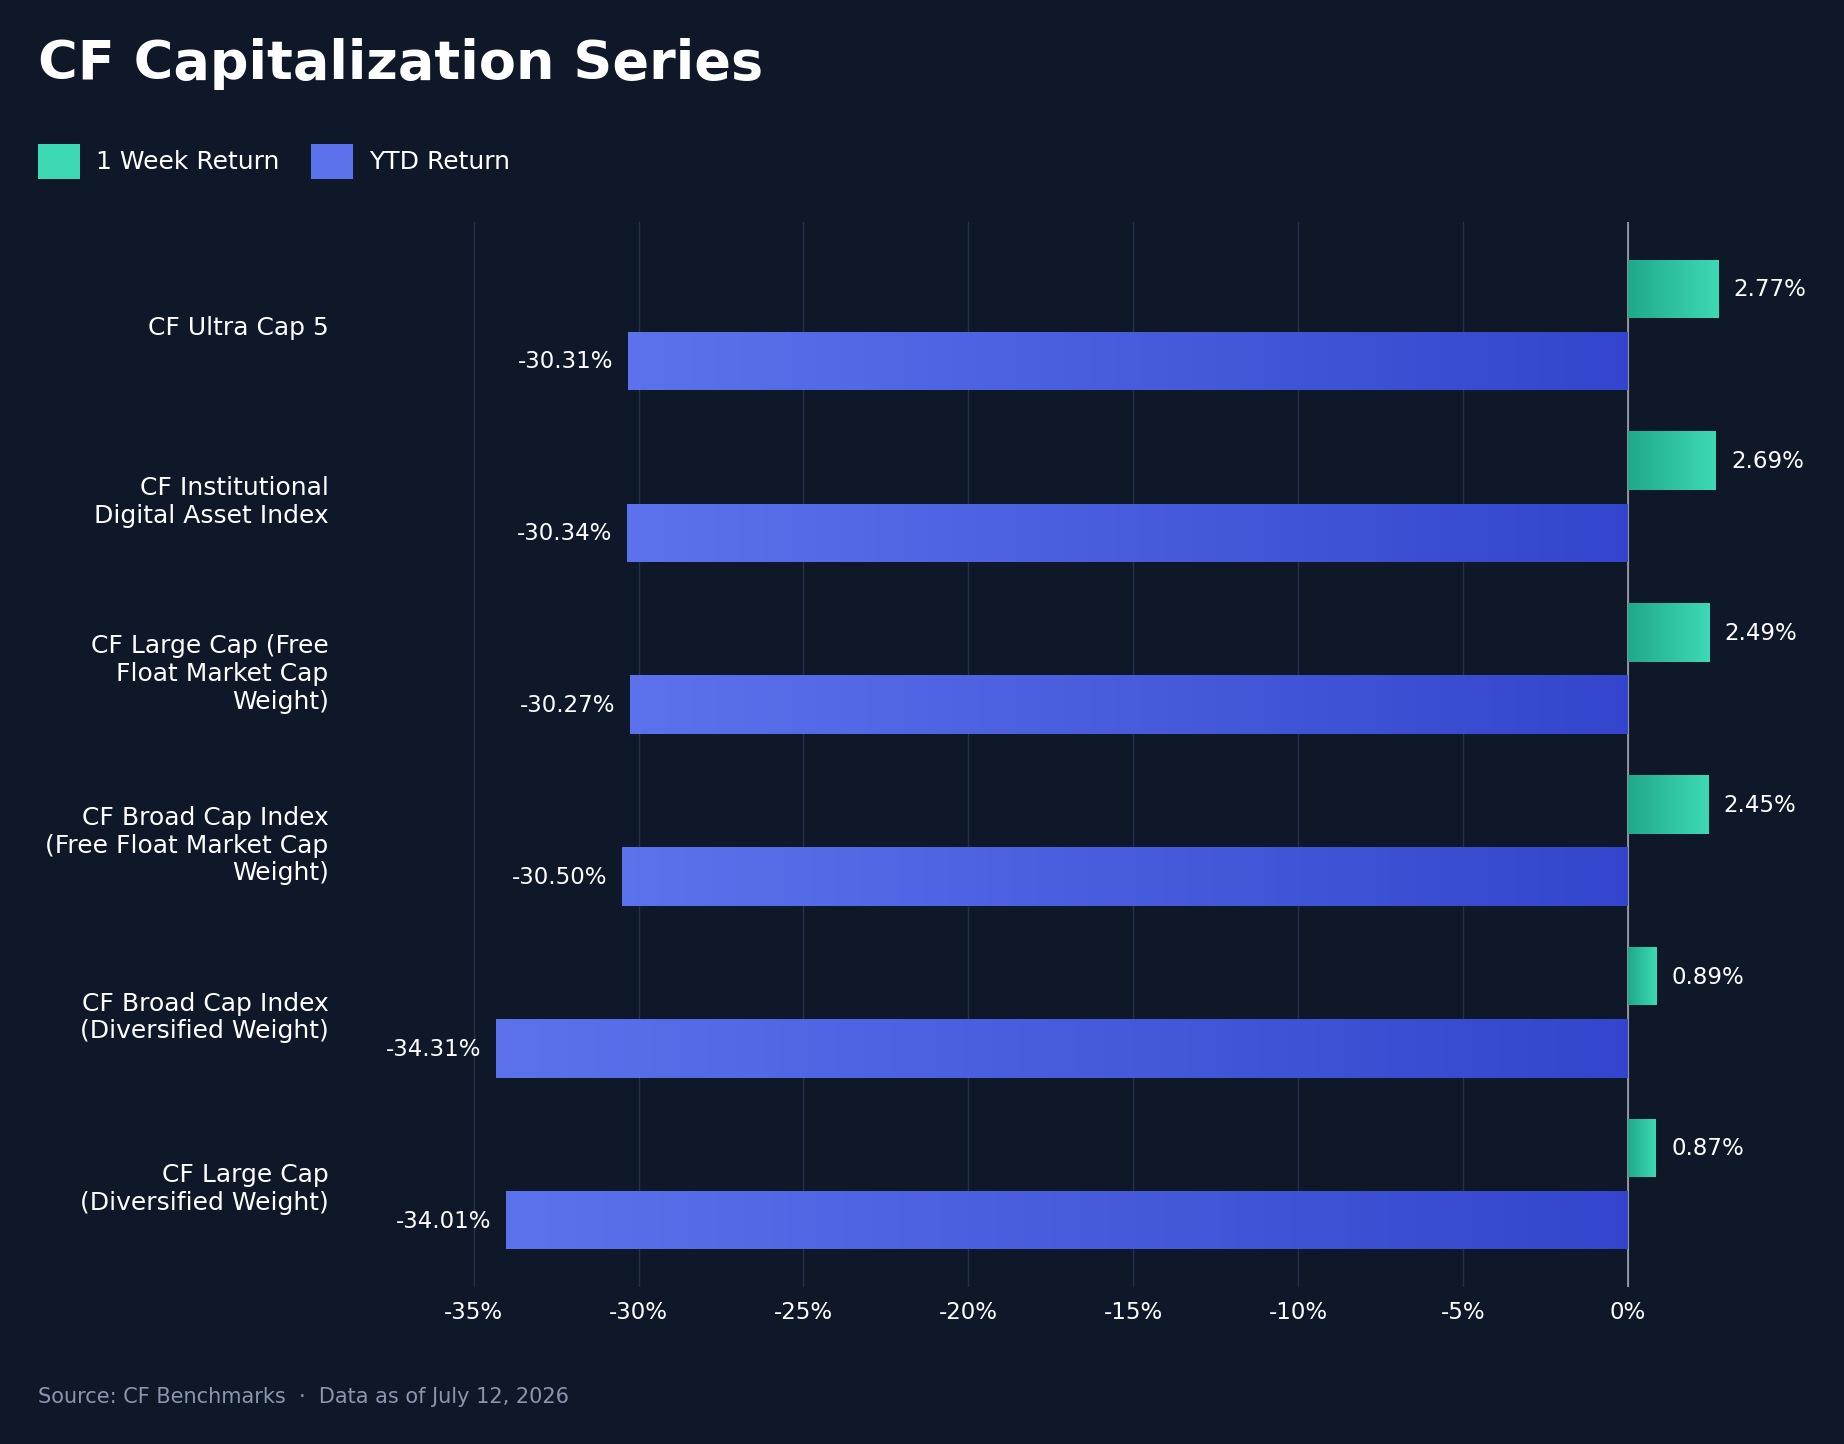
All six CF Capitalization Series indices closed higher, but the weighting scheme decided by how much. CF Ultra Cap 5 led at +2.77% w/w (YTD -30.31%), with the CF Institutional Digital Asset Index at +2.69% (YTD -30.34%), the CF Large Cap (Free Float Market Cap Weight) at +2.49% (YTD -30.27%) and the CF Broad Cap Index (Free Float Market Cap Weight) at +2.45% (YTD -30.50%); the diversified variants sat well below them, the CF Broad Cap Index (Diversified Weight) at +0.89% (YTD -34.31%) and the CF Large Cap (Diversified Weight) at +0.87% (YTD -34.01%). The free-float measures outran their diversified counterparts by 1.56 pp at the broad-cap level and 1.63 pp at the large-cap level, an exact inversion of the prior week, when diversified weighting led by a similar margin on the mid-cap rally. The flow backdrop explains the flip: the spot Bitcoin ETF complex took in $197m net for the week, ending an eight-week redemption run of more than $8bn and going negative only around the minutes ($84.8m and $95.0m out on Wednesday and Thursday), while the ETH funds added $84.4m. Demand entering through the wrappers accrues to the mega caps that dominate free-float weights; diversified weighting holds proportionally more of the mid-cap names that fell. YTD the free-float indices remain 3.7 to 3.8 pp ahead, a gap one week of wrapper-led demand extended rather than repaired.
Factors Analysis
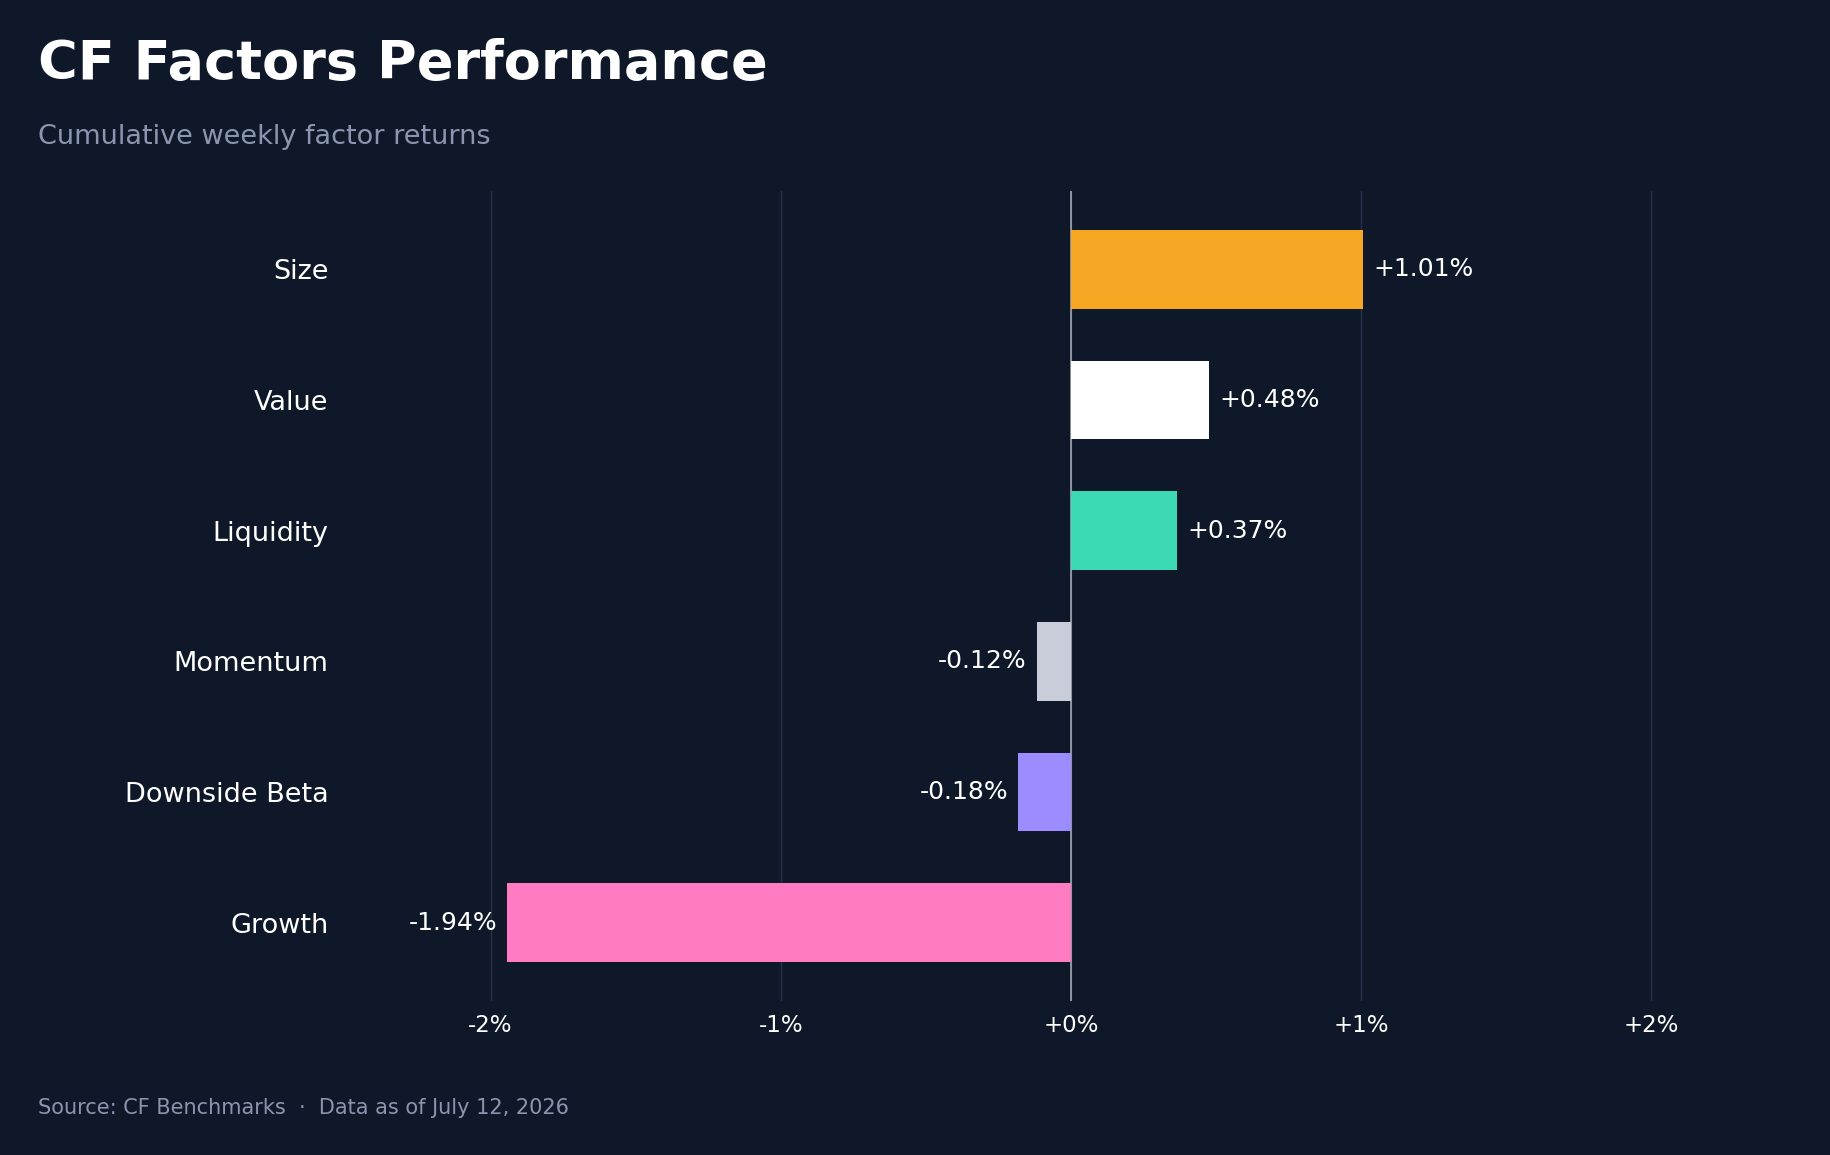
Cumulative weekly factor returns rebuilt part of what the prior week's relief rally had unwound. Size moved from -1.8% to +1.0% and Value from -2.3% to +0.5%, matching +2.8 pp swings that restored the two exposures sold once the payrolls miss had removed the reason to hold them; with no fresh macro relief this week, that unwind itself unwound. Growth funded the rotation, flipping from +0.3% to -1.9%, a -2.2 pp move and the only negative swing in the set. Momentum improved from -1.0% to -0.1%, Downside Beta from -1.7% to -0.2%, and Liquidity was essentially unchanged at +0.4%. The factor cross-section ran from Growth's -1.9% to Size's +1.0%, a 2.95 pp spread in a week when the single-asset range was several times wider; style moved far less than the assets themselves, which is what a tape driven by two ETF-fed mega caps rather than by a style preference looks like at the factor level.
Read our latest weekly crypto factors report: Factor Friday - July 10, 2026
Classification Series Analysis
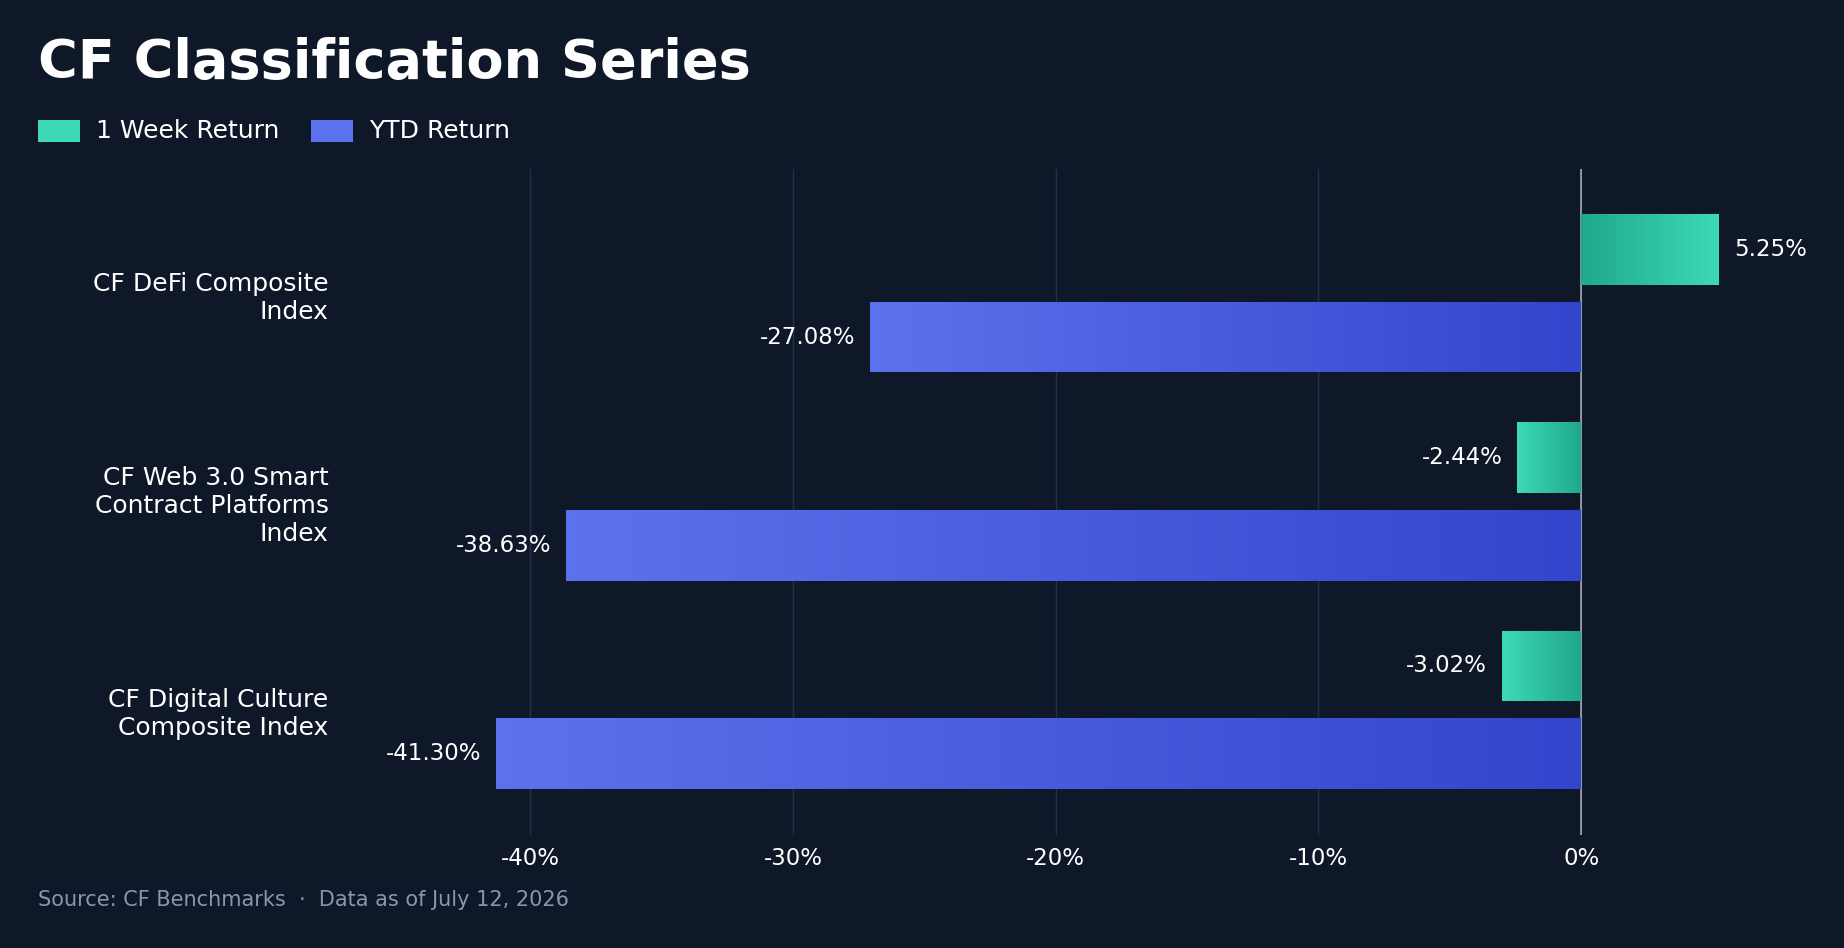
Across the CF Classification Series, only DeFi rose. The CF DeFi Composite Index gained 5.25% w/w (YTD -27.08%), while the CF Web 3.0 Smart Contract Platforms Index fell 2.44% (YTD -38.63%) and the CF Digital Culture Composite Index lost 3.02% (YTD -41.30%), leaving DeFi 7.70 pp ahead of Web 3.0 and 8.28 pp ahead of Culture. The composite outran even the ETF-fed majors, and the strength was internal: the same decentralized-exchange and liquid-staking bid covered in the sector section carried the index, not a broad thematic re-rating. Web 3.0's decline traces to the beta fade beneath the mega caps, with ADA and the other platform names giving back part of the prior week's recovery, and Culture's loss carries the week's governance-attack drag. The YTD ordering is unchanged, DeFi holding the shallowest drawdown of the three and Culture the deepest; this week widened both gaps.
Sector Analysis
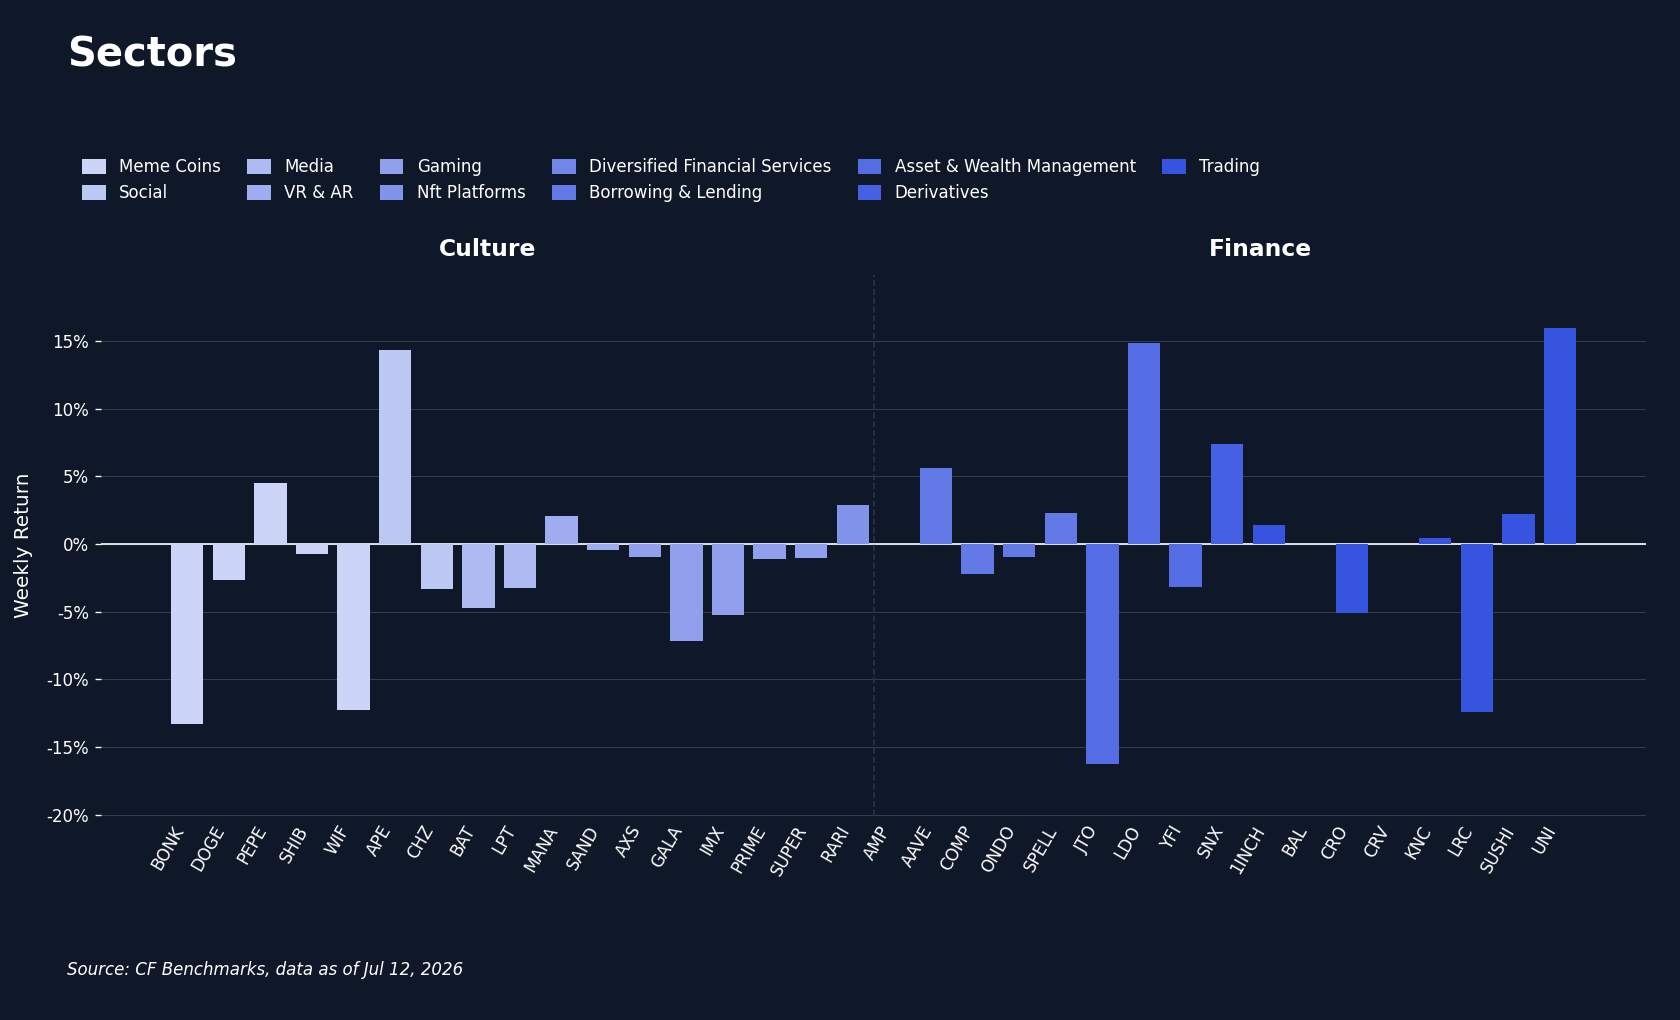
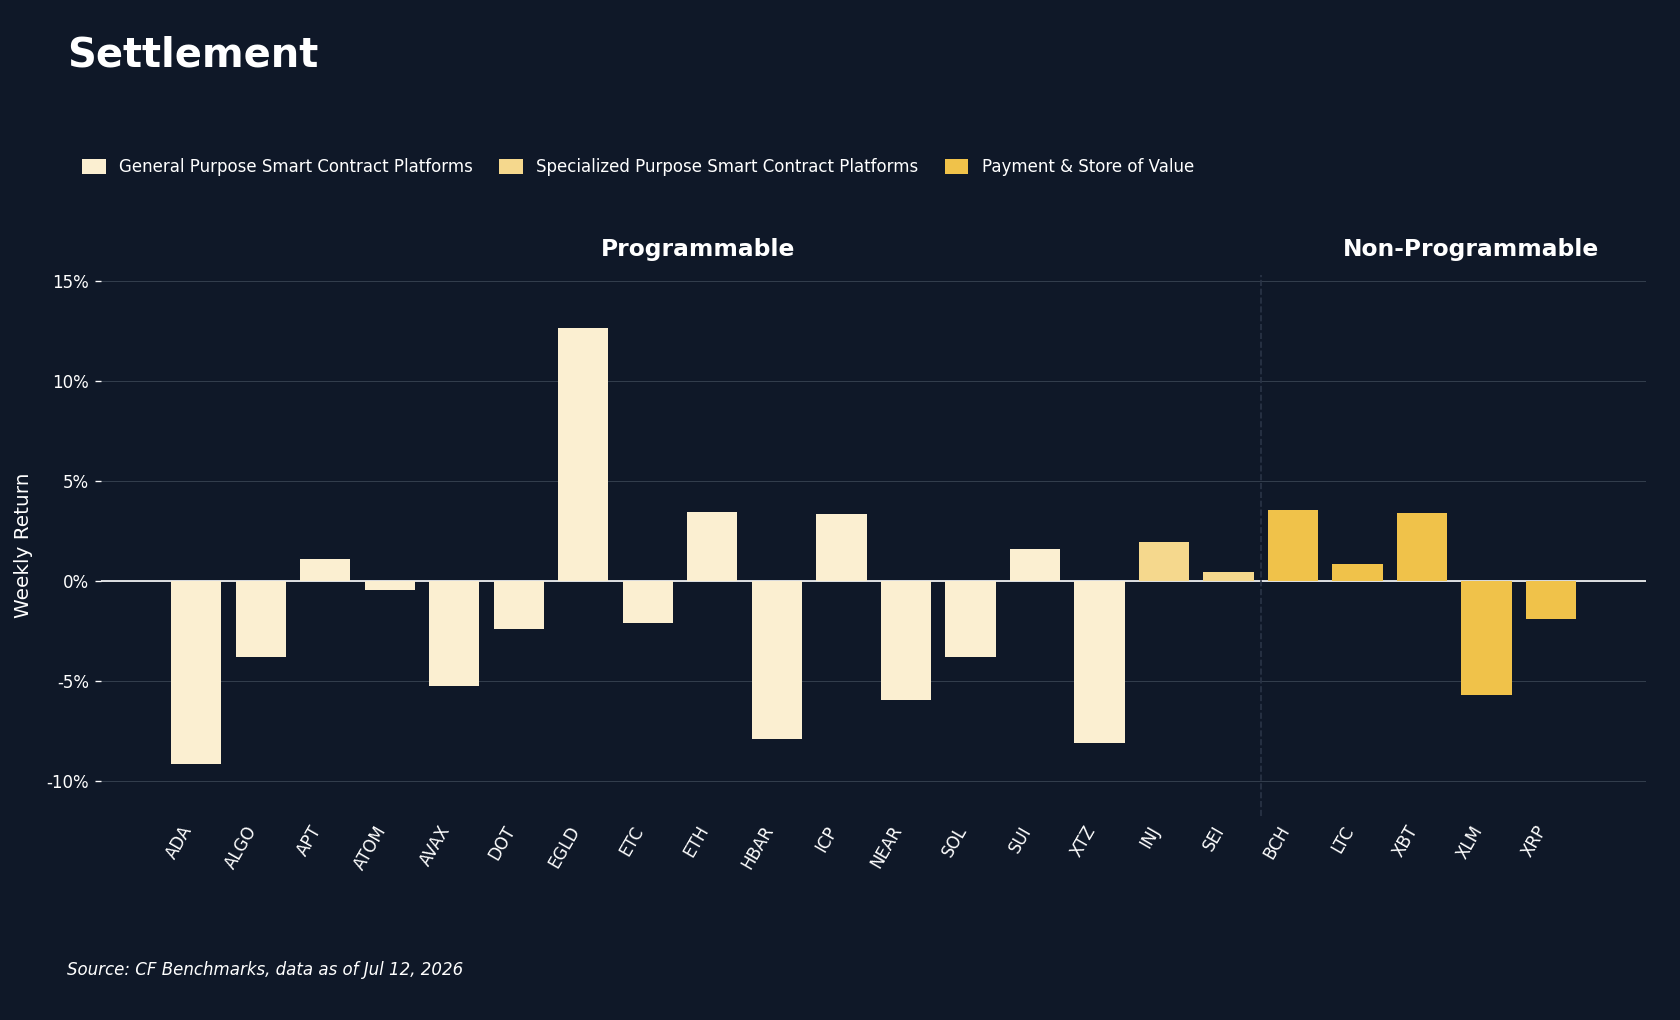
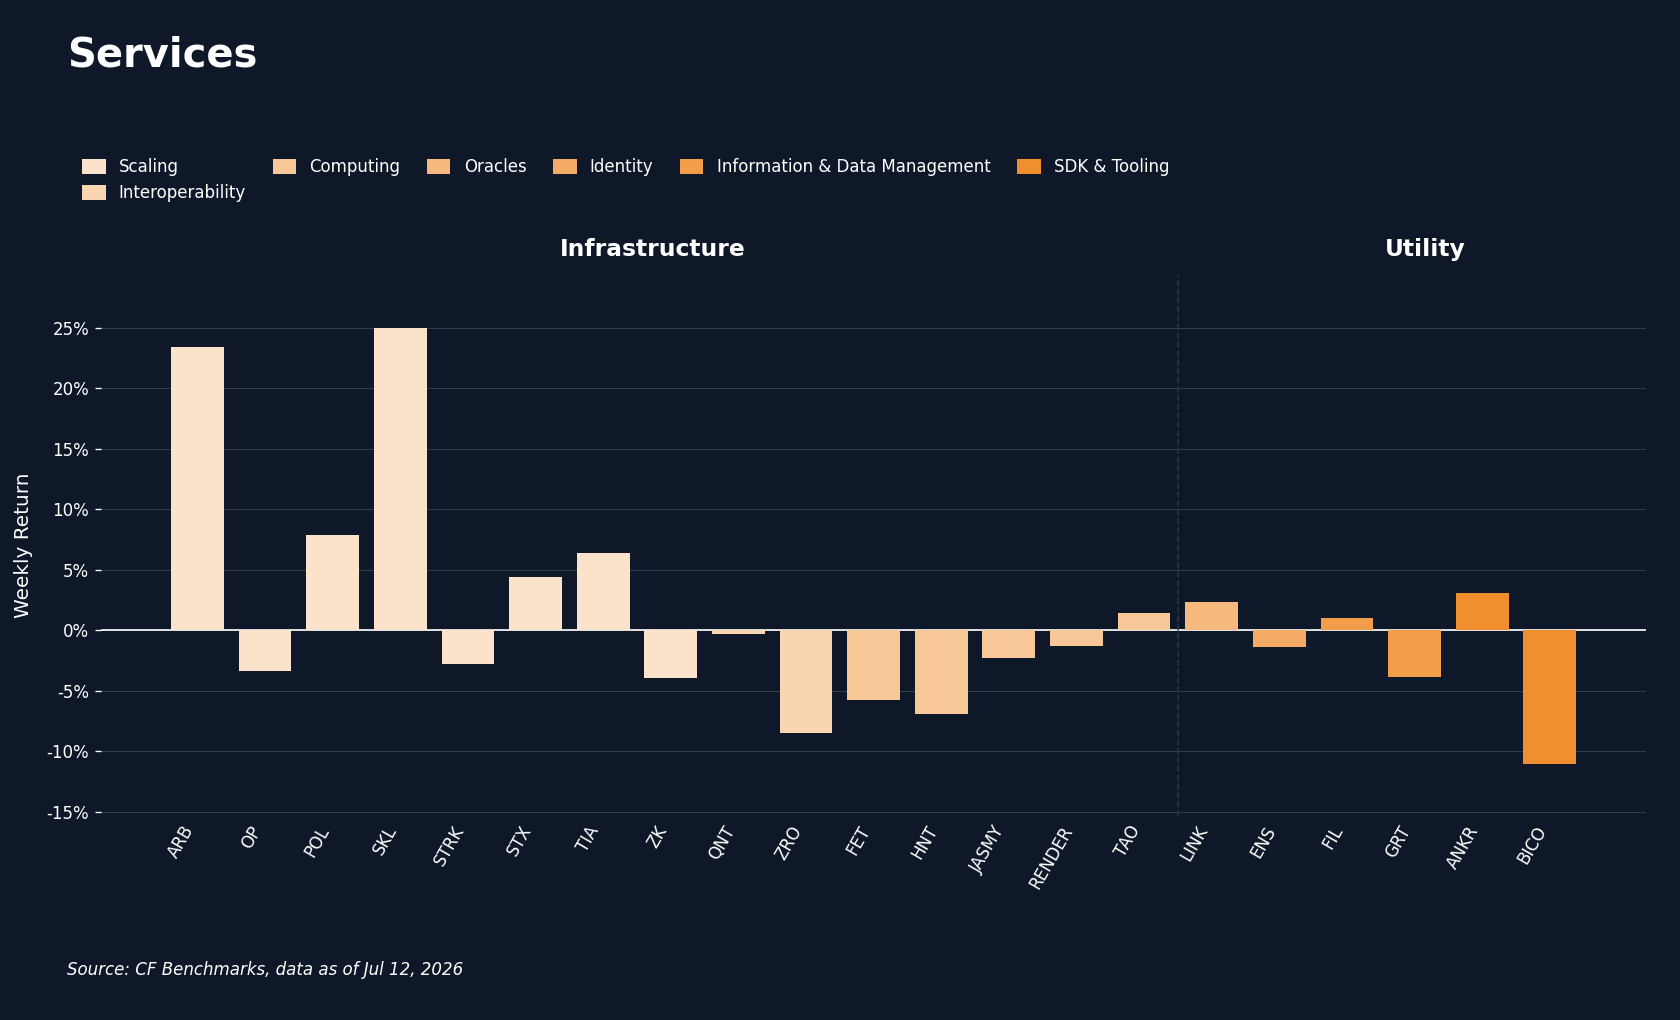
Sector performance across our CF Digital Asset Classification Structure (CF DACS) taxonomy split around a 4.13 pp spread, with Sub-Category averages running from Infrastructure's +2.23% to Culture's -1.91%. Infrastructure's lead was a scaling story. Arbitrum (ARB) rose 23.4% in the week Offchain Labs announced, on July 8th, that 10% of fees from Robinhood Chain and every other Arbitrum Layer-2 will flow back to the Arbitrum ecosystem, 8% to the tokenholder treasury and 2% to development; the announcement gave ARB its first concrete revenue link to the newly launched chain's activity, and the token gained roughly 9.0% in the 24 hours after it. SKALE (SKL) led the group outright at +25.0% with no single in-week catalyst we can source, while Polygon (POL) at +7.9% and Celestia (TIA) at +6.4% rode the same scaling bid, against LayerZero (ZRO) at -8.5% and Helium (HNT) at -6.9%. Culture's lag was equally concrete: on July 6th an attacker who had spent roughly $4.4m accumulating just over 1% of BONK supply passed a malicious treasury-transfer proposal through BonkDAO's token-weighted vote, seven wallets on 2.9% turnout, and drained roughly $20m; Bonk (BONK) fell about 7.0% in the following 24 hours and finished the week at -13.3%, with dogwifhat (WIF) at -12.3% alongside and Pepe (PEPE) at +4.5% showing the damage did not spread to every meme name. Finance averaged +0.60% on a wide internal split, Uniswap (UNI) at +16.0% and Lido (LDO) at +14.8% against Jito (JTO) at -16.2%; SKL and JTO set the week's token-level extremes, a 41.2 pp spread. Non-Programmable was flat at +0.04%, Programmable averaged -1.43% with ADA at the bottom of the block, and Utility averaged -1.64%, held down by Biconomy (BICO) at -11.0%.
CF Staking Series
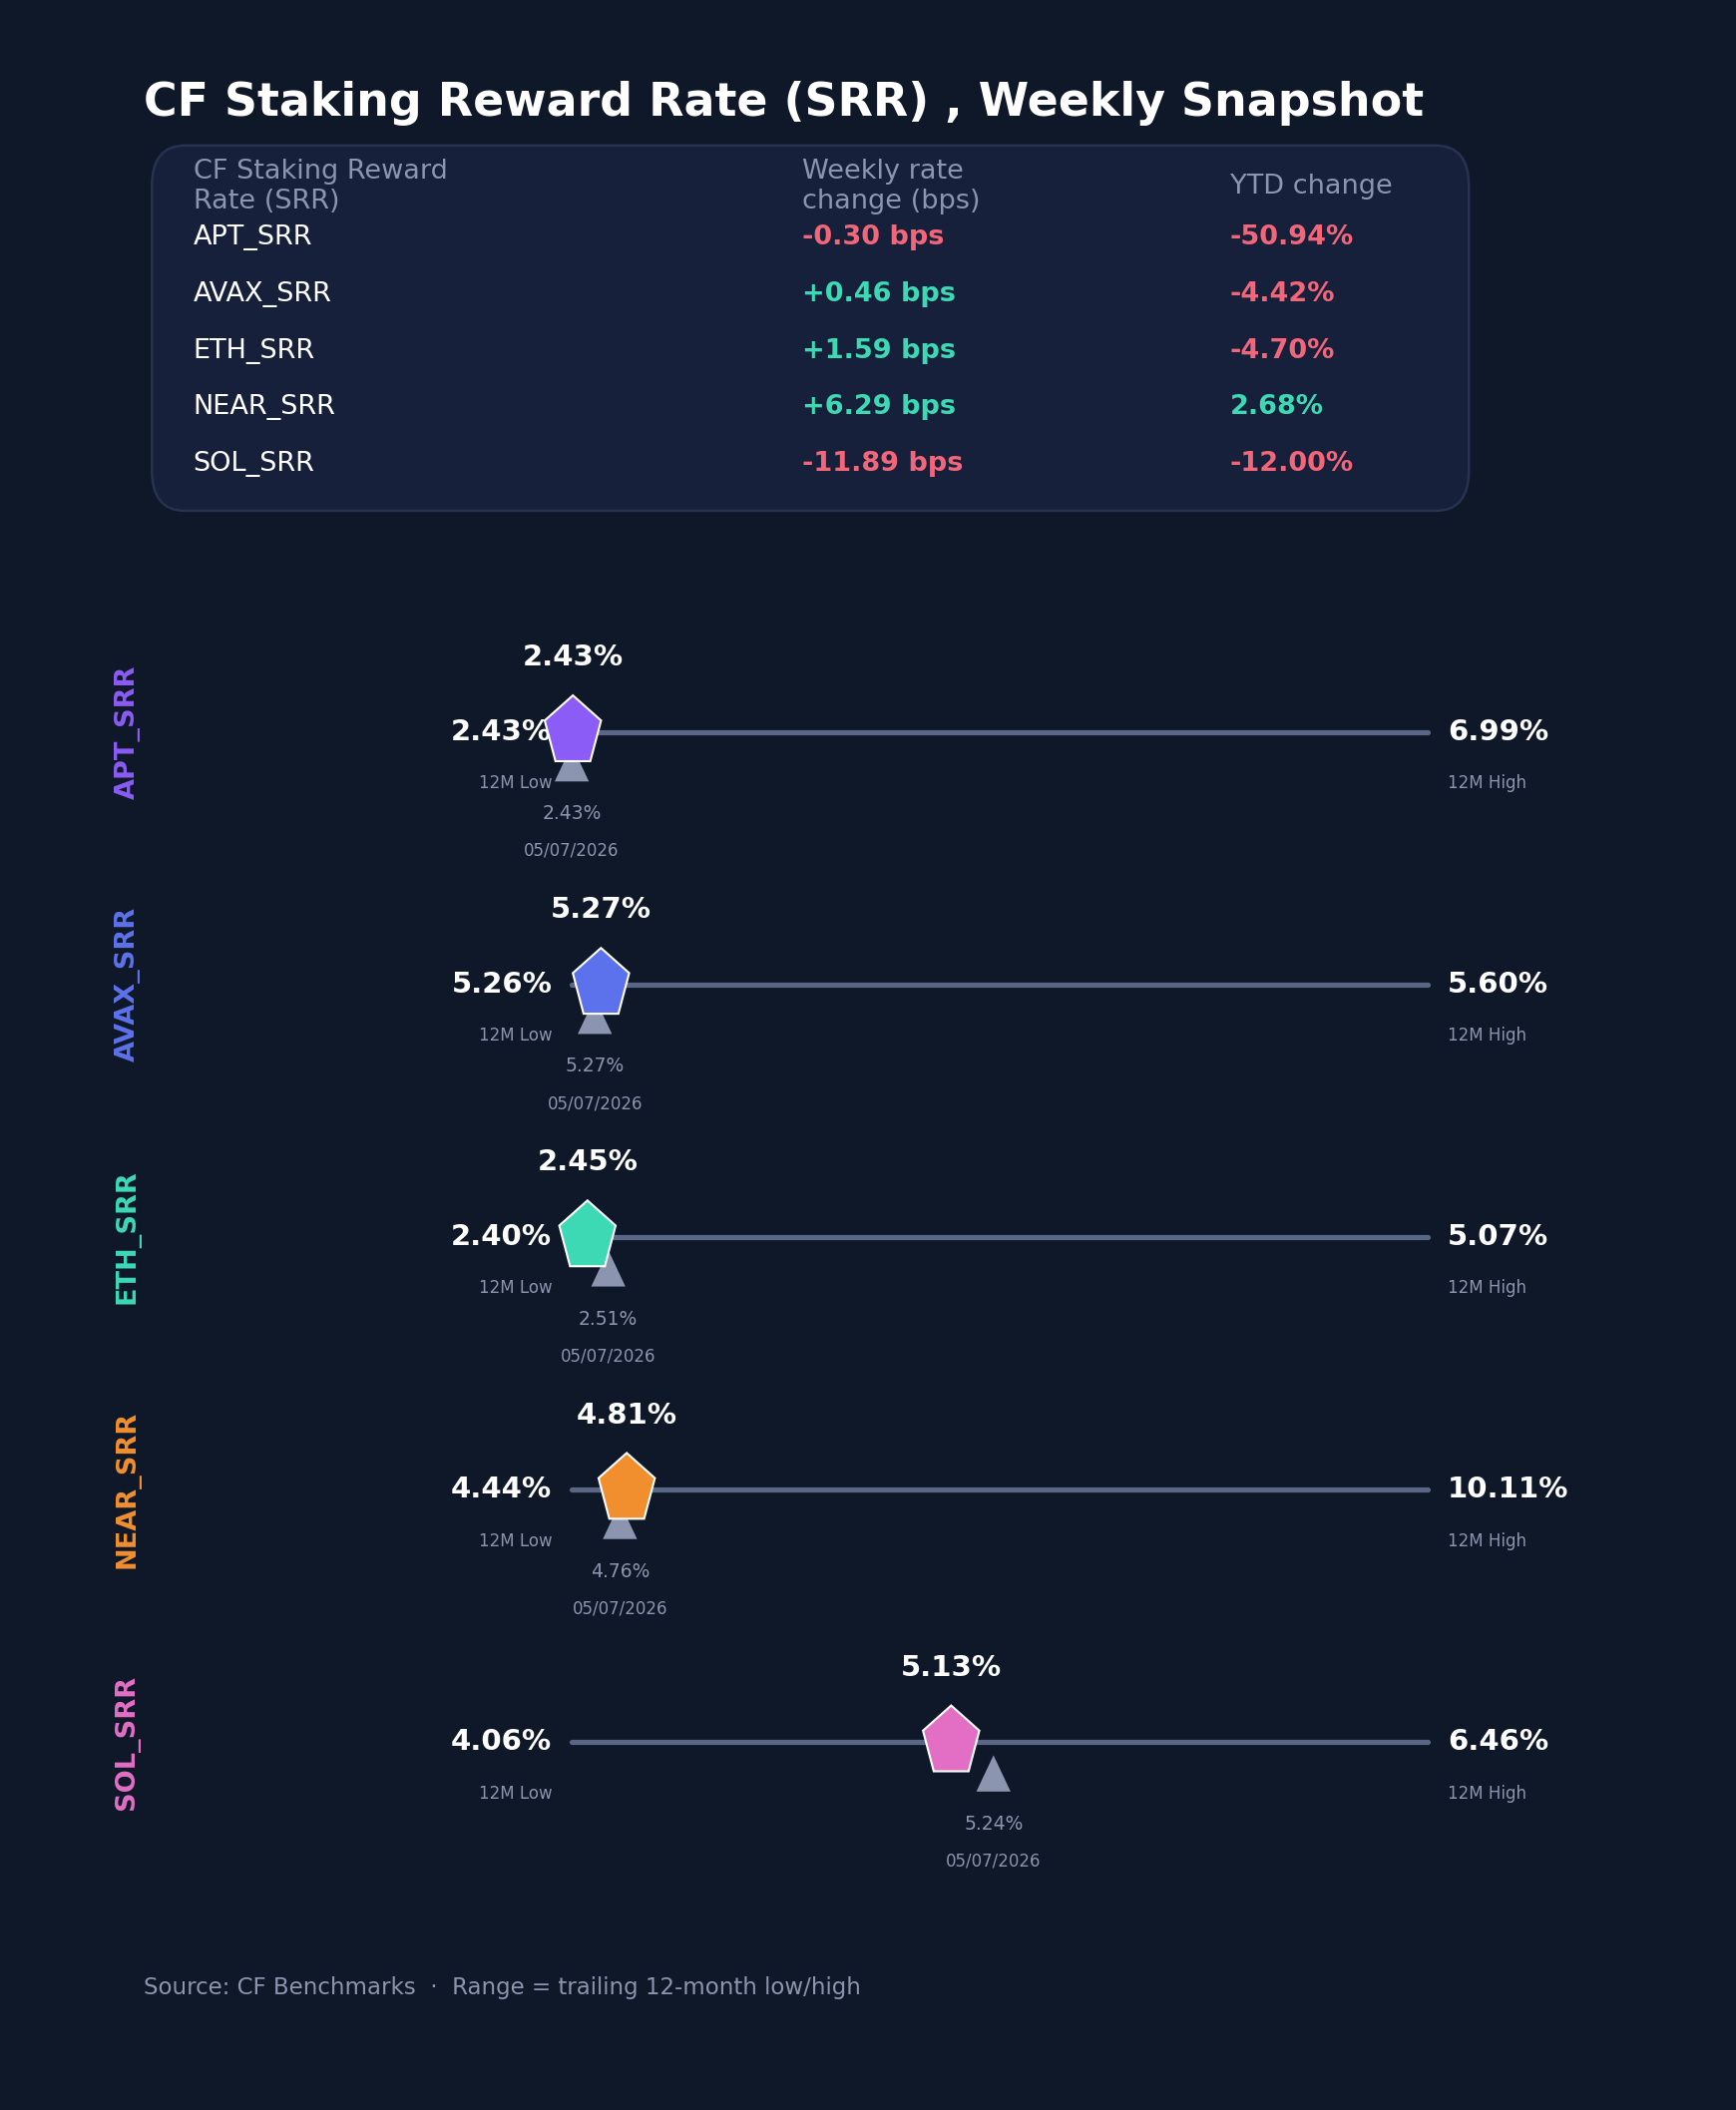
Within the CF Staking Series, weekly relative changes ran from SOL Staking's -2.3% to NEAR Staking's +1.3%. NEAR's reward rate moved from 4.7445% to 4.8074% between July 6th and July 12th, a +6.3 bps change and the largest gain in the set. ETH Staking added 0.7%, its rate moving from 2.4320% to 2.4479%, or +1.6 bps, a level still far nearer its 2.3987% twelve-month low than the 5.0680% high. AVAX Staking was near flat at +0.1%, the rate edging from 5.2642% to 5.2688%, a +0.5 bps move inside its narrow 5.2569% to 5.6045% twelve-month band, and APT Staking slipped 0.1%, from 2.4378% to 2.4348%, a -0.3 bps change that keeps it on its 2.4284% twelve-month floor with the rate 50.9% below its start-of-year level. SOL Staking was the mover, its reward rate falling from 5.2447% to 5.1258%, a -11.9 bps decline and a second consecutive weekly step lower. Reward-rate changes spanned -11.9 bps to +6.3 bps, with current rates running from APT's 2.4348% to AVAX's 5.2688%. Carry stayed orthogonal to the spot tape: the week's only double-digit basis-point move sat in SOL, whose spot index also fell, while the reward rates behind the two spot leaders barely moved.
Interest Rate Analysis
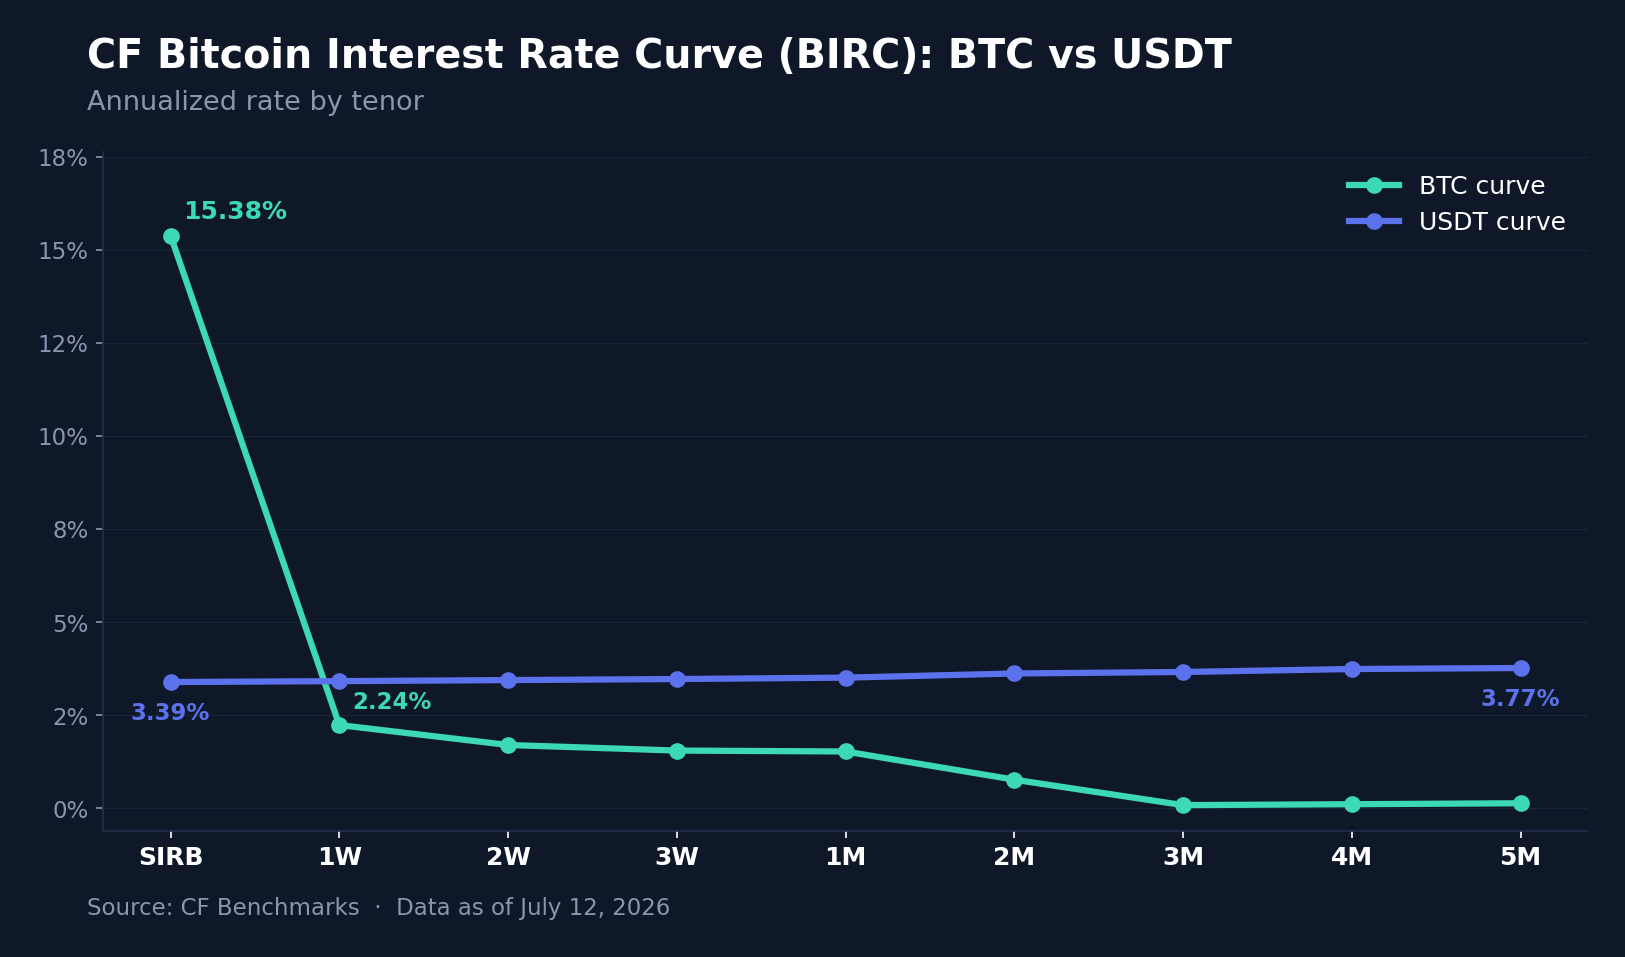
Funding repriced higher across most of the CF Bitcoin Interest Rate Curve (BIRC), and the front end did so violently. The Bitcoin Session Interest Rate (SIRB) jumped from 12.5756% to 15.3803%, a +280.5 bps move that reversed the prior week's easing, while the BTC term curve firmed out to one month: 1W rose 87.0 bps to 2.2388%, 2W 67.1 bps to 1.7038%, 3W 85.6 bps to 1.5542% and 1M 63.8 bps to 1.5296%. The BTC back end went the other way, the 3M tenor easing 11.0 bps to 0.0892%. The USDT curve lifted almost in parallel, SIRB up 52.6 bps to 3.3935%, 1M up 59.9 bps to 3.5121% and 5M up 60.4 bps to 3.7700%, every tenor moving between +52.6 and +63.2 bps; a uniform shift of that shape reads as pass-through from the firmer dollar-rates backdrop the minutes confirmed, not positioning. Across both curves, tenor changes ranged from -11.0 bps to +280.5 bps, and the BTC front end was the idiosyncratic move for a second straight week, this time in the opposite direction. A session rate above 15% against term tenors below 2.3% is the overnight-borrow premium rebuilding just as spot demand returned through the ETF wrappers, a configuration consistent with leverage being added back rather than stress being flushed, though the two are not distinguishable from the curve alone.
Closing Synthesis
Taken together, the week reflected a selective recovery rather than a broad return to risk, with the same pattern visible across each series. Flow returned through the flagship wrappers and lifted the two assets they hold; the free-float capitalization indices outran diversified weighting; DeFi led the themes on named constituent strength; and the catalysts that did land, Arbitrum's fee share and BonkDAO's governance attack, moved exactly the sub-categories they touched and no further. Implied volatility kept compressing as the June hike-risk hedges cheapened, and the rebuilt session-rate premium in BTC funding fits a market adding exposure back deliberately. Our read: demand has returned, but through the most institutional channels available; breadth did not follow it this week.
The information contained within is for educational and informational purposes ONLY. It is not intended nor should it be considered an invitation or inducement to buy or sell any of the underlying instruments cited including but not limited to cryptoassets, financial instruments or any instruments that reference any index provided by CF Benchmarks Ltd. This communication is not intended to persuade or incite you to buy or sell security or securities noted within. Any commentary provided is the opinion of the author and should not be considered a personalised recommendation. Please contact your financial adviser or professional before making an investment decision.
Note: Some of the underlying instruments cited within this material may be restricted to certain customer categories in certain jurisdictions.
Factor Friday - Oct 23, 2026
Size led CF Benchmarks' factor table for a fourth week at 0.75% as the Market fell 1.88% and only 4 of 35 Broad Cap tokens closed higher. Liquidity turned negative at -1.03% as more liquid assets held up better, and Size's year-to-date lead extended to 23.74%.

Mark Pilipczuk
Changes to the Token Market Price Benchmarks Series - Market Prices – 20 October 2026
The Administrator has confirmed changes to the Token Market Price Family for the period 13 October 2026 to 20 October 2026
CF Benchmarks
Altcoins Lag as Bitcoin Tests The 50-Day Moving Average
Digital assets fell broadly over the past week as Bitcoin slipped to a moving average, with inflation prints and an equity sell-off in the background. Losses grew with distance from Bitcoin, hitting diversified and smaller-cap exposure hardest, while implied volatility rose.
Mark Pilipczuk
By clicking Accept, you consent to CF Benchmarks's use of cookies.
Visit Cookie Settings to learn how CF Benchmarks uses cookies and to adjust your preferences.