
Aug 03, 2026
Selective Rotation Drives Wider Sector Dispersion
Weekly Index Highlights, August 3, 2026
Digital assets fell as a bloc this week and dispersed violently underneath it. Every index in the CF Capitalization Series landed inside a 0.60 percentage point (pp) band, from the CF Institutional Digital Asset Index at -2.84% to the CF Large Cap (Diversified Weight) at -3.44%, while the widest token-level spread in the CF DACS constituent set reached 41.3 pp. No macro print carried the tape. The week opened with a real risk-appetite impulse, a pause in US and Iran hostilities that took Brent crude down 11.3% to $85.87 on Monday, its largest one-day fall since April 8th, and the majors declined into it anyway. Our read is that the capital which did move went to two token-specific stories rather than to beta. A market that prices individual tokenomics while ignoring a disinflationary geopolitical impulse is trading idiosyncratic risk rather than the macro cycle.
Market Performance Update
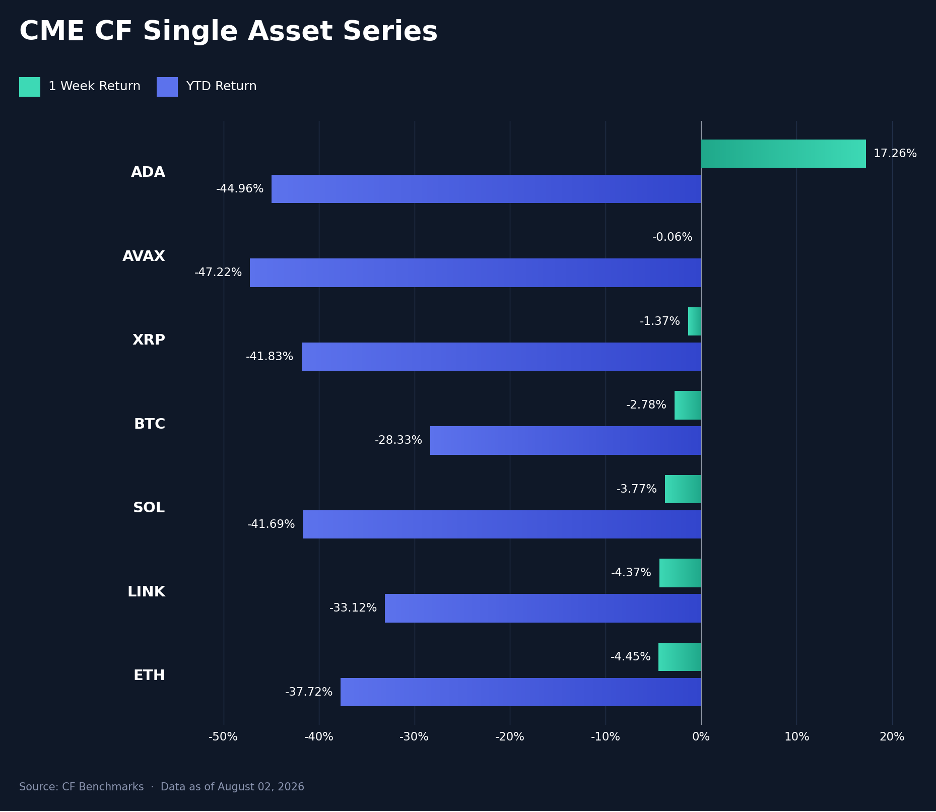
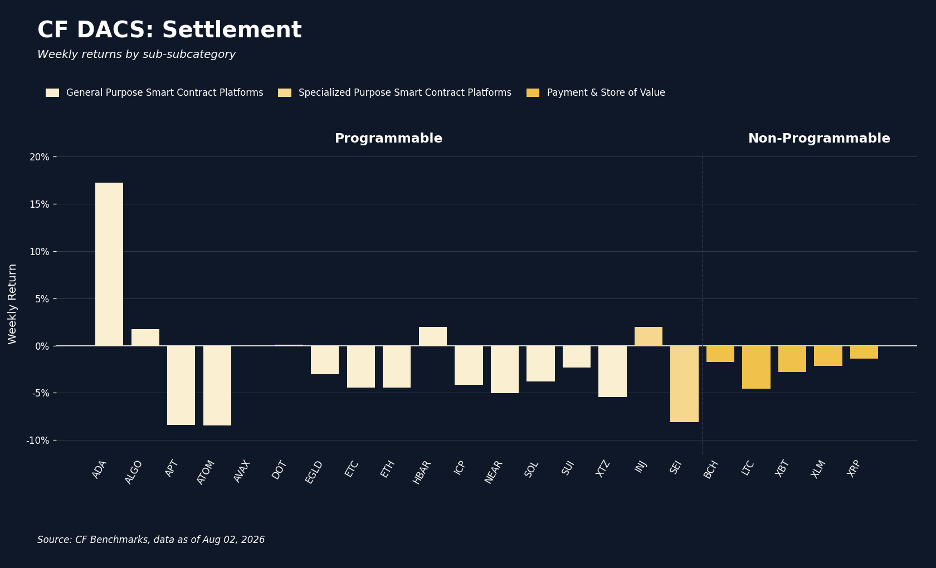
Cardano (ADA) at +17.26% week-on-week (w/w) was the entire upside in the CME CF Single Asset Series. Avalanche (AVAX) at -0.06% was the only other name to hold its level; XRP fell -1.37%, Bitcoin (BTC) -2.78%, Solana (SOL) -3.77%, Chainlink (LINK) -4.37% and Ether (ETH) -4.45%. Strip ADA out and the seven-name range collapses to 4.39 pp against the 21.7 pp spread it creates, and compares with 3.71 pp a week earlier when six of the seven closed higher. ADA's move ran into its August 9th spot-ETF eligibility date, the point at which CME ADA futures complete the six-month regulated-trading seasoning that opens the streamlined listing path, so the bid was for a procedural threshold rather than for any change in the network. Wednesday's Federal Open Market Committee hold at 3.50% to 3.75% carried three dissents in favor of a hike, the first unified three-dissent meeting since September 2016, and BTC absorbed it inside the session with a roughly 1.0% dip to $63,890 on the announcement and a recovery above $64,400 by the close. What stuck was flow, not rates: spot Bitcoin ETFs shed $265.4m on Friday alone and $61.53m across the week, ending three consecutive weeks of creations, and the majors made their lows in those late-week sessions. Year-to-date (YTD), BTC's -28.3% is still the shallowest drawdown in the set against AVAX's -47.2%, and a 17-point week leaves ADA at -45.0%, which measures how deep the hole is that single-name rallies are digging out of.
Volatility Analysis
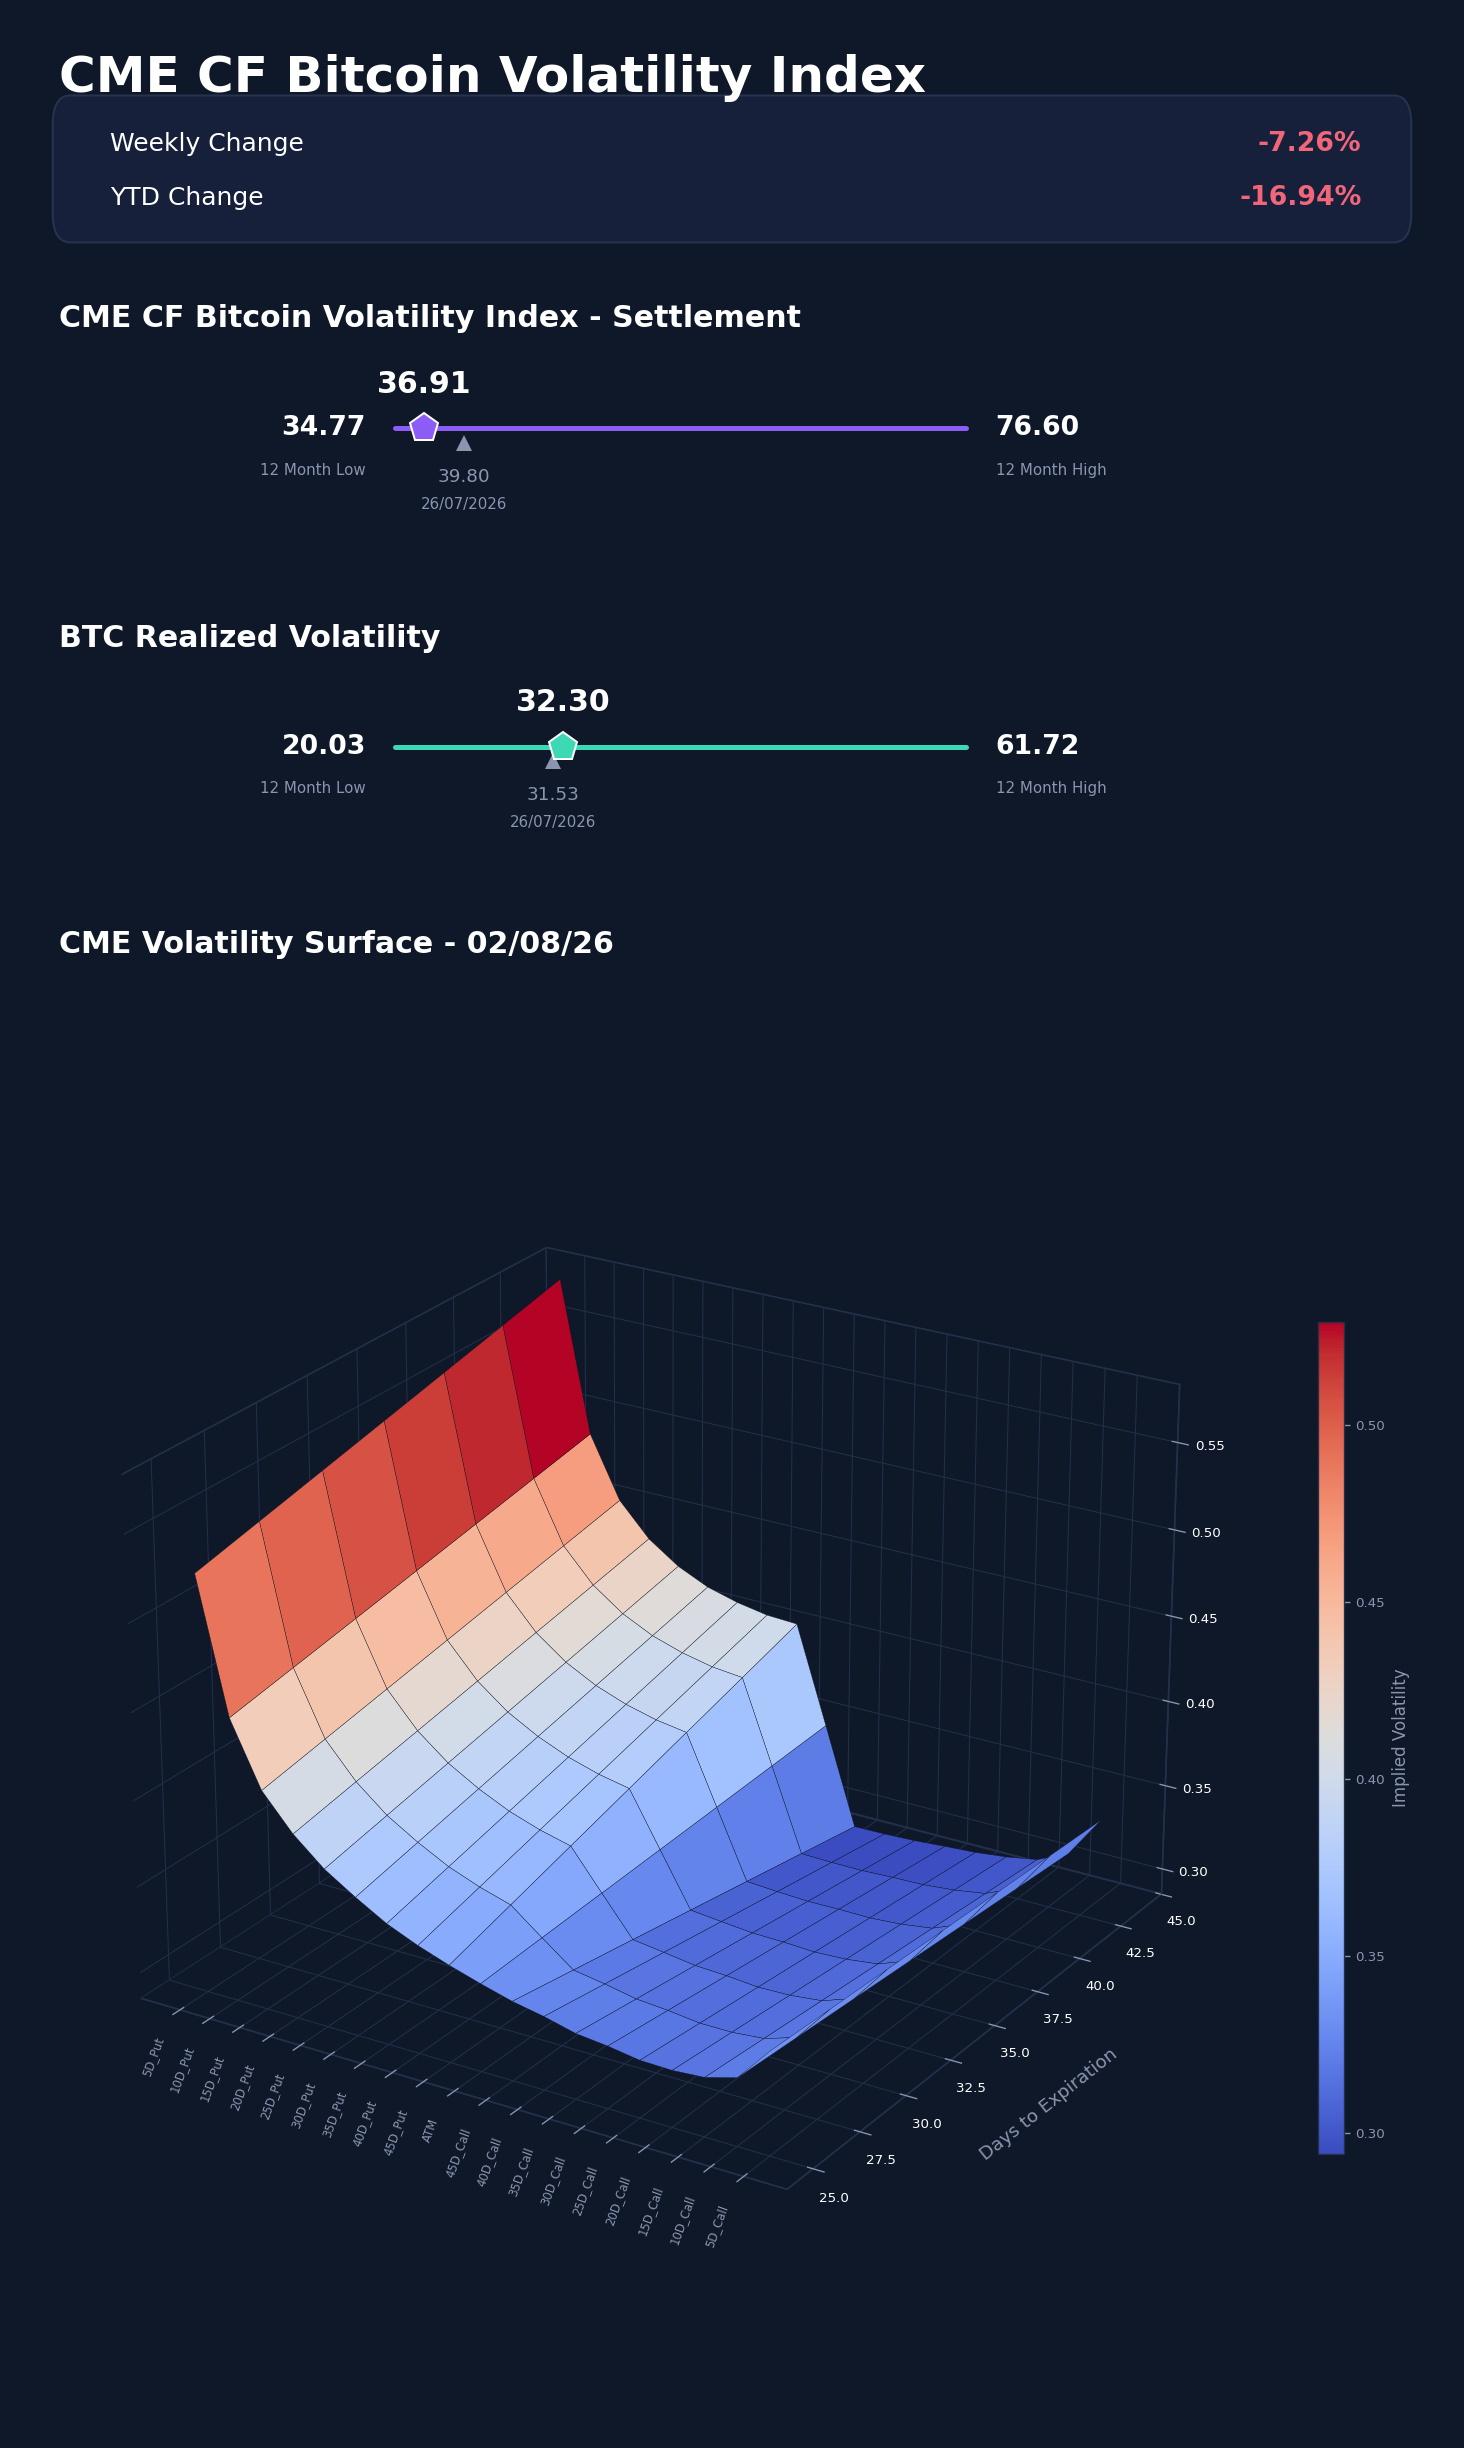
Implied volatility compressed toward realized rather than away from it. The CME CF Bitcoin Volatility Index Settlement (BVXS) closed at 36.91, down 2.89 vol. points from 39.80 a week earlier, a -7.26% move that leaves it 2.14 vol. points above its trailing 12-month low of 34.77 and -16.94% below the 44.44 start-of-year reference. Thirty-day realized volatility went the other way, rising 0.77 vol. points to 32.30 after peaking at 34.36 on Friday, and sits 12.26 points above its own 12-month low of 20.03. That took the implied-realized spread from 8.27 to 4.61 vol. points, so the cushion between what options charge and what spot is actually delivering roughly halved in a week: the market stopped paying for protection it had held through the Middle East escalation while spot volatility kept grinding higher. The surface puts a finer point on which strikes were let go. Across matched 25-day to 31-day tenors the whole smile came down 3.9 to 4.6 vol. points, and the give-up was concentrated on the upside: the 5-delta call wing lost 4.6 to 5.2 points relative to at-the-money while the 25-delta put skew steepened 0.7 to 1.6 points, taking the 25-delta call from roughly flat to 3.0 points below at-the-money at the one-month point. The one-month at-the-money term structure also flipped, from inverted a week ago (37.38 at 26 days falling to 36.74 at 32 days) to upward sloping now (33.56 at 25 days rising to 33.97 at 31 days), which is the front-end event premium from the conflict unwinding rather than a fresh view on the medium term.
Market Cap Index Performance
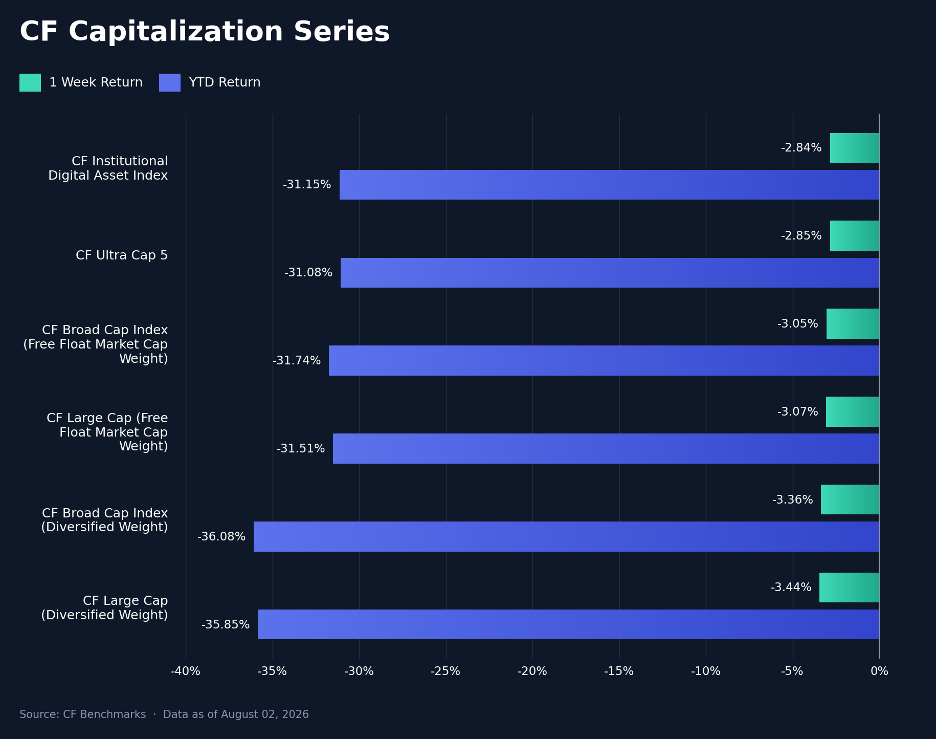
The six CF Capitalization Series indices moved as a single instrument. The CF Institutional Digital Asset Index at -2.84% and the CF Ultra Cap 5 at -2.85% held up best, the free-float pair followed with the CF Broad Cap Index (Free Float Market Cap Weight) at -3.05% and the CF Large Cap (Free Float Market Cap Weight) at -3.07%, and the diversified versions brought up the rear at -3.36% and -3.44%. The 0.60 pp range is a fraction of the 21.7 pp spread the single-asset series threw up, and the diversified-versus-free-float gap at the Broad Cap level widened only to -0.32 pp from -0.12 pp the week before. Breadth therefore deteriorated only at the margin: equal-weighting the tail cost roughly a third of a point, which is what a modest de-rating of everything below the megacaps looks like when no sector is being singled out. A hawkish hold and a 0.3 pp growth miss on Thursday's advance Q2 gross domestic product print of 1.5% produce exactly this configuration, a uniform repricing of the discount rate with no macro reason for one weight scheme to separate from another. The dispersion the week did generate sat below the index level entirely, which is why every capitalization index understates how eventful it was.
Factors Analysis
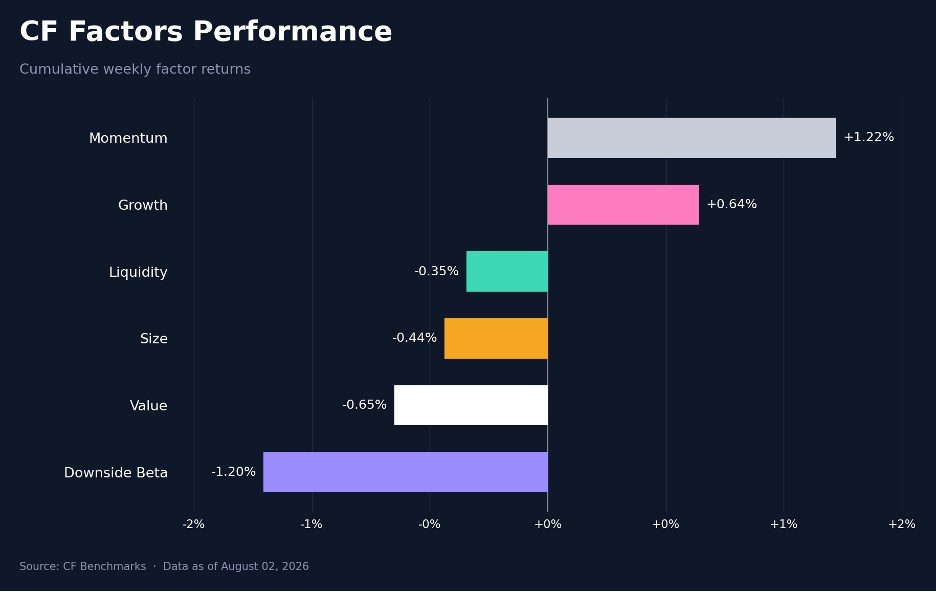
Defensive positioning failed to defend. Momentum led the six CF factors at +1.2% cumulative for the week and Growth held +0.6%, but the other four turned over: Liquidity -0.3%, Size -0.4%, Value -0.7% and Downside Beta -1.2%. Two of six finished positive against five of six a week earlier, and the range narrowed marginally to 2.43 pp from 2.67 pp, so the rotation happened in the level of returns rather than in their spread. Downside Beta drove it, swinging 2.36 pp from +1.15% to -1.20% and taking the week's largest reversal; in a falling tape the low-beta cohort is supposed to earn its keep, and it instead underperformed the very names it hedges, which is what happens when the selling is indiscriminate rather than beta-targeted. Liquidity at -1.22 pp and Size at -1.18 pp reversed almost as hard, both from positive prior weeks, so the liquid megacap tilt that worked into late July stopped working. Value was the only improvement, up 0.50 pp to -0.65% from -1.15%, and Momentum's persistence through a down week is the one factor signal here that survived contact with the ADA and UNI outliers.
Read our latest weekly crypto factors report: Factor Friday - July 31, 2026
Classification Series Analysis
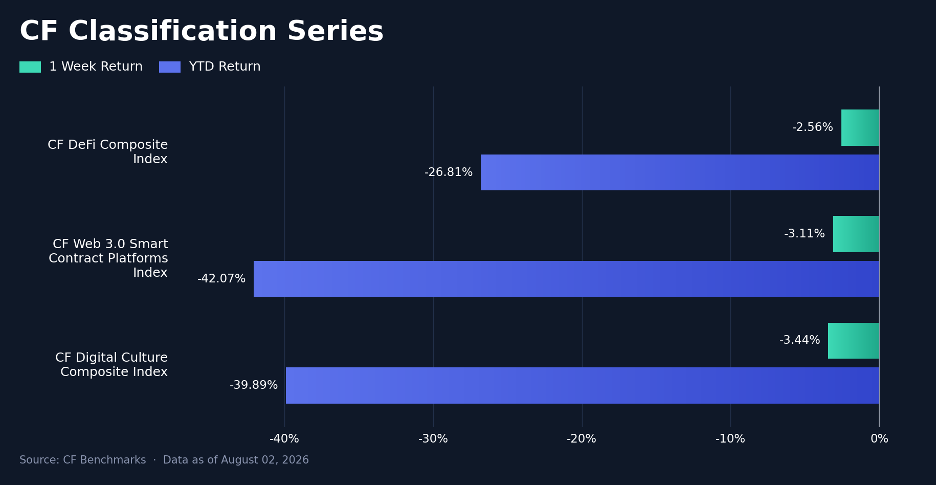
The three CF Classification Series composites finished within 0.88 pp of each other, the tightest cross-section in the report. The CF DeFi Composite Index led at -2.56%, the CF Web 3.0 Smart Contract Platforms Index followed at -3.11% and the CF Digital Culture Composite Index lagged at -3.44%. DeFi held the top spot after a +2.75% prior week when the other two were already falling, and it did so with Uniswap's fee-switch strength offsetting a punishing week in liquid staking. Digital Culture has now lagged for two consecutive weeks, from -1.86% into -3.44%. The YTD ordering has barely moved all summer: DeFi at -26.8% against Web 3.0 Smart Contract Platforms at -42.1% and Digital Culture at -39.9% is a 15.3 pp gap between the best and worst composite, and a week of sub-point separation does nothing to close it.
Sector Analysis
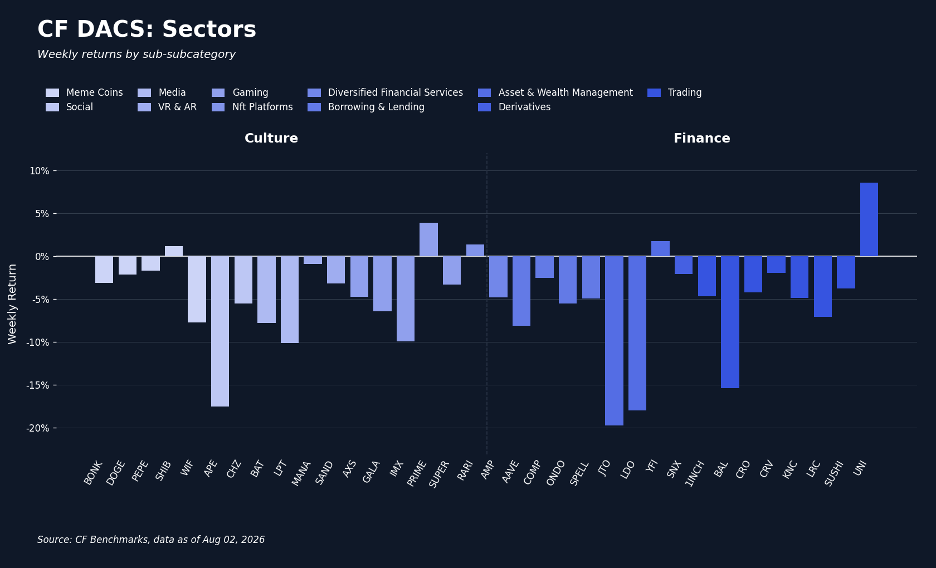
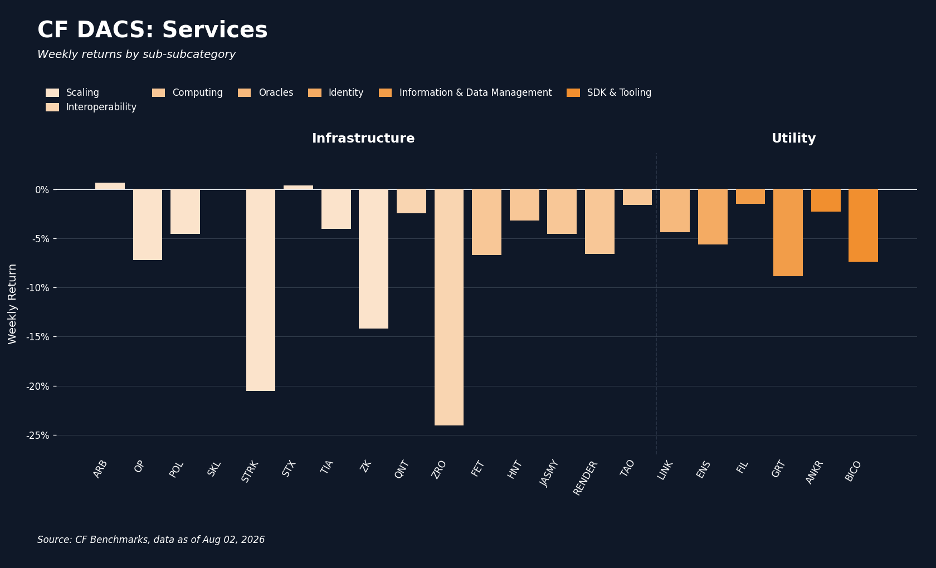
Only 12 of the 77 CF DACS constituents closed higher, and the sub-category averages compressed into a 4.55 pp band while individual tokens flew apart. Programmable held up best at -2.03%, then Non-Programmable at -2.51%, Culture at -4.55%, Utility at -5.01%, Finance at -5.70% and Infrastructure at -6.58%. Finance made the sharpest turn, from the best sub-category at +2.66% a week earlier to second from last, and its average is the week's most misleading number: Uniswap (UNI) at +8.61% was its strongest constituent by a wide margin after governance activated the v4 protocol fee switch, which routes roughly one-sixth of swap fees into buy-and-burn and took daily protocol revenue to about $325,000 from a run rate near $114,000, giving the token a mechanical claim on throughput it did not have the week before. At the other end of the same sub-category, Jito (JTO) fell -19.69%, Lido (LDO) -17.95% and Balancer (BAL) -15.38%, a 28.30 pp internal spread that we read as a repricing of protocols that now return cash to tokenholders against those that do not, with the liquid-staking names carrying the additional weight of falling reward rates. Infrastructure's last place was broader and harder to attribute: LayerZero (ZRO) at -24.02%, Starknet (STRK) at -20.55% and zkSync (ZK) at -14.19% set the week's downside tail, and no in-week supply or protocol event explains them, so we treat the block as long-tail de-risking rather than catalyst-driven. ADA's Programmable strength against ZRO's Infrastructure weakness is the 41.3 pp token-level spread that defines the week. The Coldcard hardware-wallet exploit, roughly 1,368 BTC drained from more than 4,500 addresses from Friday, is the week's largest security event and left no separable mark on Non-Programmable, where the five constituents ranged only 3.17 pp; the small-holder deposits it pushed onto exchanges were a custody response, not a repricing of Bitcoin.
CF Staking Series
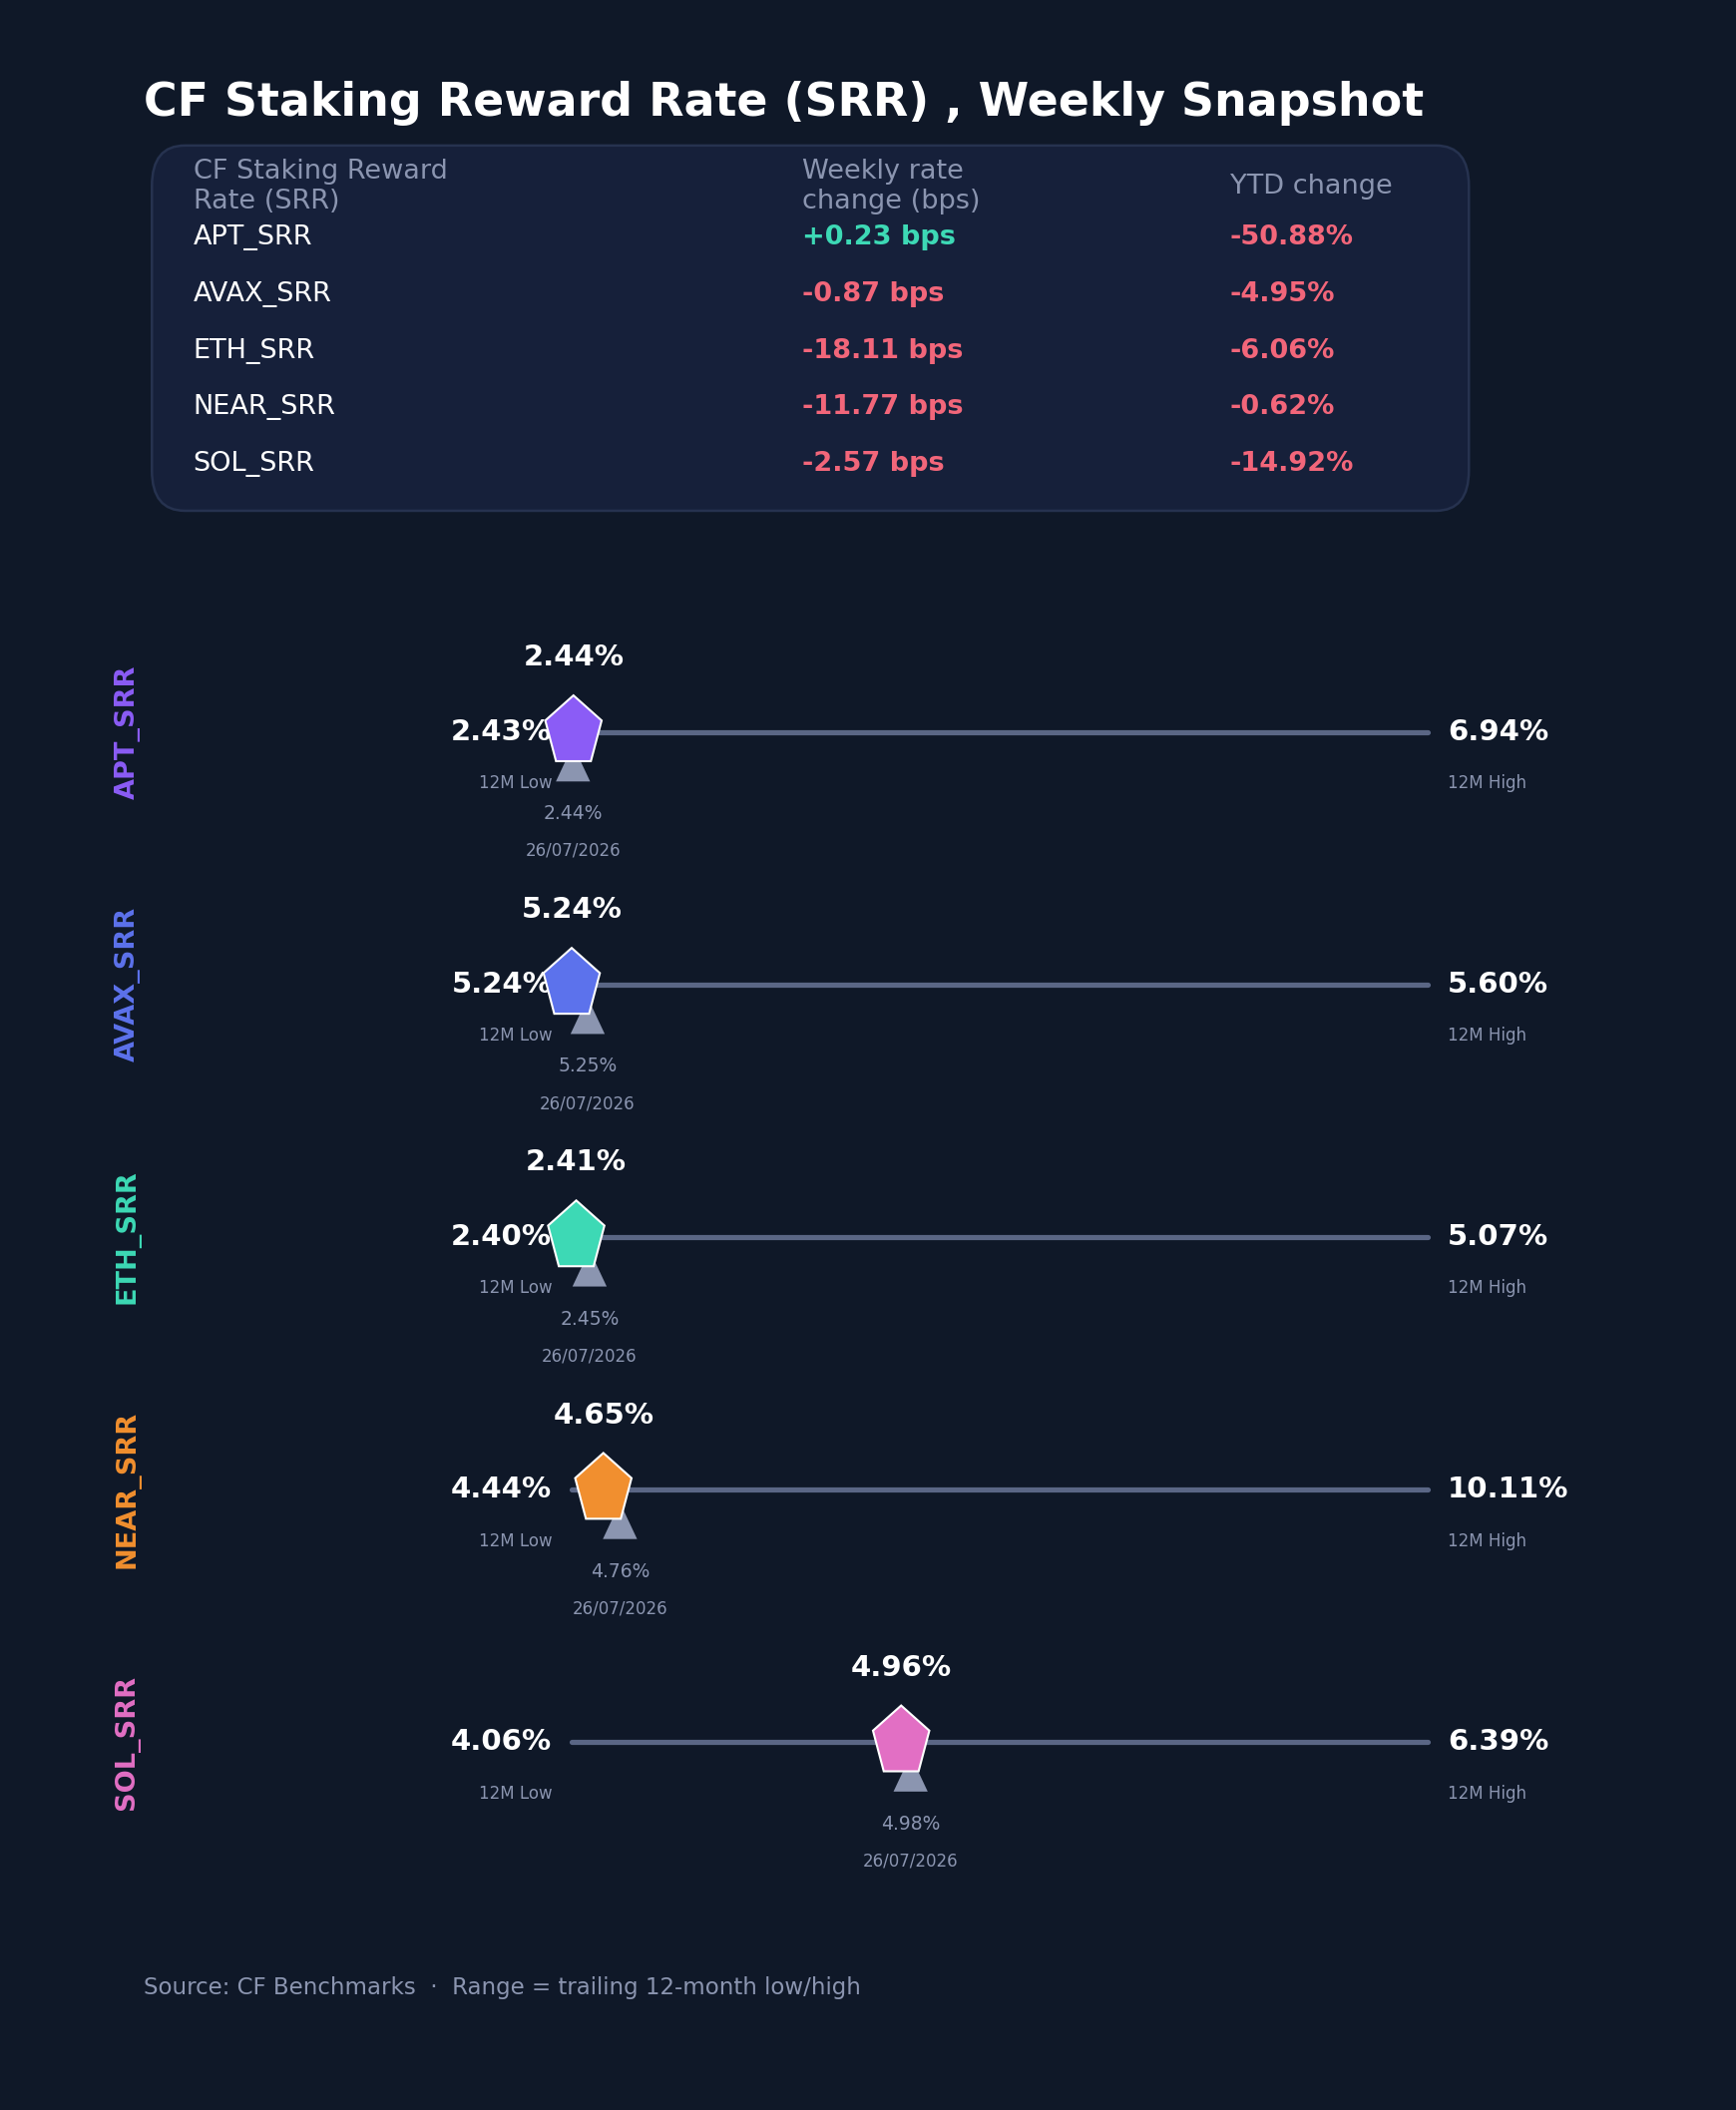
Reward rates fell across four of the five CF Staking Series networks and the relative index returns tracked them closely. Aptos (APT) was the only one to rise, up 0.23 bps to 2.4377% for a +0.09% relative index return. Avalanche (AVAX) slipped 0.87 bps to 5.2397% and Solana (SOL) 2.57 bps to 4.9558%, worth -0.17% and -0.52% respectively. NEAR fell 11.77 bps to 4.6527% for -2.47%. Ether (ETH) took the largest cut, 18.11 bps to 2.4129% from 2.4545%, and a -6.98% relative index return that was the weakest reading in the series by a factor of nearly three. Two of the five now sit effectively on their trailing 12-month lows, AVAX exactly at 5.2397% and ETH 1.4 bps above 2.3987%, so the compression is not a one-week event but the end of a long grind. The cross-sectional reward-rate range is 282.7 bps, from ETH's 2.4129% to AVAX's 5.2397%, and with ETH spot down -4.45% on the week the staking yield offered no offset: falling issuance-driven rewards and falling prices arrived together, which removes the carry argument that supported ETH staking exposure through the first half.
Interest Rate Analysis
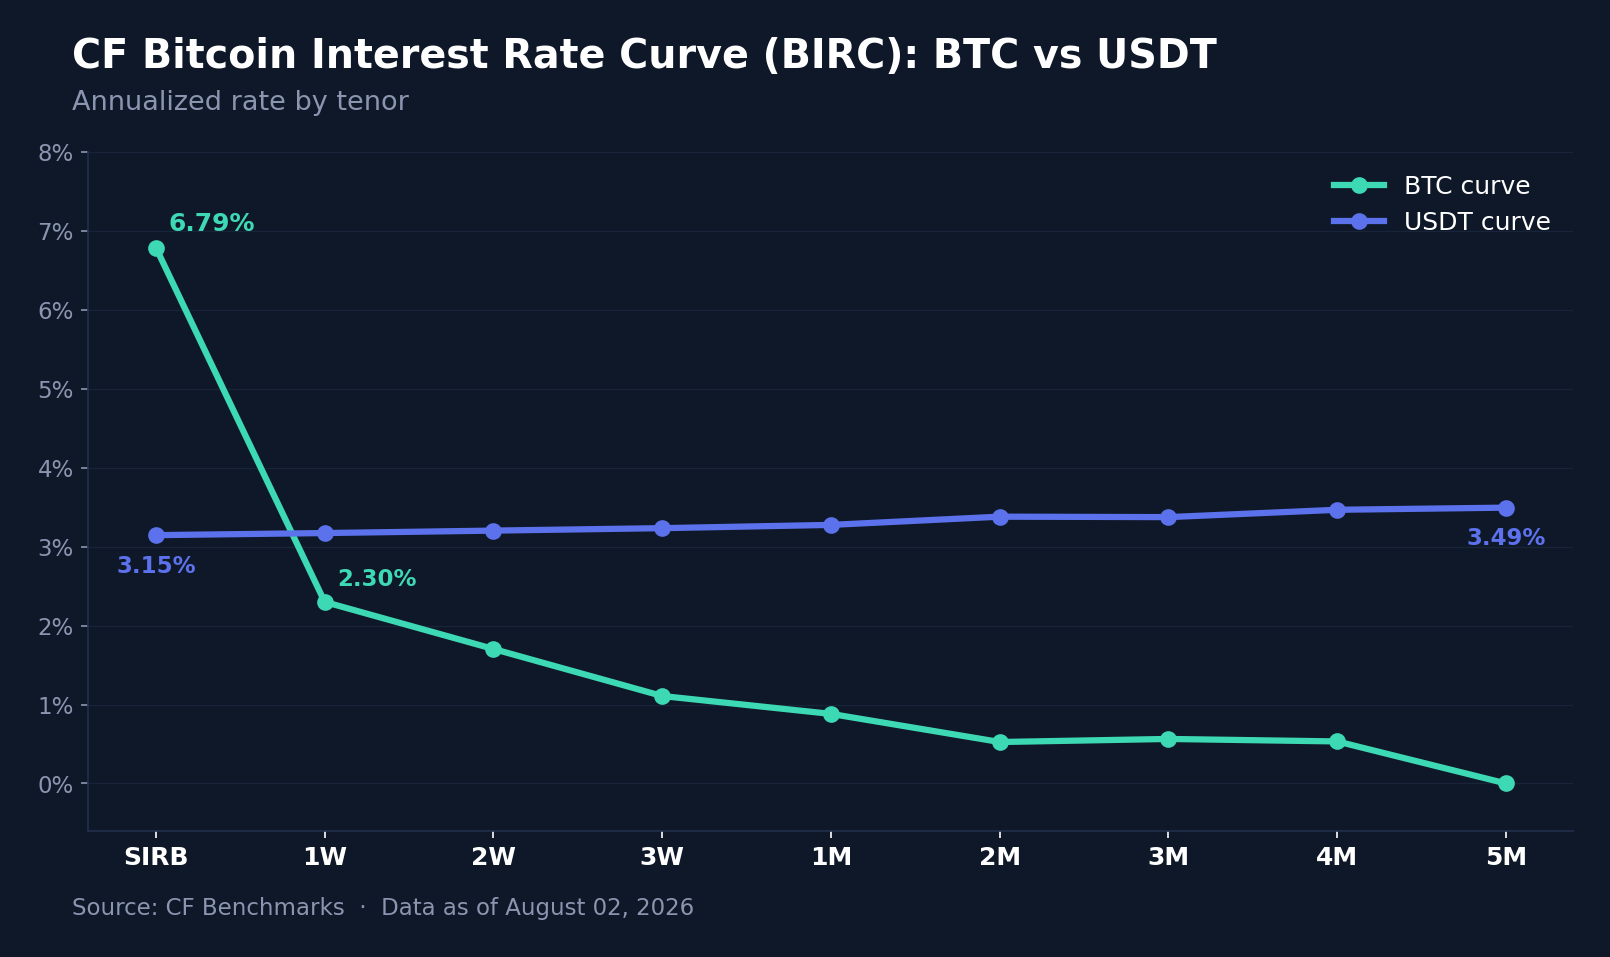
The CF Bitcoin Interest Rate Curve (BIRC) is where the week's positioning unwind shows up directly. The BTC session rate (SIRB) collapsed 373.2 bps to 6.7875% from 10.5200%, and the 1-week point moved the other way, up 153.0 bps to 2.2997% from 0.7694%. Between those two points the BTC curve barely moved: 2W +22.7 bps to 1.7037%, 3W -21.9 bps to 1.1078%, 1M -24.5 bps to 0.8813% and 3M +14.3 bps to 0.5639%. The back end went the whole way: the 5-month printed 0.0000%, down 28.2 bps from 0.2821%, so a curve still paying 0.5323% at 4 months now offers no term yield at its longest tenor. That leaves the BTC curve steeply inverted, with the session rate 622.4 bps above the 3-month, though far less so than a week ago, and the shape says overnight borrowing demand normalized while the cost of one-week term borrowing repriced up to meet it. Lending bitcoin for five months now earns nothing, which carries the same message the front end sends from the other side: the bid is to borrow immediately against collateral, and there is no bid for term. The USDT curve was the idiosyncratic one for the opposite reason, it did nothing: every tenor fell between 5.1 and 11.3 bps, a mean of 7.8 bps, holding an upward slope from 3.1460% at the session rate to 3.4946% at 5 months. Dollar funding is 239.5 bps above BTC funding at the 1-month point and 281.1 bps at 3 months, and the fact that stablecoin term rates drifted uniformly lower while BTC's front end convulsed places this episode in crypto collateral rather than in the price of dollars. Across both curves tenor changes ran from -373.2 bps to +153.0 bps, and all of that range belongs to the BTC front end.
Closing Synthesis
A 0.60 pp range across the CF Capitalization Series and a 41.3 pp range across the CF DACS constituents describe the same week, and the gap between those two numbers is the point. Index-level risk was repriced uniformly and modestly; token-level risk was repriced sharply and specifically, on fee switches, eligibility dates and supply overhangs rather than on the rates picture that a hawkish hold and a growth miss handed the market. The supporting evidence lines up: defensive factors underperformed in a falling tape, implied volatility gave up its event premium while realized volatility rose, and the funding dislocation was confined to BTC's front end while dollar term rates drifted. For an index construction with a long tail, this is the regime where weight scheme matters least and constituent selection matters most.
The information contained within is for educational and informational purposes ONLY. It is not intended nor should it be considered an invitation or inducement to buy or sell any of the underlying instruments cited including but not limited to cryptoassets, financial instruments or any instruments that reference any index provided by CF Benchmarks Ltd. This communication is not intended to persuade or incite you to buy or sell security or securities noted within. Any commentary provided is the opinion of the author and should not be considered a personalised recommendation. Please contact your financial adviser or professional before making an investment decision.
Note: Some of the underlying instruments cited within this material may be restricted to certain customer categories in certain jurisdictions.
Small Cap Tokens Outperform in September
The CF Free-Float Broad Cap Index rose 10.28% in September as Bitcoin supplied 59% of the gain while trailing the index. Returns across the Capitalization Series ran from +7.74% for Ultra Cap 5 to +14.01% for Emerging Crypto, which holds no Bitcoin, as altcoins outpaced Bitcoin.

Mark Pilipczuk
CF Digital Asset Index Family Multi Asset Series – Extraordinary Rebalance Announcement
CF Digital Asset Index Family Multi Asset Series - Extraordinary Rebalance Announcement
CF Benchmarks
Changes to the Token Market Price Benchmarks Series - Market Prices – 06 October 2026
The Administrator has confirmed changes to the Token Market Price Family for the period 29 September 2026 to 06 October 2026
CF Benchmarks
By clicking Accept, you consent to CF Benchmarks's use of cookies.
Visit Cookie Settings to learn how CF Benchmarks uses cookies and to adjust your preferences.