
Aug 24, 2026
Bessent's Buyback Revives the Debasement Thesis
Weekly Index Highlights, August 24, 2026
Last week's move was a revival of the debasement trade dynamics. Treasury Secretary Scott Bessent's announcement that each long-end Treasury buyback would rise from 2bn dollars to at least 4bn, with scope for further purchases, coincided with a softer dollar and an advance that became broad across the CF Single Asset, Capitalization and Classification series. The move did not trade as ordinary rates relief: the 10-year Treasury yield still tested a 20-month high and hawkish Federal Open Market Committee (FOMC) minutes were absorbed. The White House meeting on the Digital Asset Market Clarity Act belongs in the story as a secondary, industry-specific catalyst, with more relevance to regulatory-sensitive DeFi and Hyperliquid trading than to the uniform index advance. BVXS rose 19.04% against a 77.82% jump in realized volatility, leaving the settlement index behind a market repricing fiscal and dollar risk.
Market Performance Update
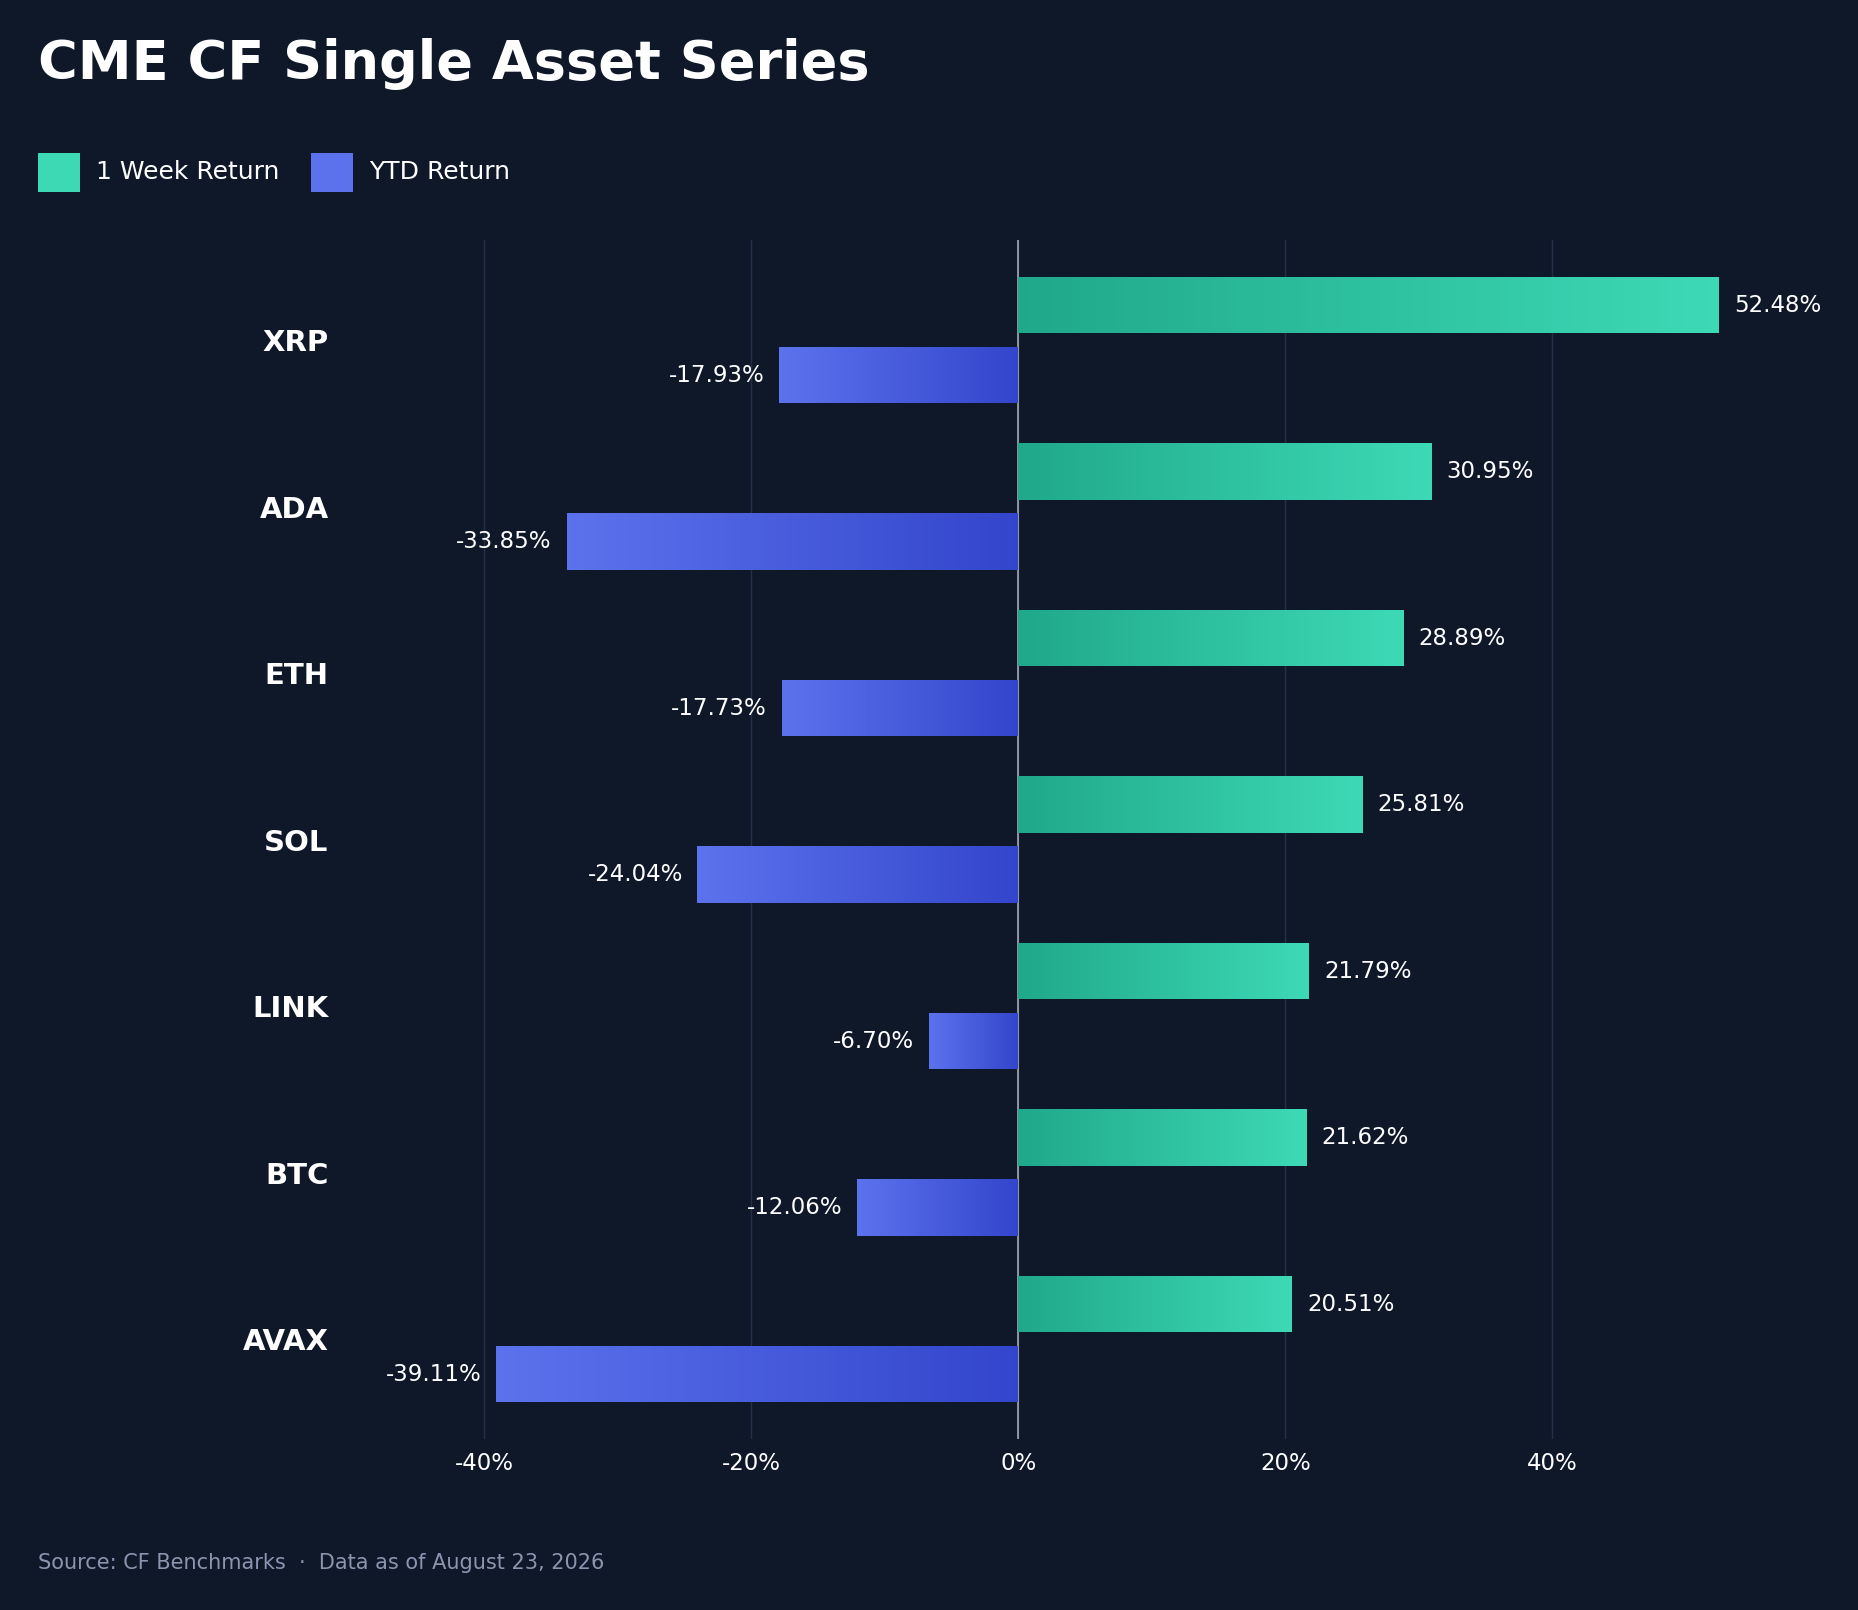
Every CF Single Asset name closed the week higher, reversing a board with six of seven decliners a week earlier. XRP led at 52.48% week-on-week (w/w), followed by Cardano (ADA) at 30.95%, Ether (ETH) at 28.89%, Solana (SOL) at 25.81%, Chainlink (LINK) at 21.79%, Bitcoin (BTC) at 21.62% and Avalanche (AVAX) at 20.51%, a 31.97 percentage point (pp) range. The broad phase of the rally followed Thursday's Treasury announcement, which doubled the long-end buyback size to at least 4bn dollars per operation and opened the prospect of further purchases. The dollar softened by roughly 1% on the week even as the 10-year yield tested cycle highs, a configuration more consistent with a debasement trade than a conventional rates-relief move. Spot Bitcoin and Ether ETFs then took in a combined 2.6bn dollars, the strongest week since October 2025, providing a flow channel for the broad advance. The White House Clarity Act meeting helped set the regulatory backdrop and is most relevant to policy-sensitive names, including DeFi and Hyperliquid, as well as XRP's 52.48% outperformance. It is not the clearest explanation for every single asset and index rising together. Wednesday's hawkish FOMC minutes and Thursday's modest jobless-claims beat were both absorbed without denting the advance. YTD, LINK remains the strongest of the seven at -6.70% and BTC next at -12.06%, against -39.11% for AVAX and -33.85% for ADA. The ordering reads as a fiscal and dollar impulse amplified by ETF demand and short covering, with the regulatory meeting a secondary source of dispersion rather than the market-wide driver.
Volatility Analysis
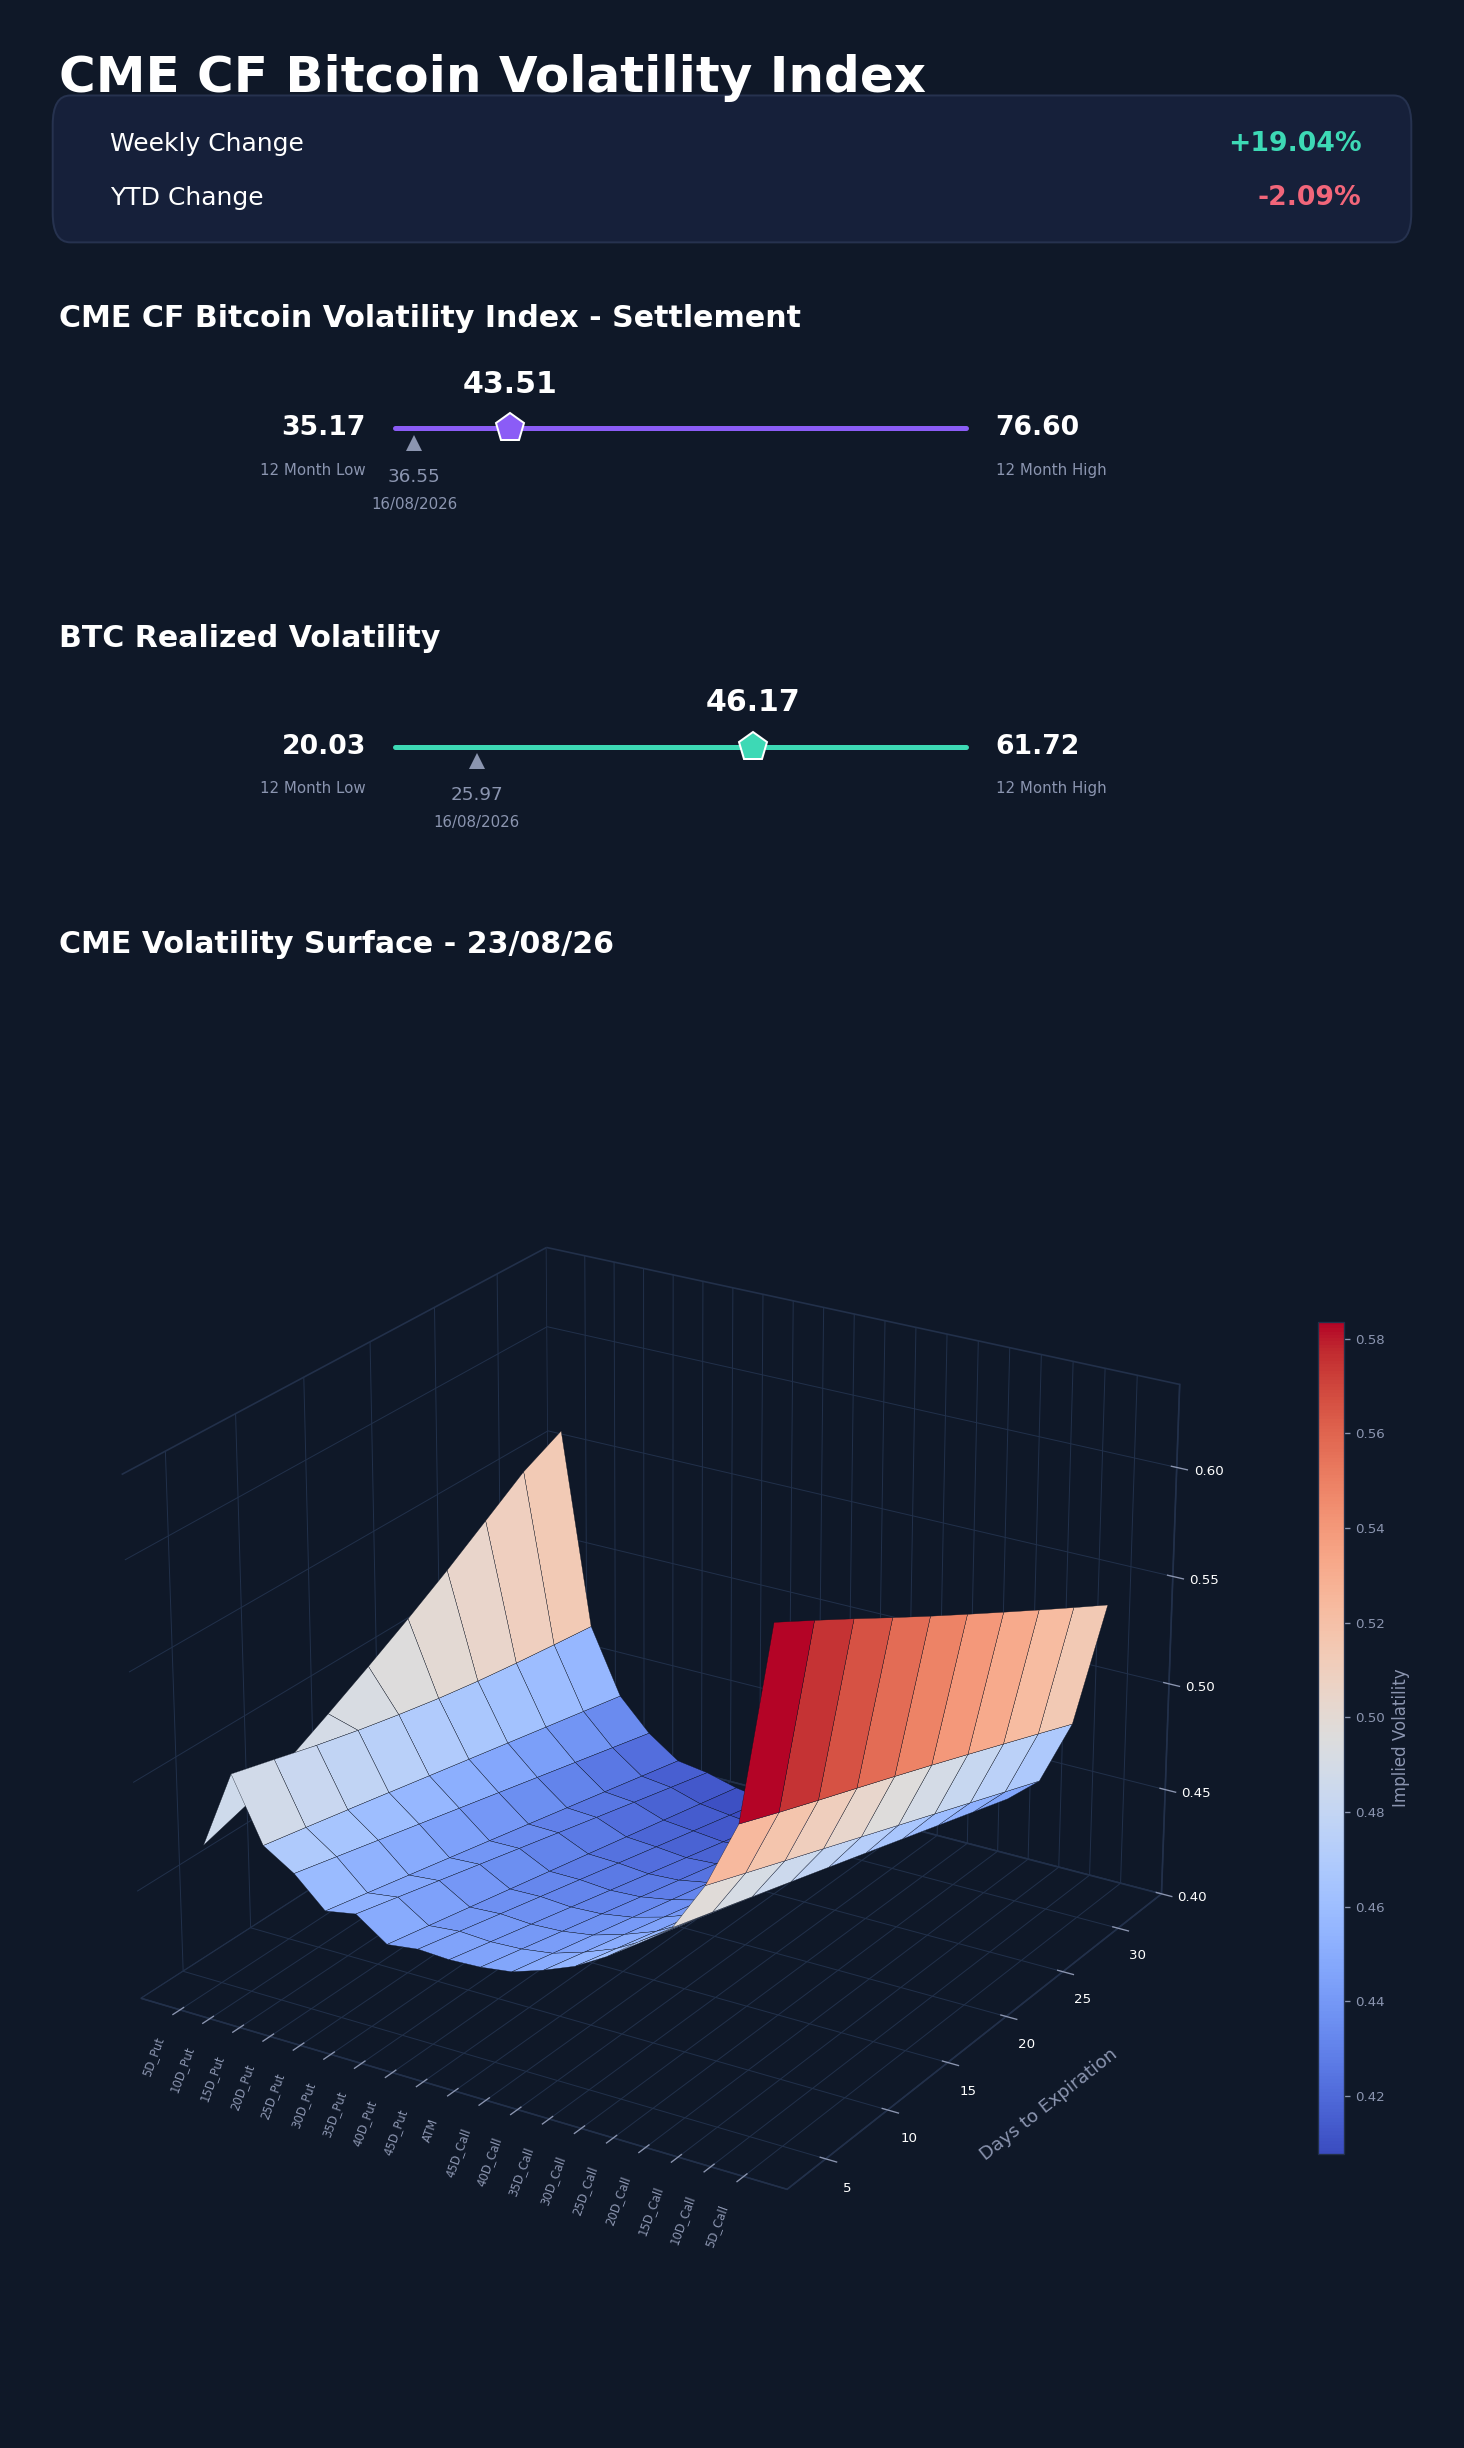
Realized volatility outran implied volatility last week. The CME CF Bitcoin Volatility Index (BVXS) settled the week at 43.51, up 6.96 vol. points and 19.04% w/w, while 30-day realized volatility rose 20.21 points to 46.17, up 77.82%. The gap between the two flipped sign: realized now sits 2.66 vol. points above BVXS, against a 10.58-point implied premium a week earlier. Spot and realized volatility accelerated through Thursday and Friday, after Bessent's buyback announcement put a fiscal and dollar narrative at the center of the move. BVXS held a tight 35.81-to-36.15 range Monday the 17th through Wednesday the 19th, then jumped to 40.92 on Thursday the 20th and 43.90 to 43.95 Friday the 21st and Saturday the 22nd before easing to 43.51 at Sunday's close, while realized vol made the same turn a session earlier and harder, from 26.53 Wednesday to 40.42 Thursday and a 47.29 peak Friday. BVXS is still only 8.34 points above its 12-month low of 35.17 against a 76.60 high, and 2.09% below its 44.44 start-of-year reference. The implied surface shows the same asymmetry through positioning: at the shortest quoted tenor the 5-delta call prices 18.49 vol. points above at-the-money (63.28 against 44.79), against a 2.02-point put wing. This week's tenor grid, spanning 4 to 32 days, does not overlap cleanly with the prior snapshot's 13-to-131-day range, so no week-over-week surface comparison is drawn. The options market repriced a rally that was already underway rather than anticipating the fiscal narrative that broadened it.
Market Cap Index Performance
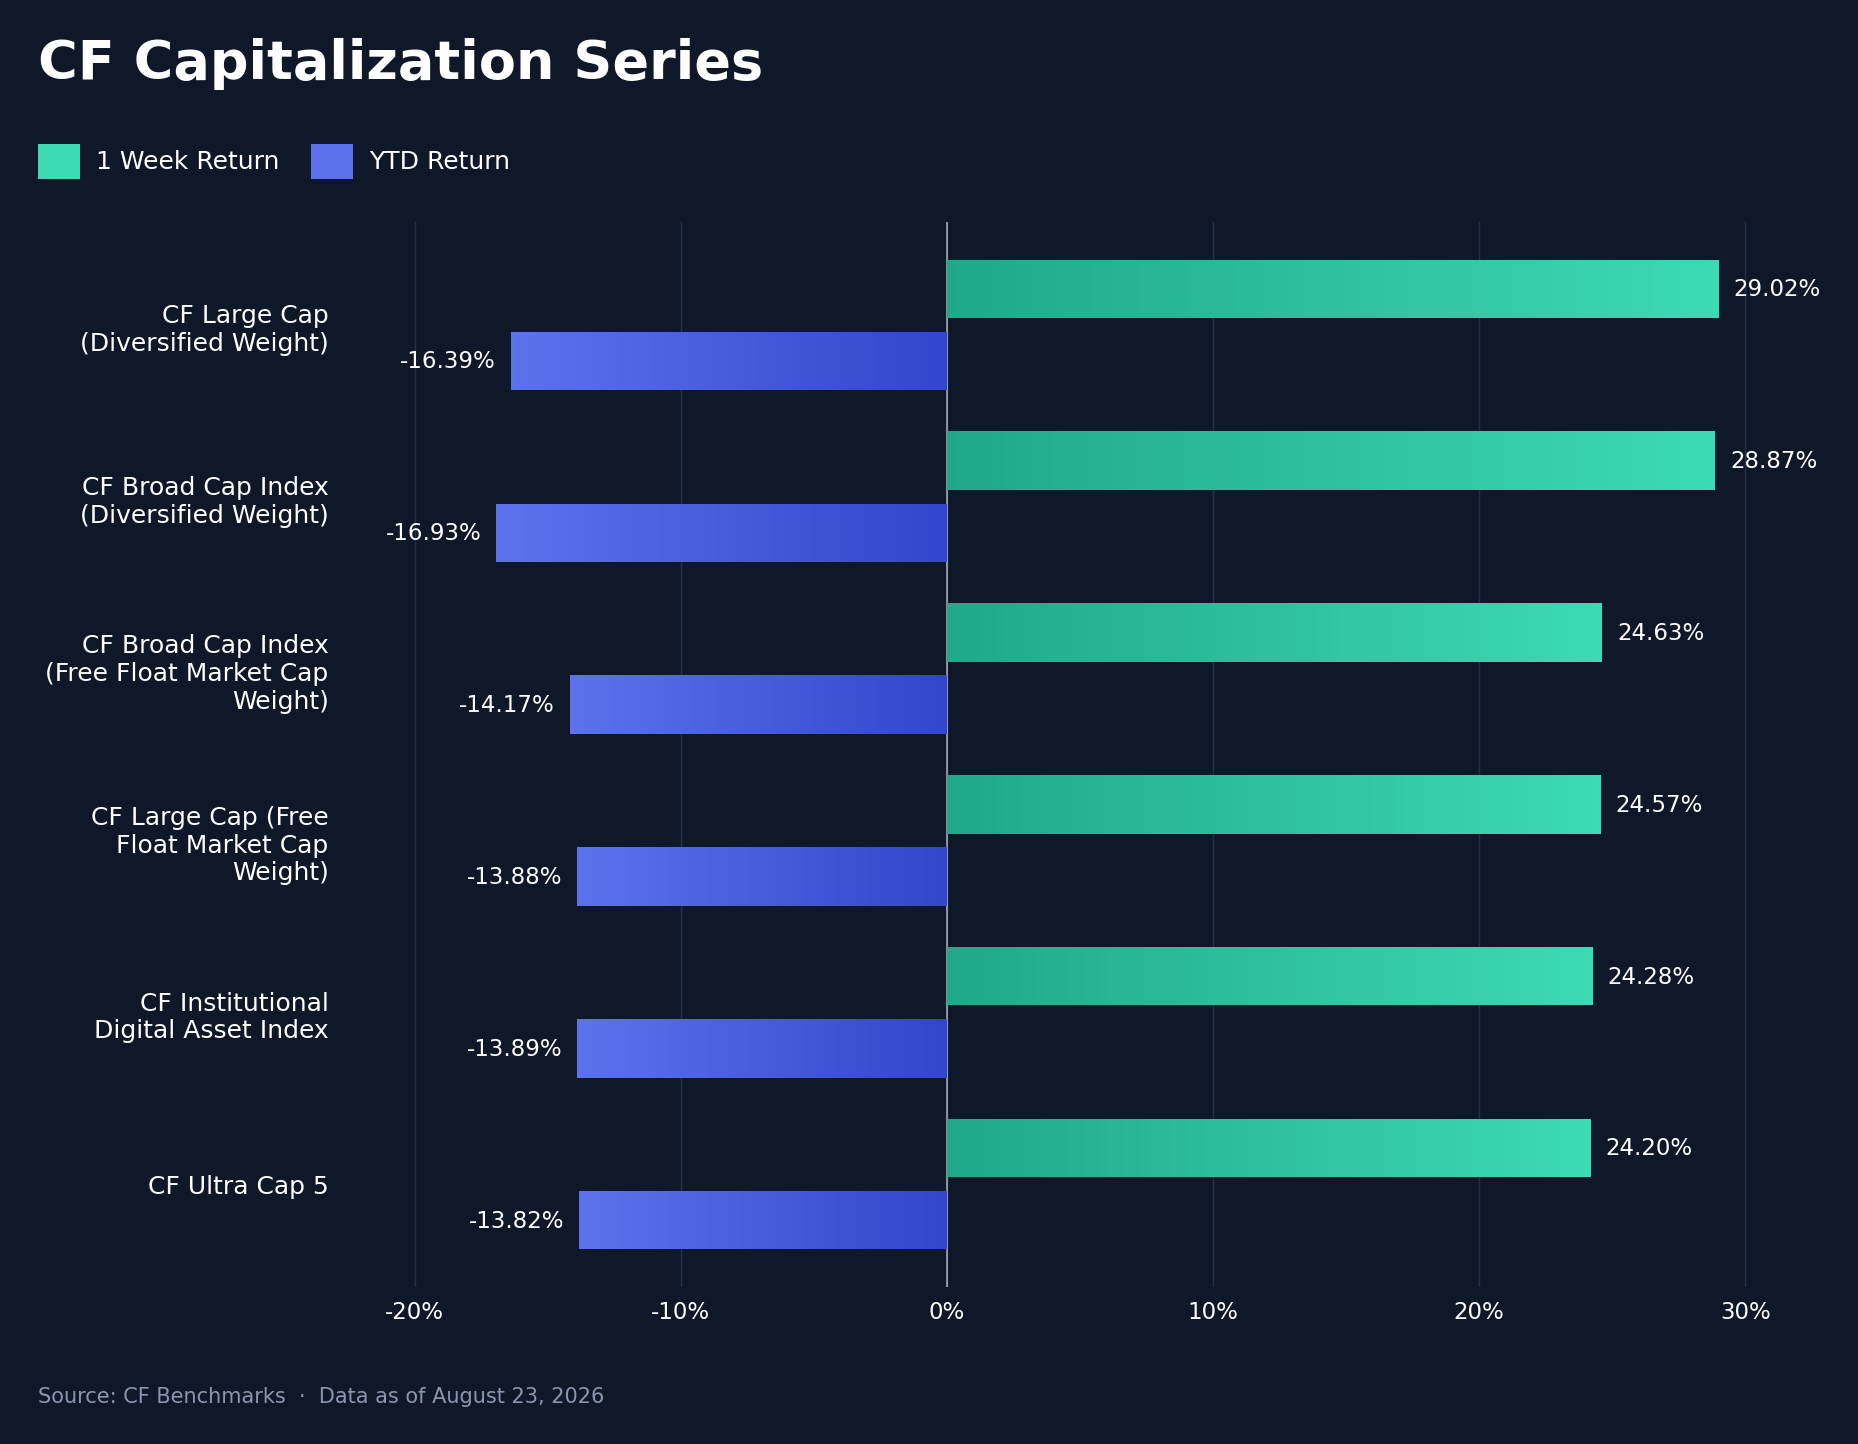
Every CF Capitalization Series index rose, reversing a week in which all six fell, and stayed inside a tight 4.82 pp band: CF Large Cap (Diversified Weight) led at 29.02% w/w, ahead of CF Broad Cap Index (Diversified Weight) at 28.87%, CF Broad Cap Index (Free Float Market Cap Weight) at 24.63%, CF Large Cap (Free Float Market Cap Weight) at 24.57%, the CF Institutional Digital Asset Index at 24.28% and the CF Ultra Cap 5 at 24.20%. Diversified weighting outperformed free float in both families, by 4.45 pp in Large Cap and 4.24 pp in Broad Cap, roughly eight times the 0.53 and 0.50 pp gaps a week earlier. That breadth fits the debasement read. Bessent's decision to lift long-end buybacks from 2bn dollars to at least 4bn, and leave room for more, coincided with a softer dollar, broad ETF demand and a rally that reached beyond the largest-weighted names. The 10-year yield testing cycle highs makes a conventional rates-relief explanation less persuasive. The White House meeting was an important regulatory development, but its natural transmission was into policy-sensitive tokens rather than every capitalization construction. Friday's S&P Global composite Purchasing Managers' Index printed a 52-month high alongside the week's largest single-day gain, but the same breadth persisted through hawkish FOMC minutes and was better matched by the fiscal, dollar and flow backdrop. Diversified leadership in both families is the index evidence that the rally moved beyond a narrow policy wager.
Factors Analysis
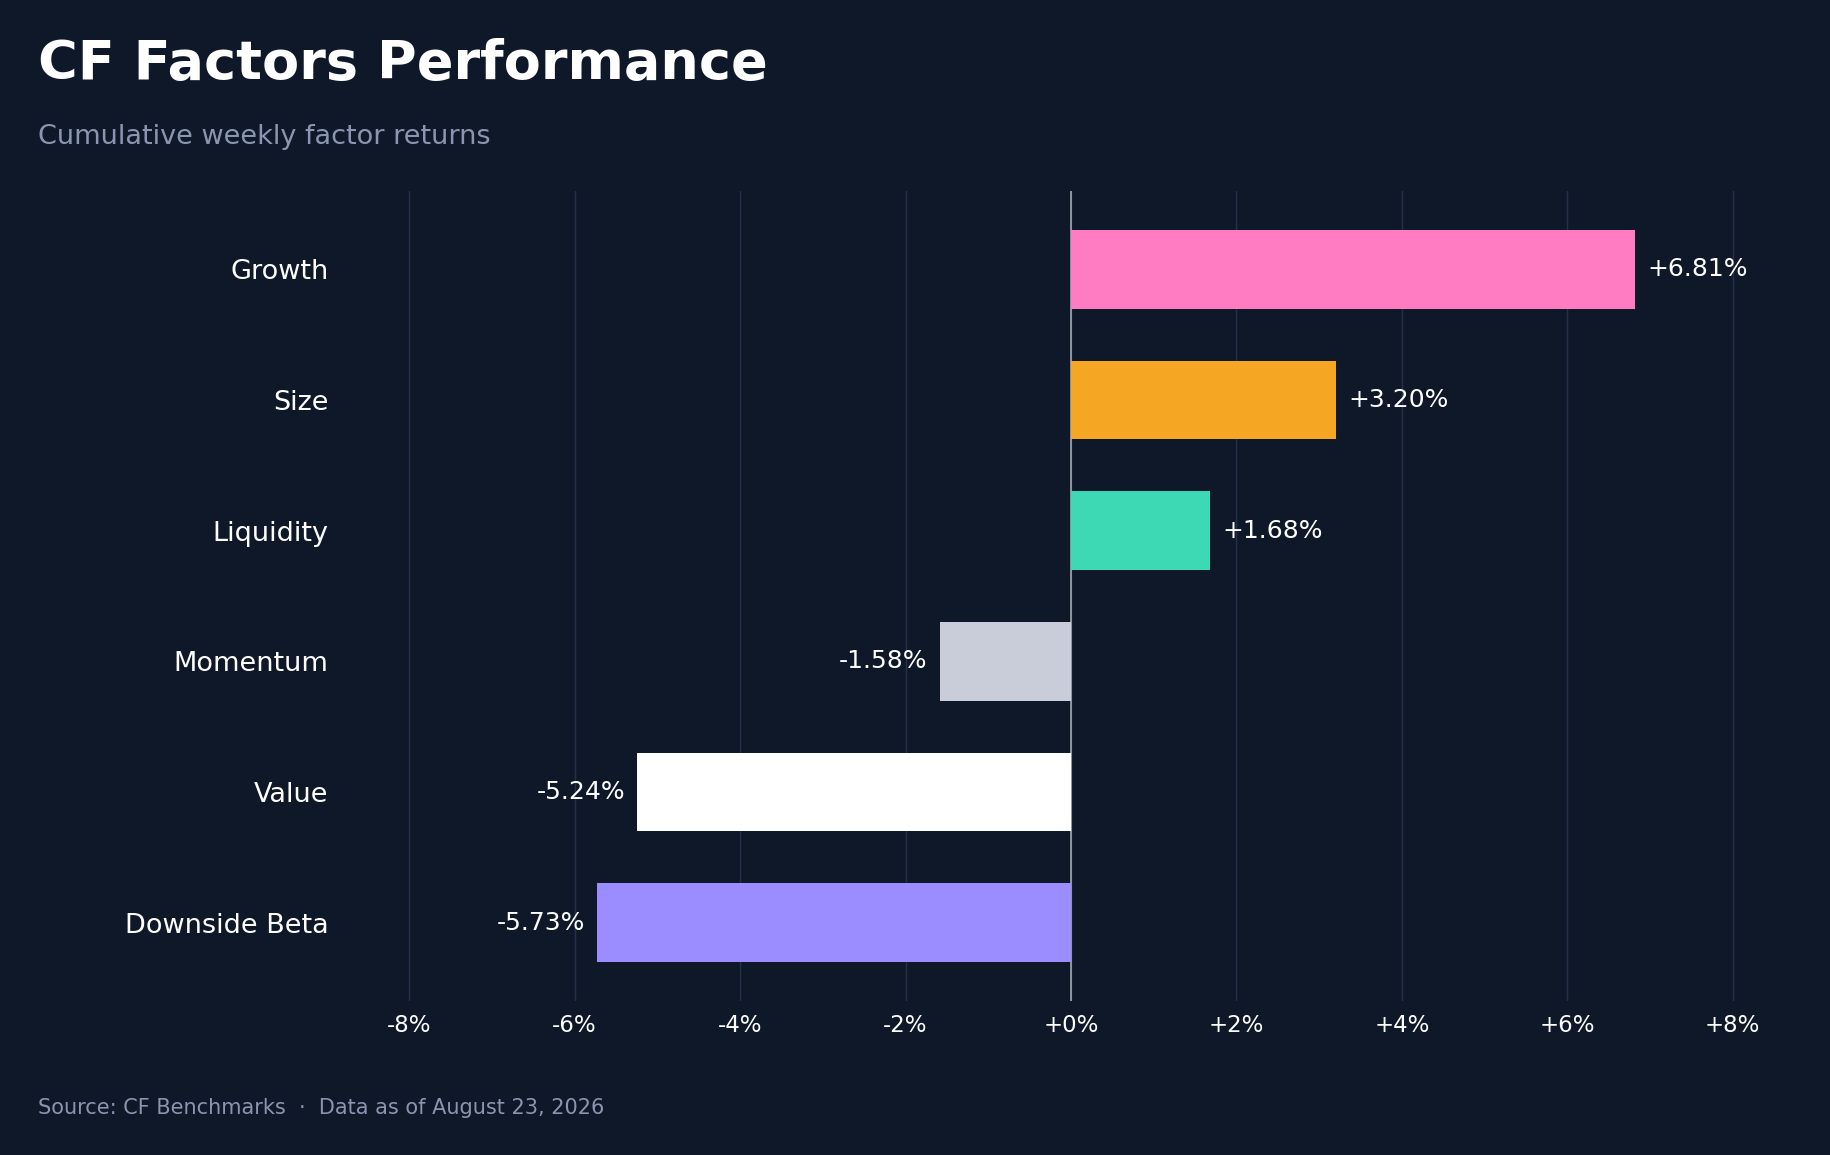
Factor dispersion snapped back after a quiet prior week. Growth led at 6.81%, Size added 3.20% and Liquidity 1.68%, while Downside Beta fell 5.73%, Value 5.24% and Momentum 1.58%, a 12.54 pp range against 1.74 pp a week earlier. Growth's rotation was the sharpest of the six, swinging 8.11 pp from -1.29% to its current 6.81%, and Downside Beta and Value both worsened by roughly 5 pp apiece, from -0.68% to -5.73% and -0.38% to -5.24%. A rally that pays Growth and Size while penalizing Downside Beta and Value rewards the names most exposed to the upside move rather than the ones with the highest historical downside sensitivity, the mirror image of a defensive rotation.
Read our latest weekly crypto factors report: Factor Friday - August 21, 2026
Classification Series Analysis
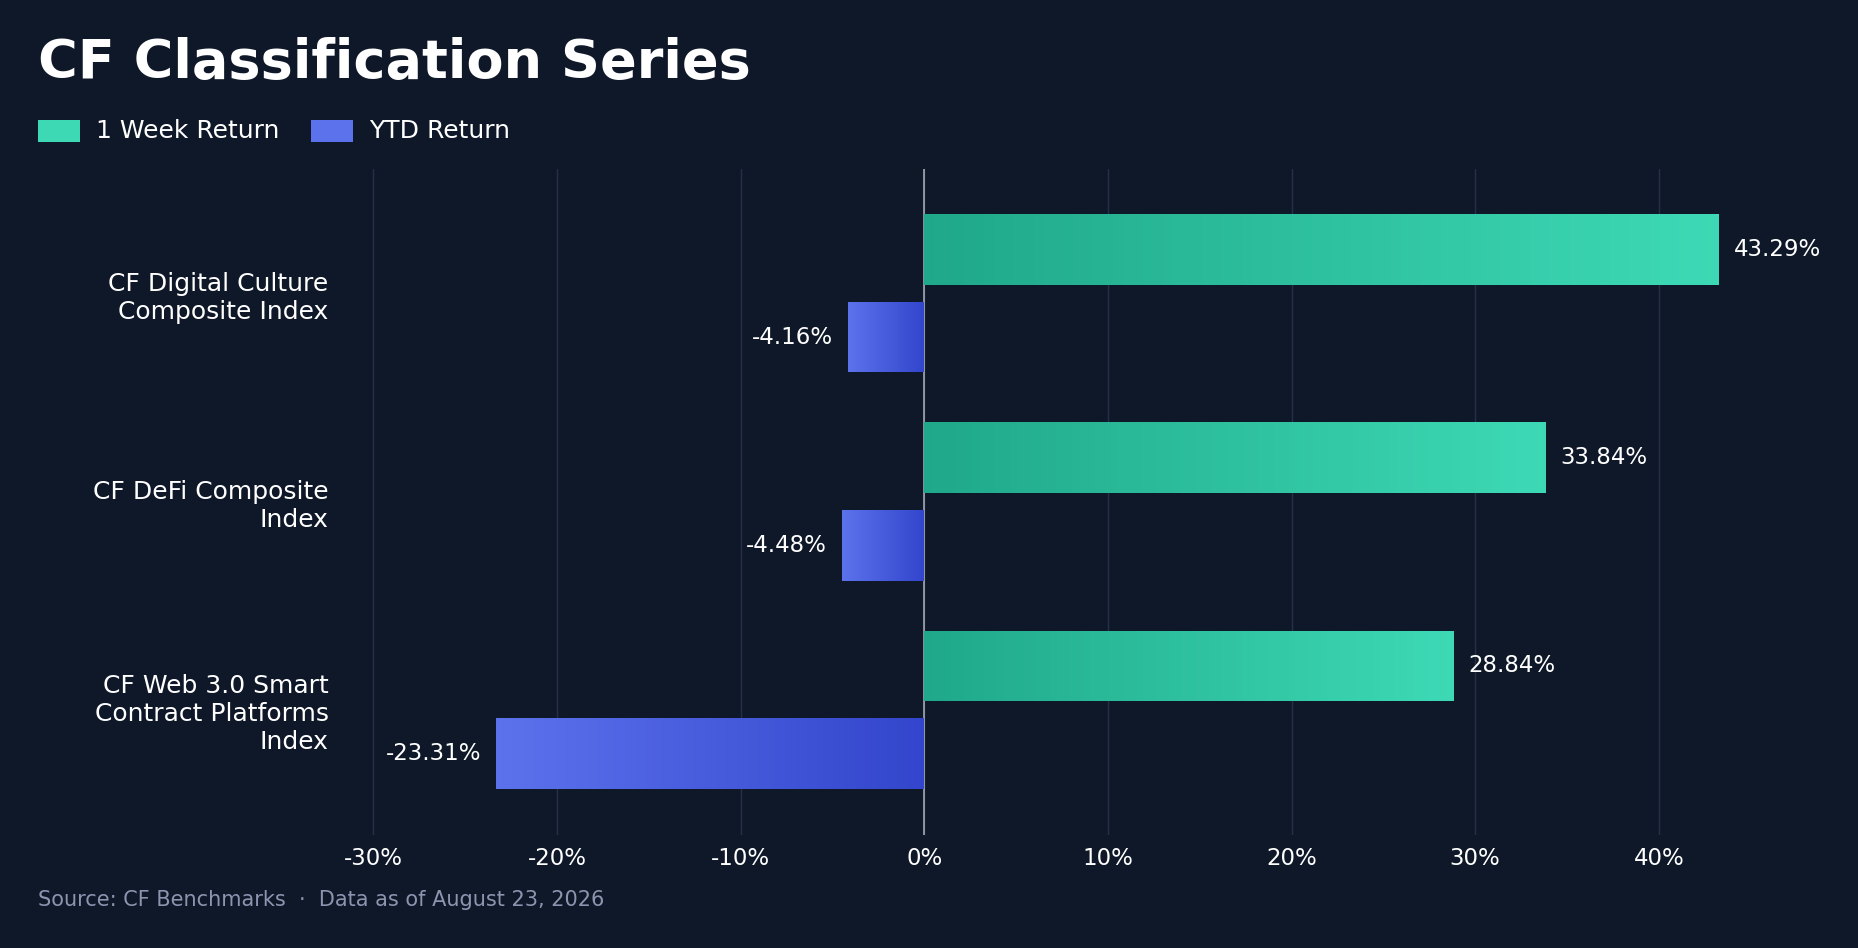
All three CF Classification Series composites extended the rally, and CF Digital Culture widened its lead. The CF Digital Culture Composite Index rose 43.29% w/w, ahead of the CF DeFi Composite Index at 33.84% and the CF Web 3.0 Smart Contract Platforms Index at 28.84%, a 14.45 pp spread against 2.69 pp a week earlier, when Digital Culture also led but by less. DeFi swapped places with Web 3.0 in the ranking, tracking the gains in the CF DACS Finance constituents described below. Year-to-date (YTD) the week's advance closed most of the gap opened earlier in the year: Digital Culture and DeFi sit at -4.16% and -4.48% YTD, both a single weekly move away from flat, while Web 3.0 remains the laggard at -23.31%, the one composite the week's rally did not fully repair.
Sector Analysis
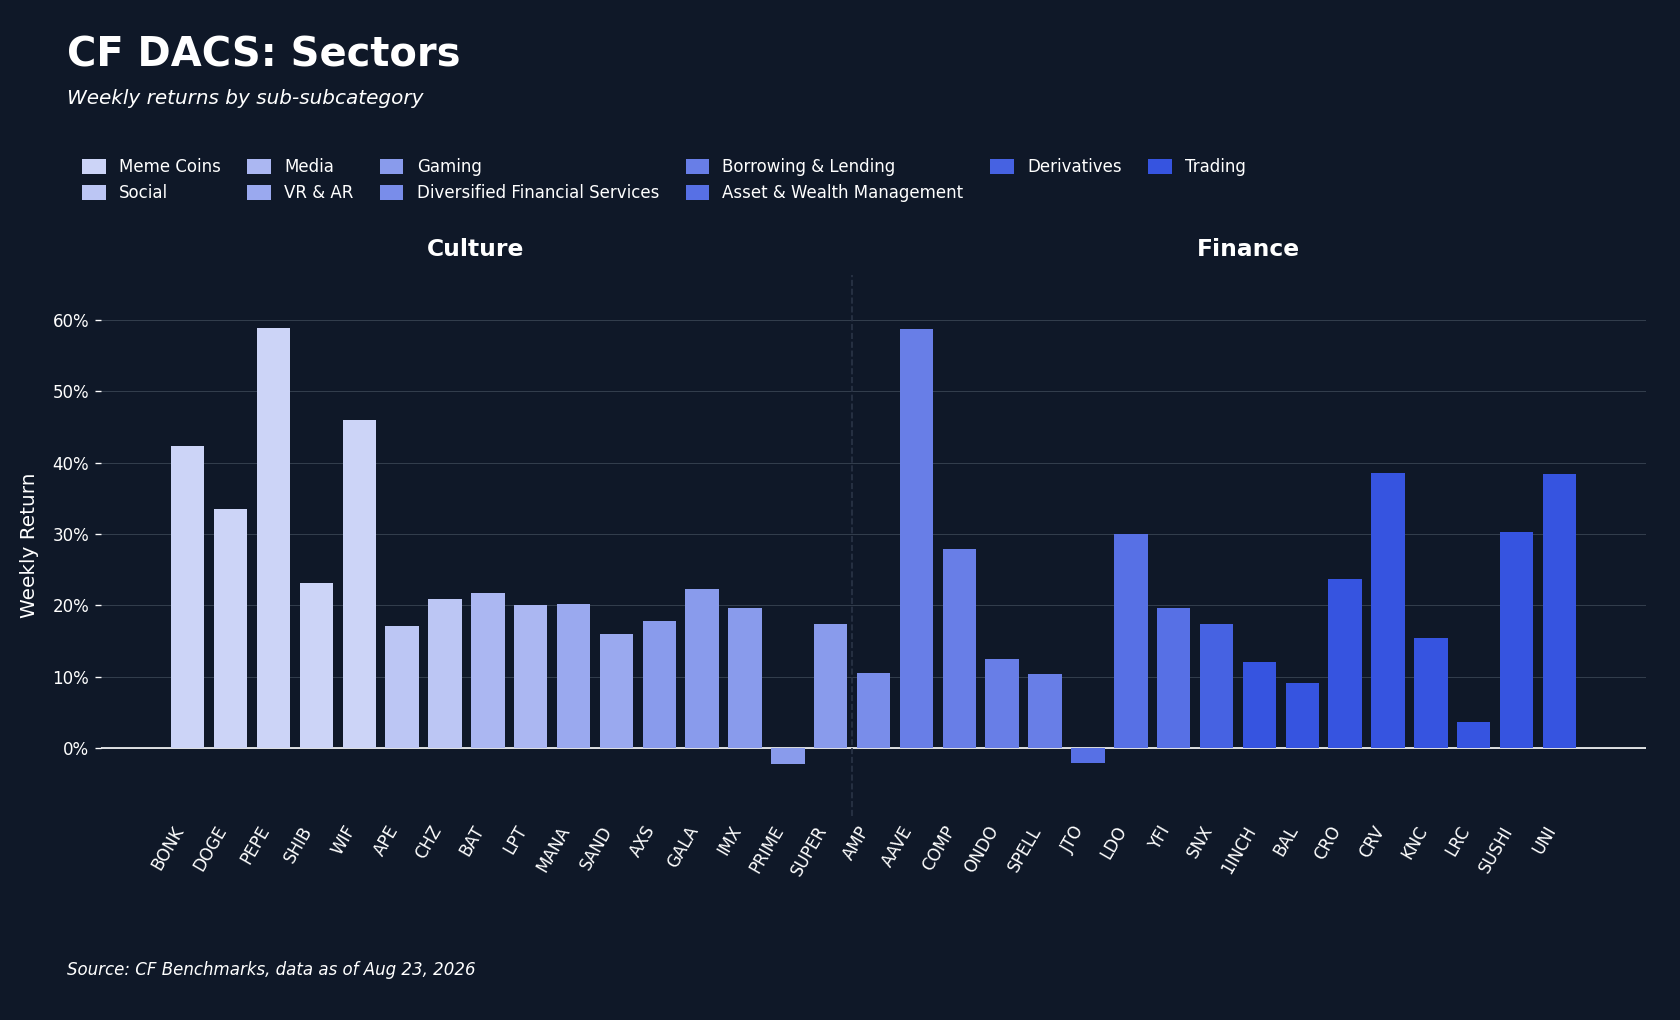
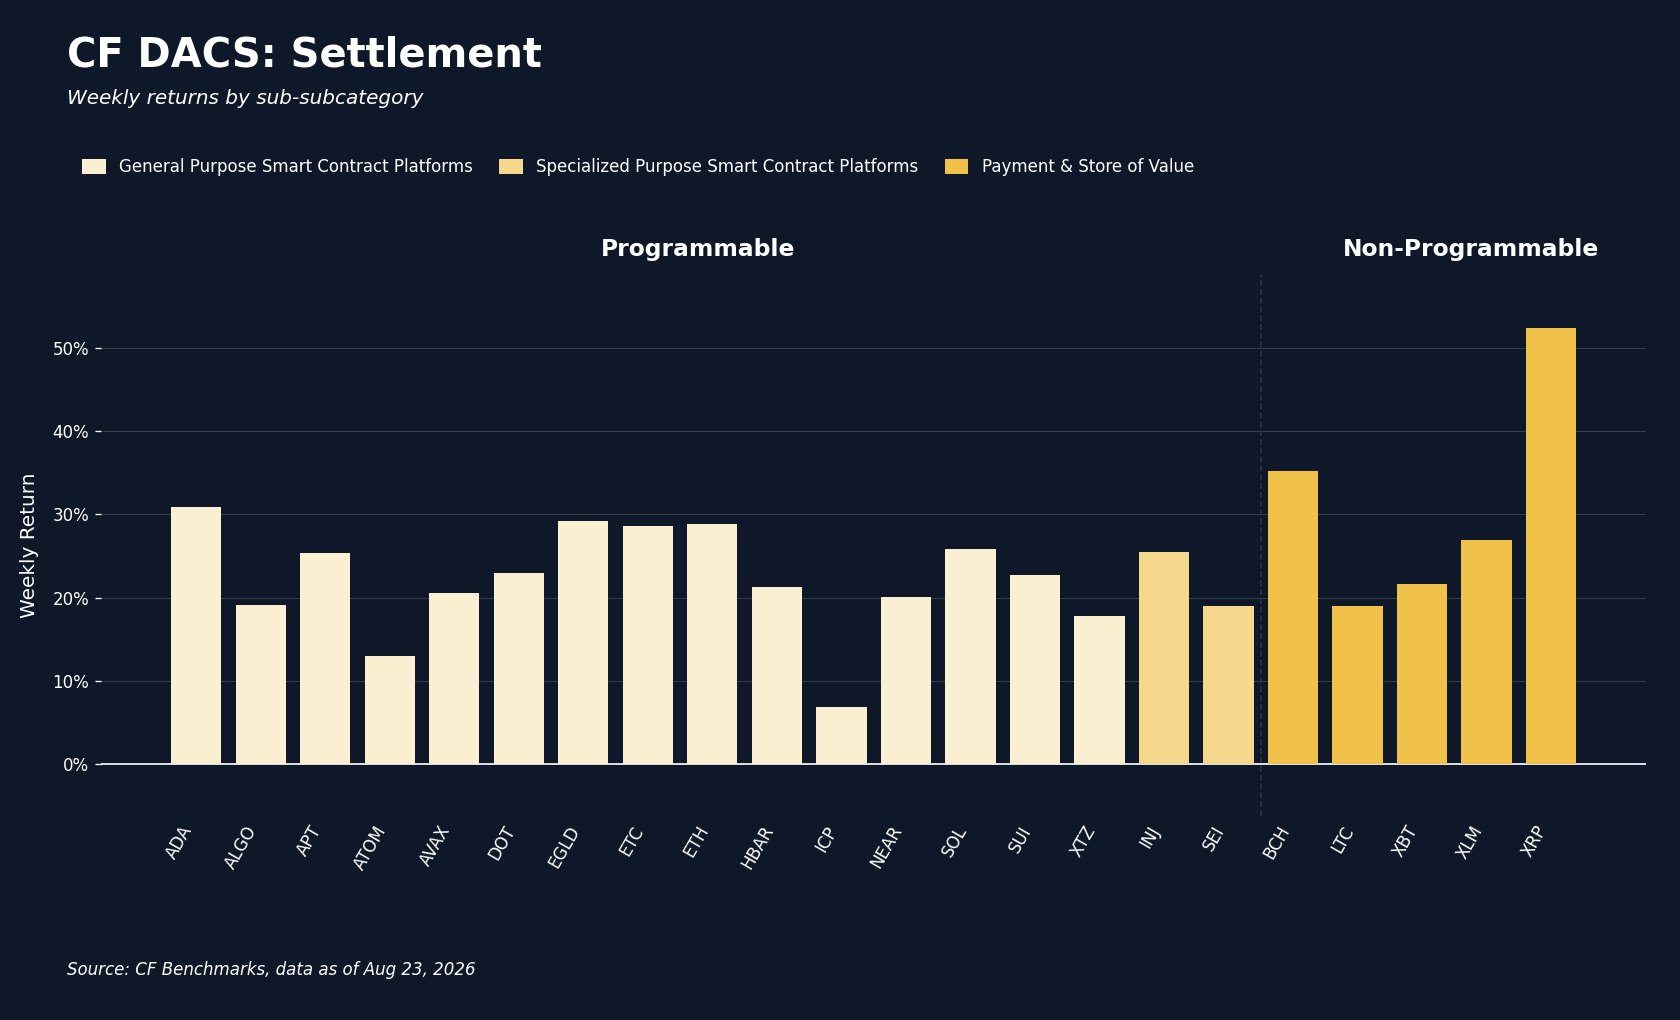
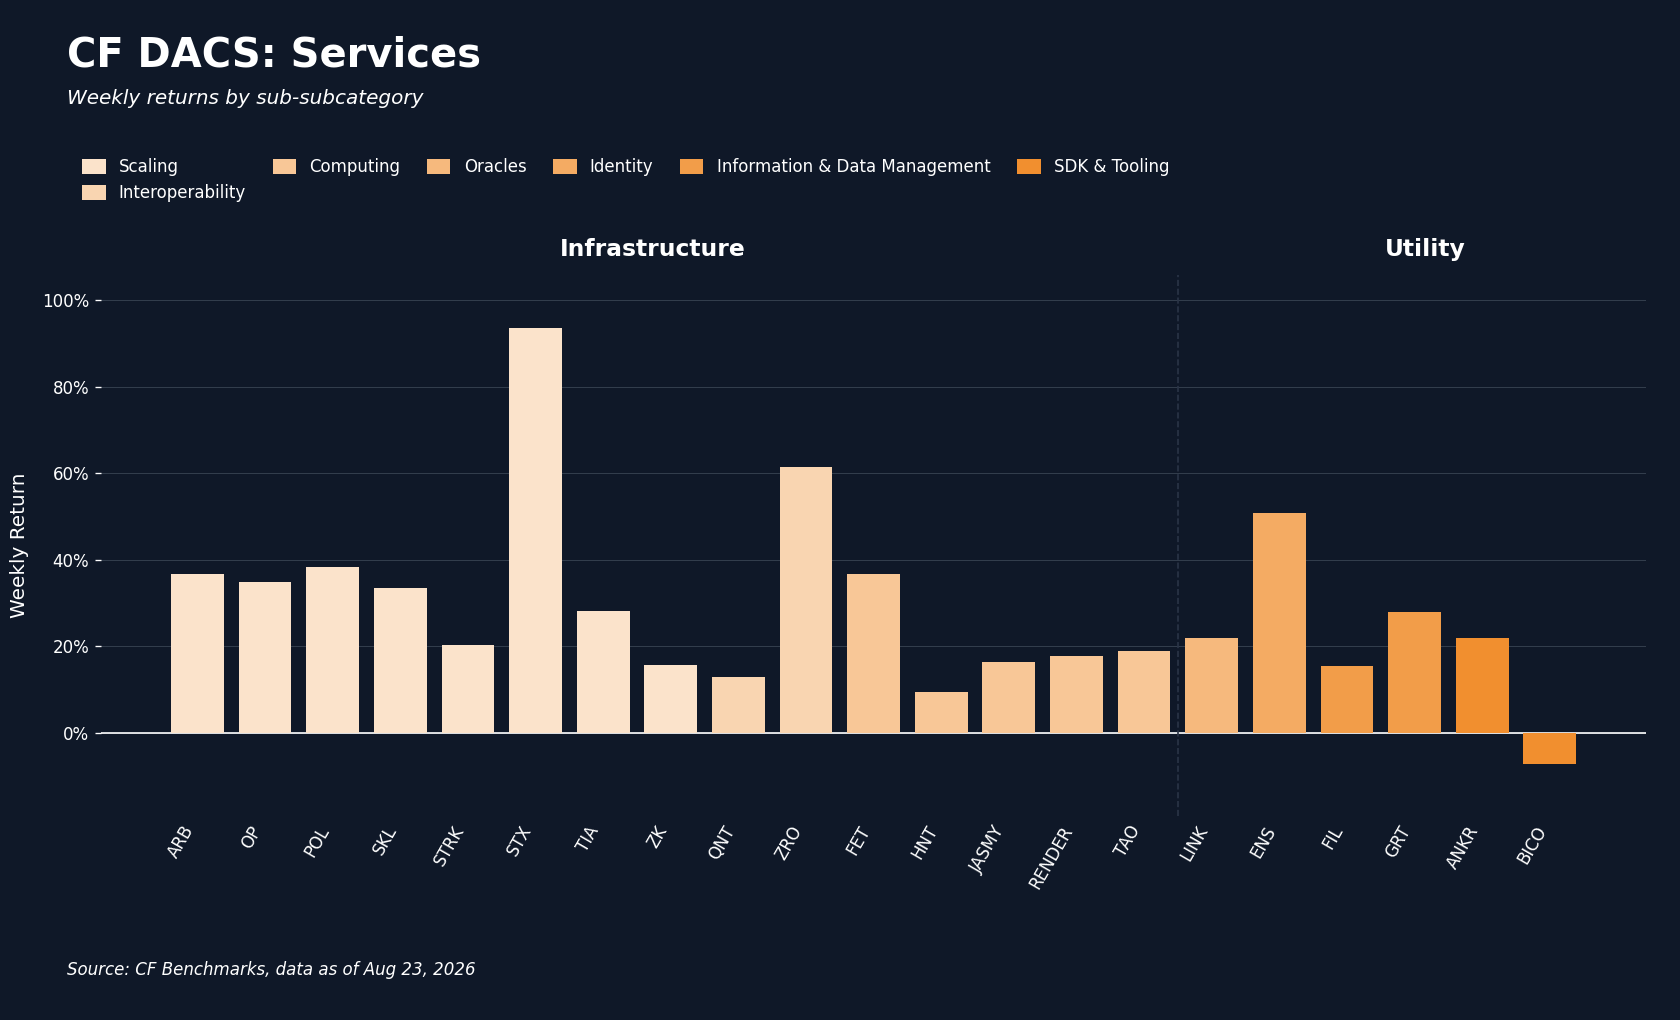
The sector table sets the limit of the White House explanation. The meeting offered a plausible regulatory tailwind for DeFi and Hyperliquid-related trading, but it does not explain every CF DACS Sub-Category rising or the six averages banding within 10.63 pp. Infrastructure led at 31.59%, followed by Non-Programmable at 31.05%, Culture at 24.67%, Programmable at 22.20%, Utility at 21.73% and Finance at 20.96%, a breadth pattern that fits the wider debasement and dollar impulse. Within that broad beta move, Infrastructure's lead has a dated, constituent-level driver: Stacks (STX) rose 93.64% on the week after announcing the Genesis Bond, a self-custodial Bitcoin yield mechanism, on the 17th, with 28% of that move landing in the first 24 hours. LayerZero (ZRO) added 61.47% despite a scheduled token unlock equal to 4.4% of released supply on the 20th without a visible selloff, consistent with the broad bid overwhelming a supply-negative event rather than a fresh catalyst. In Culture, The Sandbox (SAND) rose 15.99% even after disclosing a cross-chain exploit on the 22nd that minted an unbacked face value near 49bn dollars against an actual drain of about 675,000 dollars, and traded up on the disclosure day. Biconomy (BICO) at -7.18% was one of only three negative constituents, alongside Jito (JTO) at -2.10% and Parallel (PRIME) at -2.17%. STX and BICO set the week's widest constituent spread at 100.82 pp, showing that the macro-fiscal frame set the market's direction while individual token events still determined the extremes.
CF Staking Series
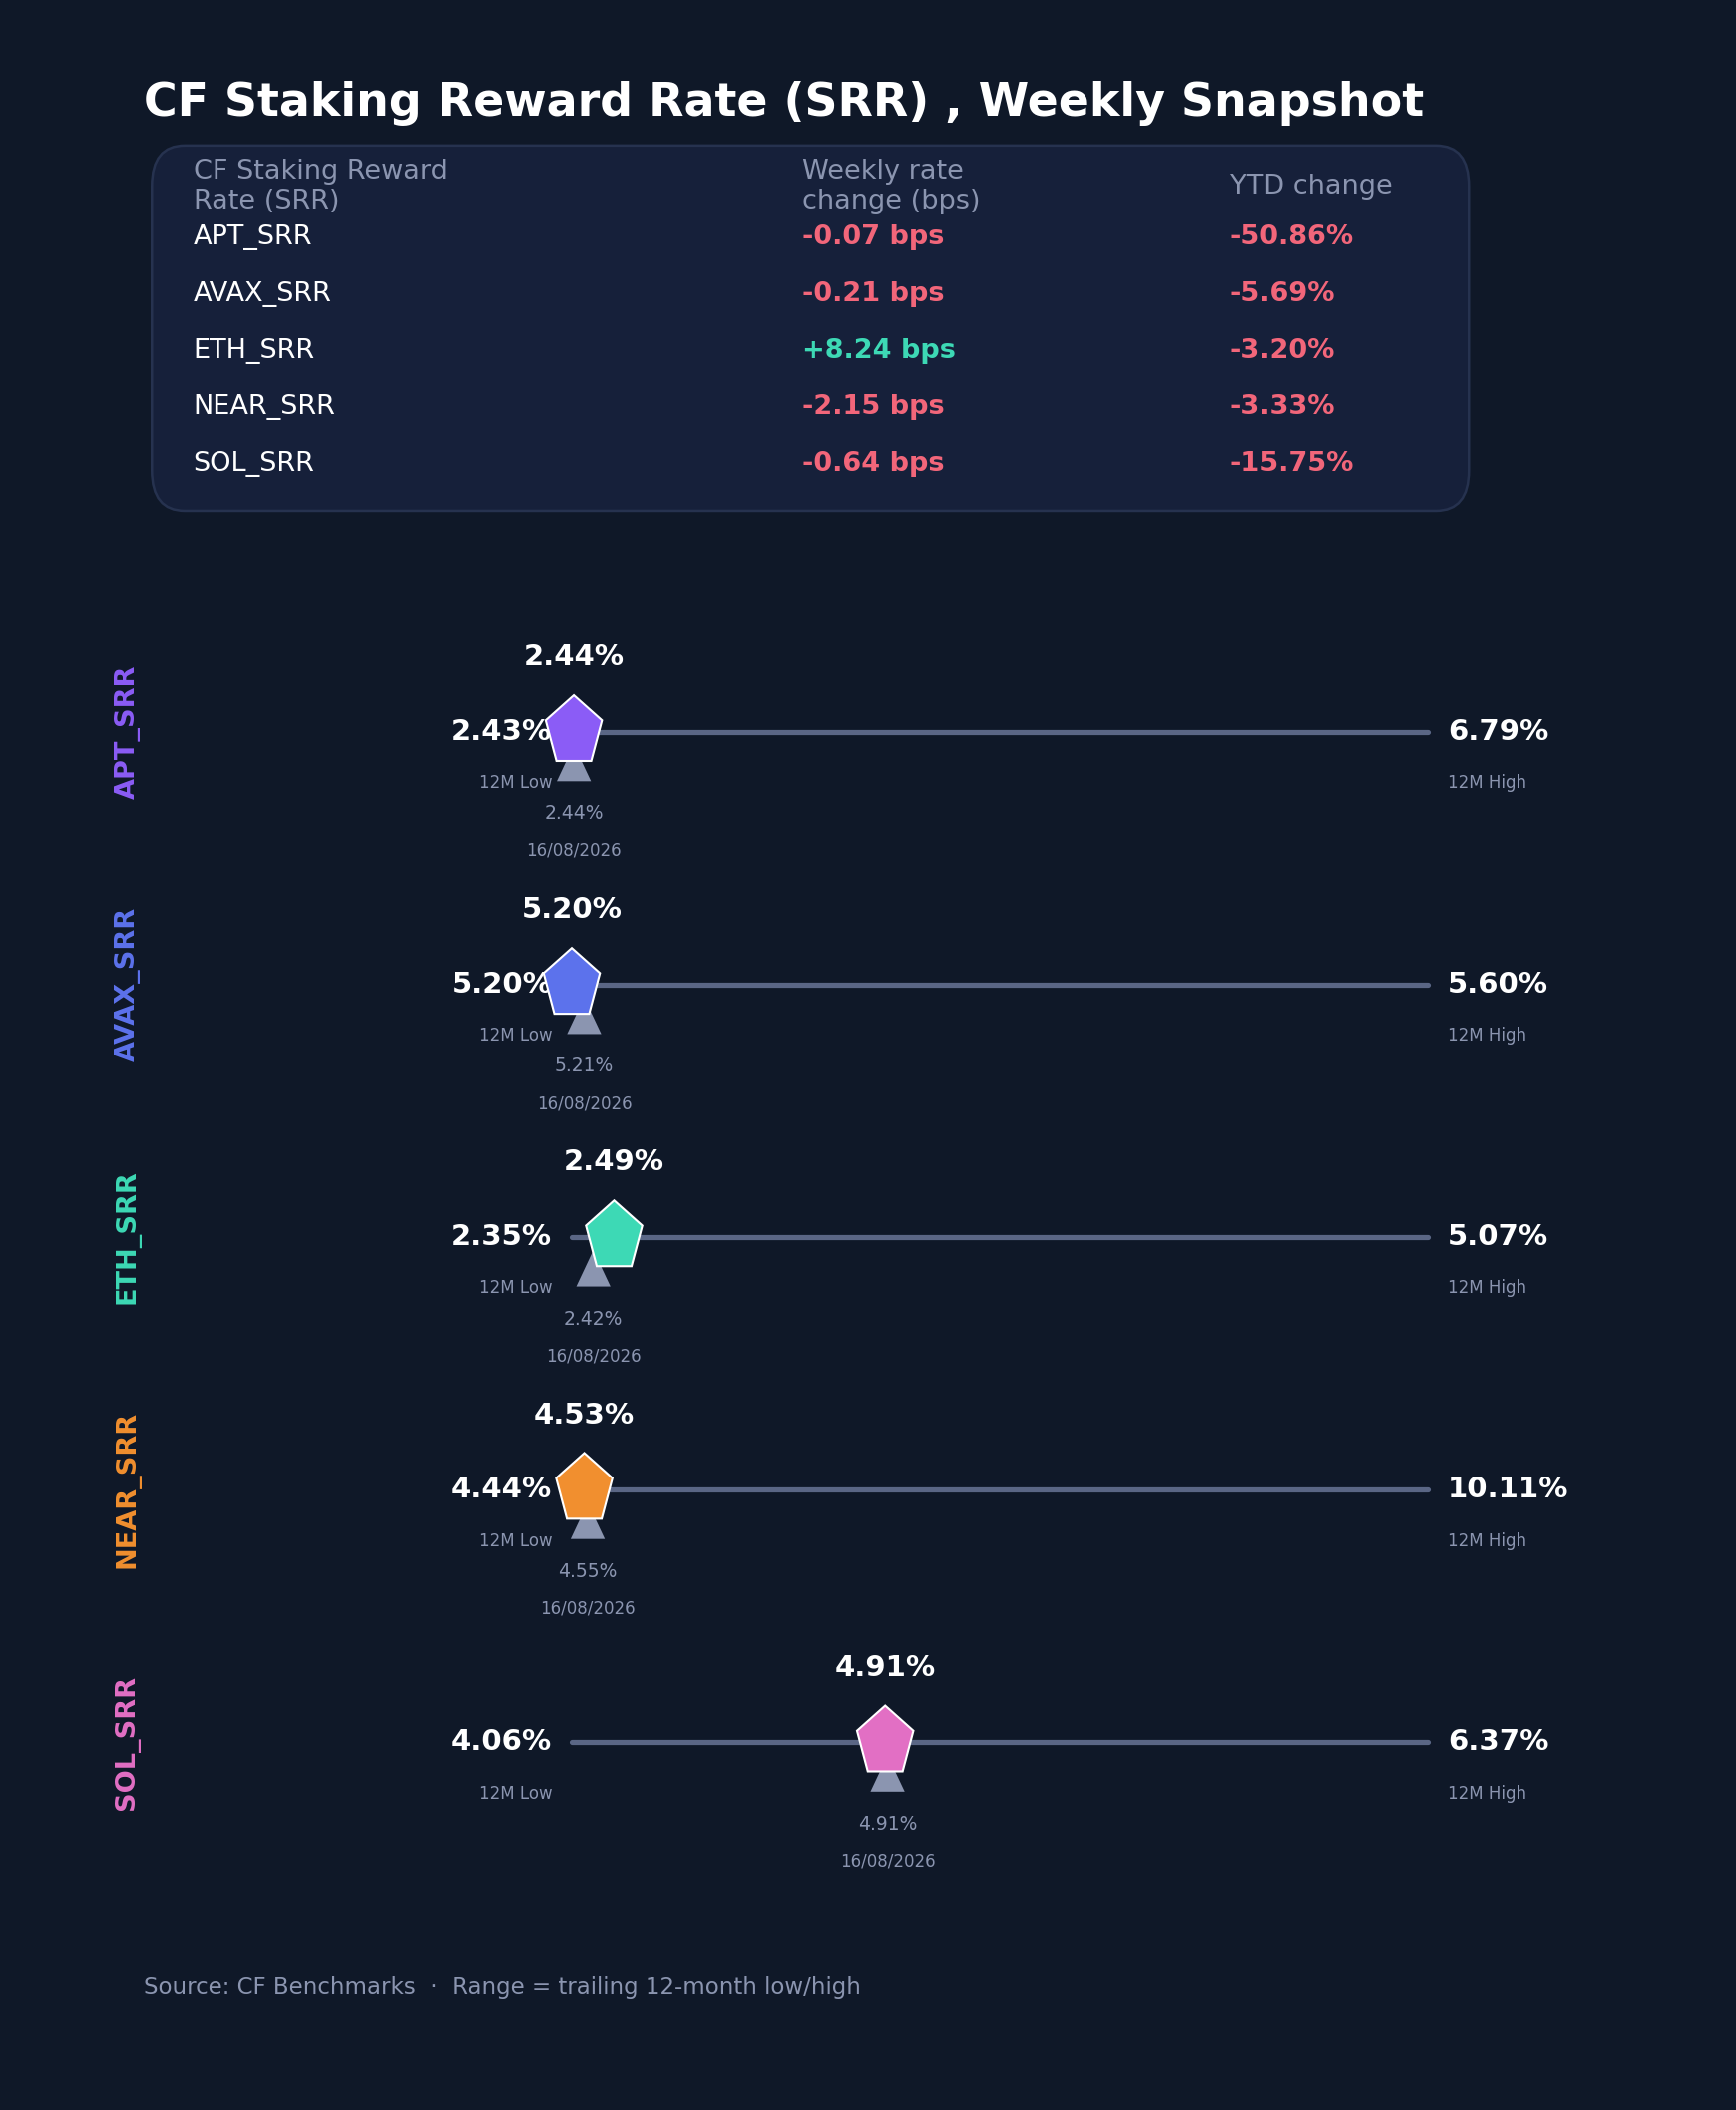
Reward rates were little changed while the underlying tokens rallied hard, widening the gap between staking yield and spot performance. Ether (ETH) added 8.24 bps to 2.4863%, the only riser and the week's best relative index return at 3.43%; NEAR fell 2.15 bps to 4.5260% and posted the worst relative return at -0.47%, with Solana (SOL) -0.64 bps to 4.9073%, Avalanche (AVAX) -0.21 bps to 5.1991% and Aptos (APT) effectively flat at 2.4390%, down 0.07 bps. The five relative returns span 3.90 pp, from ETH's 3.43% to NEAR's -0.47%, a narrow band next to the 20% to 52% moves in the underlying spot tokens over the same week, since the staking index nets the reward rate against spot performance. Current reward rates range 276.0 bps across the set, from Aptos's 2.4390% to Avalanche's 5.1991%, with ETH's rate still close to the 2.3518% 12-month low it set earlier in the year. A rally this broad moving reward rates by low single-digit basis points is the expected result of a spot-driven week, not a validator-economics story.
Interest Rate Analysis
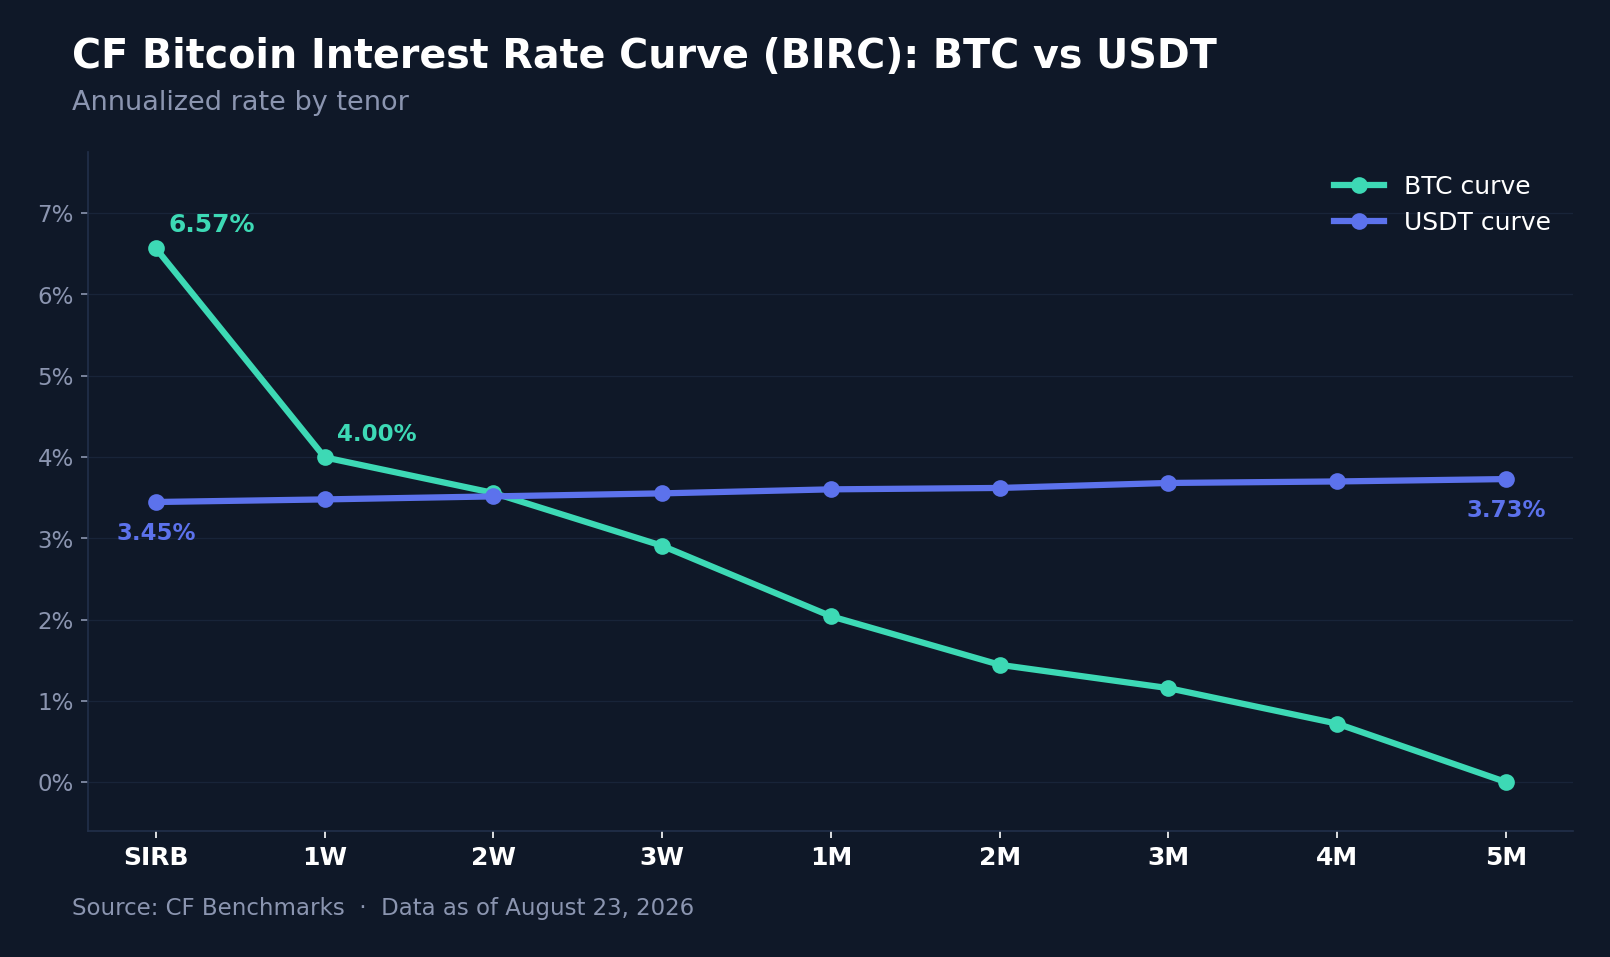
The BTC curve reshaped through the belly rather than shifting in parallel. The Bitcoin Session Rate (SIRB) rose 8.9 bps to 6.5664% and the 4-month eased 3.7 bps to 0.7185%, the curve's only decline, while the 1-week jumped 155.8 bps to 3.9955%, the 2-week 295.0 bps to 3.5573%, the 3-week 227.4 bps to 2.9071%, the 1-month 133.4 bps to 2.0402%, the 2-month 58.6 bps to 1.4428% and the 3-month 34.9 bps to 1.1555%; the 5-month held at 0.0000% for a further week, a real level rather than a null. Tenor changes across both curves ran from -3.7 bps to +295.0 bps, with every one of the seven largest moves sitting in the BTC 1-week-to-3-month stretch. That concentration is consistent with the positioning adjustment that followed the Treasury buyback and the return of the debasement trade, rather than a clean repricing of long-dated carry. The USDT curve moved the way it usually does, up 16.6 to 18.8 bps at every tenor and holding its upward slope from 3.4461% at SIRB to 3.7283% at five months. The dollar side of term funding remained orderly while the BTC belly absorbed the demand for exposure and collateral.
Closing Synthesis
The week reads as a debasement trade returning to digital assets. Bessent's decision to raise long-end Treasury buybacks to at least 4bn dollars, with scope for further purchases, coincided with a softer dollar, broad ETF inflows and an advance across every CF Single Asset, Capitalization and Classification series. The White House push on the Digital Asset Market Clarity Act remains relevant, especially for regulatory-sensitive DeFi and Hyperliquid trading and for XRP's exceptional move, but it is secondary to the market-wide fiscal and dollar frame. The internals reinforce that read: BVXS rose 19.04% against a 77.82% jump in realized volatility, the BTC term curve dislocated through the belly, and diversified capitalization indices outperformed their free-float counterparts. STX's Genesis Bond then provided the clearest token-specific catalyst inside an otherwise broad advance. The week was a cross-asset repricing of fiscal and currency risk, amplified by flows and short covering, with the White House meeting shaping where some of the most policy-sensitive demand landed.
The information contained within is for educational and informational purposes ONLY. It is not intended nor should it be considered an invitation or inducement to buy or sell any of the underlying instruments cited including but not limited to cryptoassets, financial instruments or any instruments that reference any index provided by CF Benchmarks Ltd. This communication is not intended to persuade or incite you to buy or sell security or securities noted within. Any commentary provided is the opinion of the author and should not be considered a personalised recommendation. Please contact your financial adviser or professional before making an investment decision.
Note: Some of the underlying instruments cited within this material may be restricted to certain customer categories in certain jurisdictions.
Factor Friday - October 9, 2026
Size led CF Benchmarks' factor table for a second week at 2.58% as the Market fell 4.98%. Size held after QNT's reversal, though its cohort spread narrows sharply without three outlier tokens, and Downside Beta and Liquidity gave back part of last week's gains.

Mark Pilipczuk
Small Cap Tokens Outperform in September
The CF Free-Float Broad Cap Index rose 10.28% in September as Bitcoin supplied 59% of the gain while trailing the index. Returns across the Capitalization Series ran from +7.74% for Ultra Cap 5 to +14.01% for Emerging Crypto, which holds no Bitcoin, as altcoins outpaced Bitcoin.
Mark Pilipczuk
CF Digital Asset Index Family Multi Asset Series – Extraordinary Rebalance Announcement
CF Digital Asset Index Family Multi Asset Series - Extraordinary Rebalance Announcement
CF Benchmarks
By clicking Accept, you consent to CF Benchmarks's use of cookies.
Visit Cookie Settings to learn how CF Benchmarks uses cookies and to adjust your preferences.