
Jun 01, 2026
An Orderly De-Risking: Defense Leads, DeFi Bears the Brunt
Weekly Index Highlights, June 1, 2026
Our read of the week is straightforward: this was a de-risking, not a capitulation. Digital assets fell broadly, with every constituent of the CME CF Single Asset Series lower on the week, yet the selling was strikingly even-handed and the internals were defensive rather than disorderly. Low-beta exposure led the factor complex, last week's momentum and value winners rolled over, and the damage concentrated in decentralized finance. Volatility and funding tell the same story from two angles: implied volatility slipped while realized rose off a 12-month low, and Bitcoin's overnight funding rate collapsed even as its one-to-three-week tenors jumped. Taken together, the week looks like a measured reduction of risk.
Market Performance Update
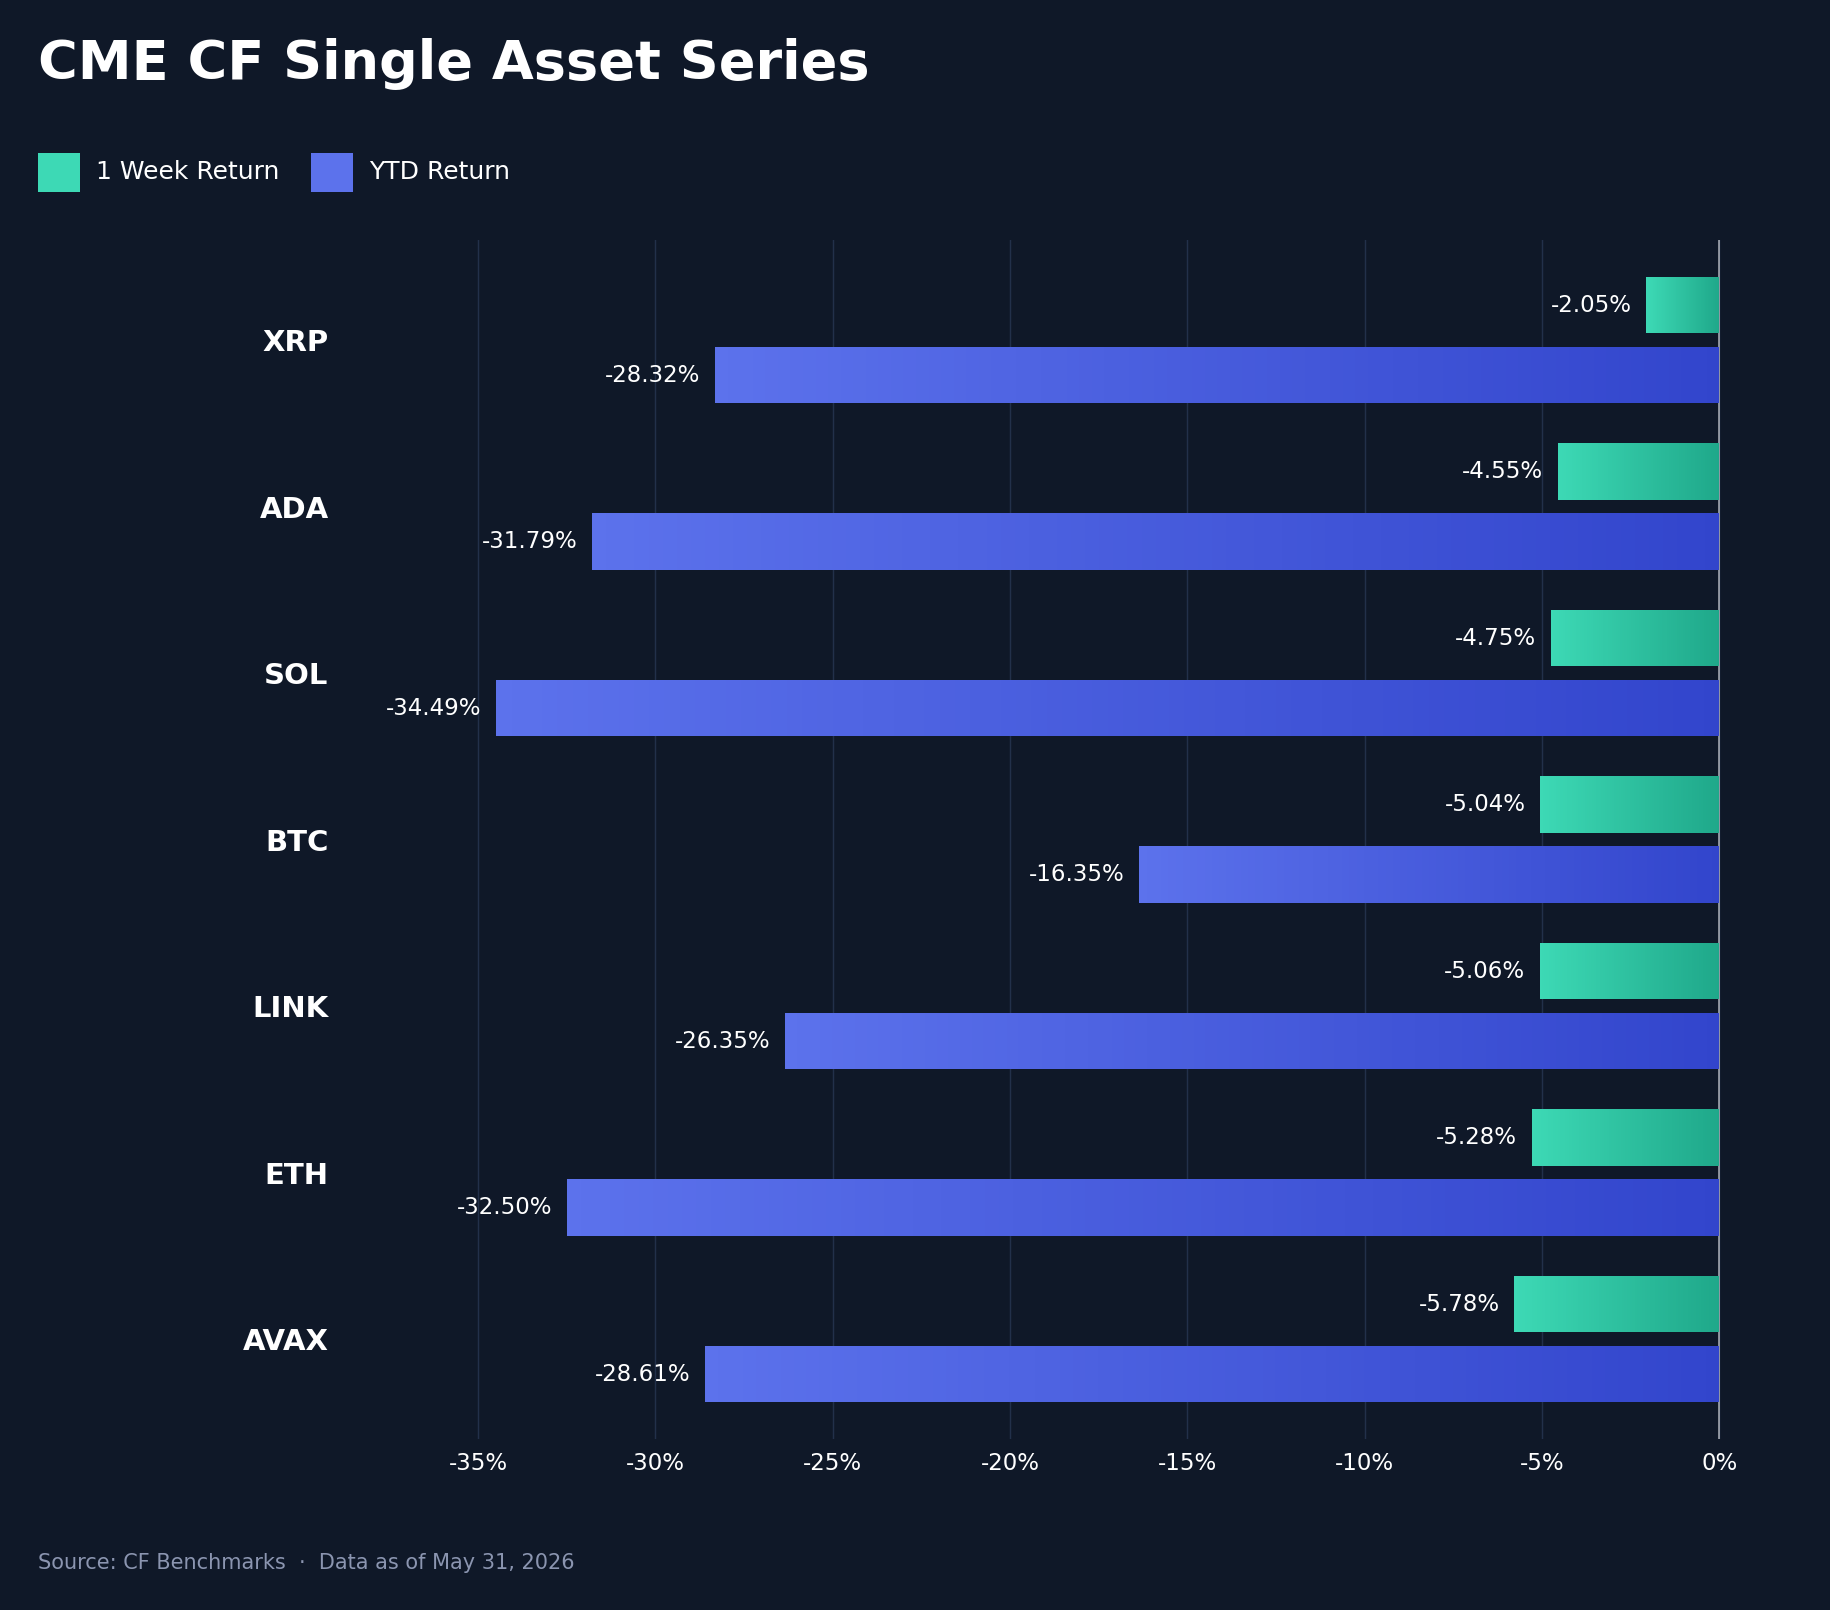
Digital assets retreated across the board over the past week, with the CME CF Single Asset Series posting losses for all seven constituents on a week-on-week (w/w) basis. What stands out is not the direction but the compression. XRP (XRP) held up best at -2.1%, followed by Cardano (ADA) at -4.5% and Solana (SOL) at -4.7%, while Bitcoin (BTC) fell -5.0%, Chainlink (LINK) -5.1%, Ether (ETH) -5.3%, and Avalanche (AVAX) -5.8%. The spread between the best and worst performer was just 3.73 percentage points (pp), a tight band that tells us the market was repricing the complex as a single risk asset rather than discriminating between fundamentals. Notably, Bitcoin neither led the decline nor played its usual defensive role this week; it sat mid-pack. Its relative strength is a year-to-date (YTD) story instead, where its -16.4% loss is far shallower than Ether's -32.5%, Solana's -34.5%, or Cardano's -31.8%. We read the even, shallow dispersion as the signature of top-down risk reduction: when correlations converge like this, investors are trimming exposure to the asset class, not rotating within it.
Volatility Analysis
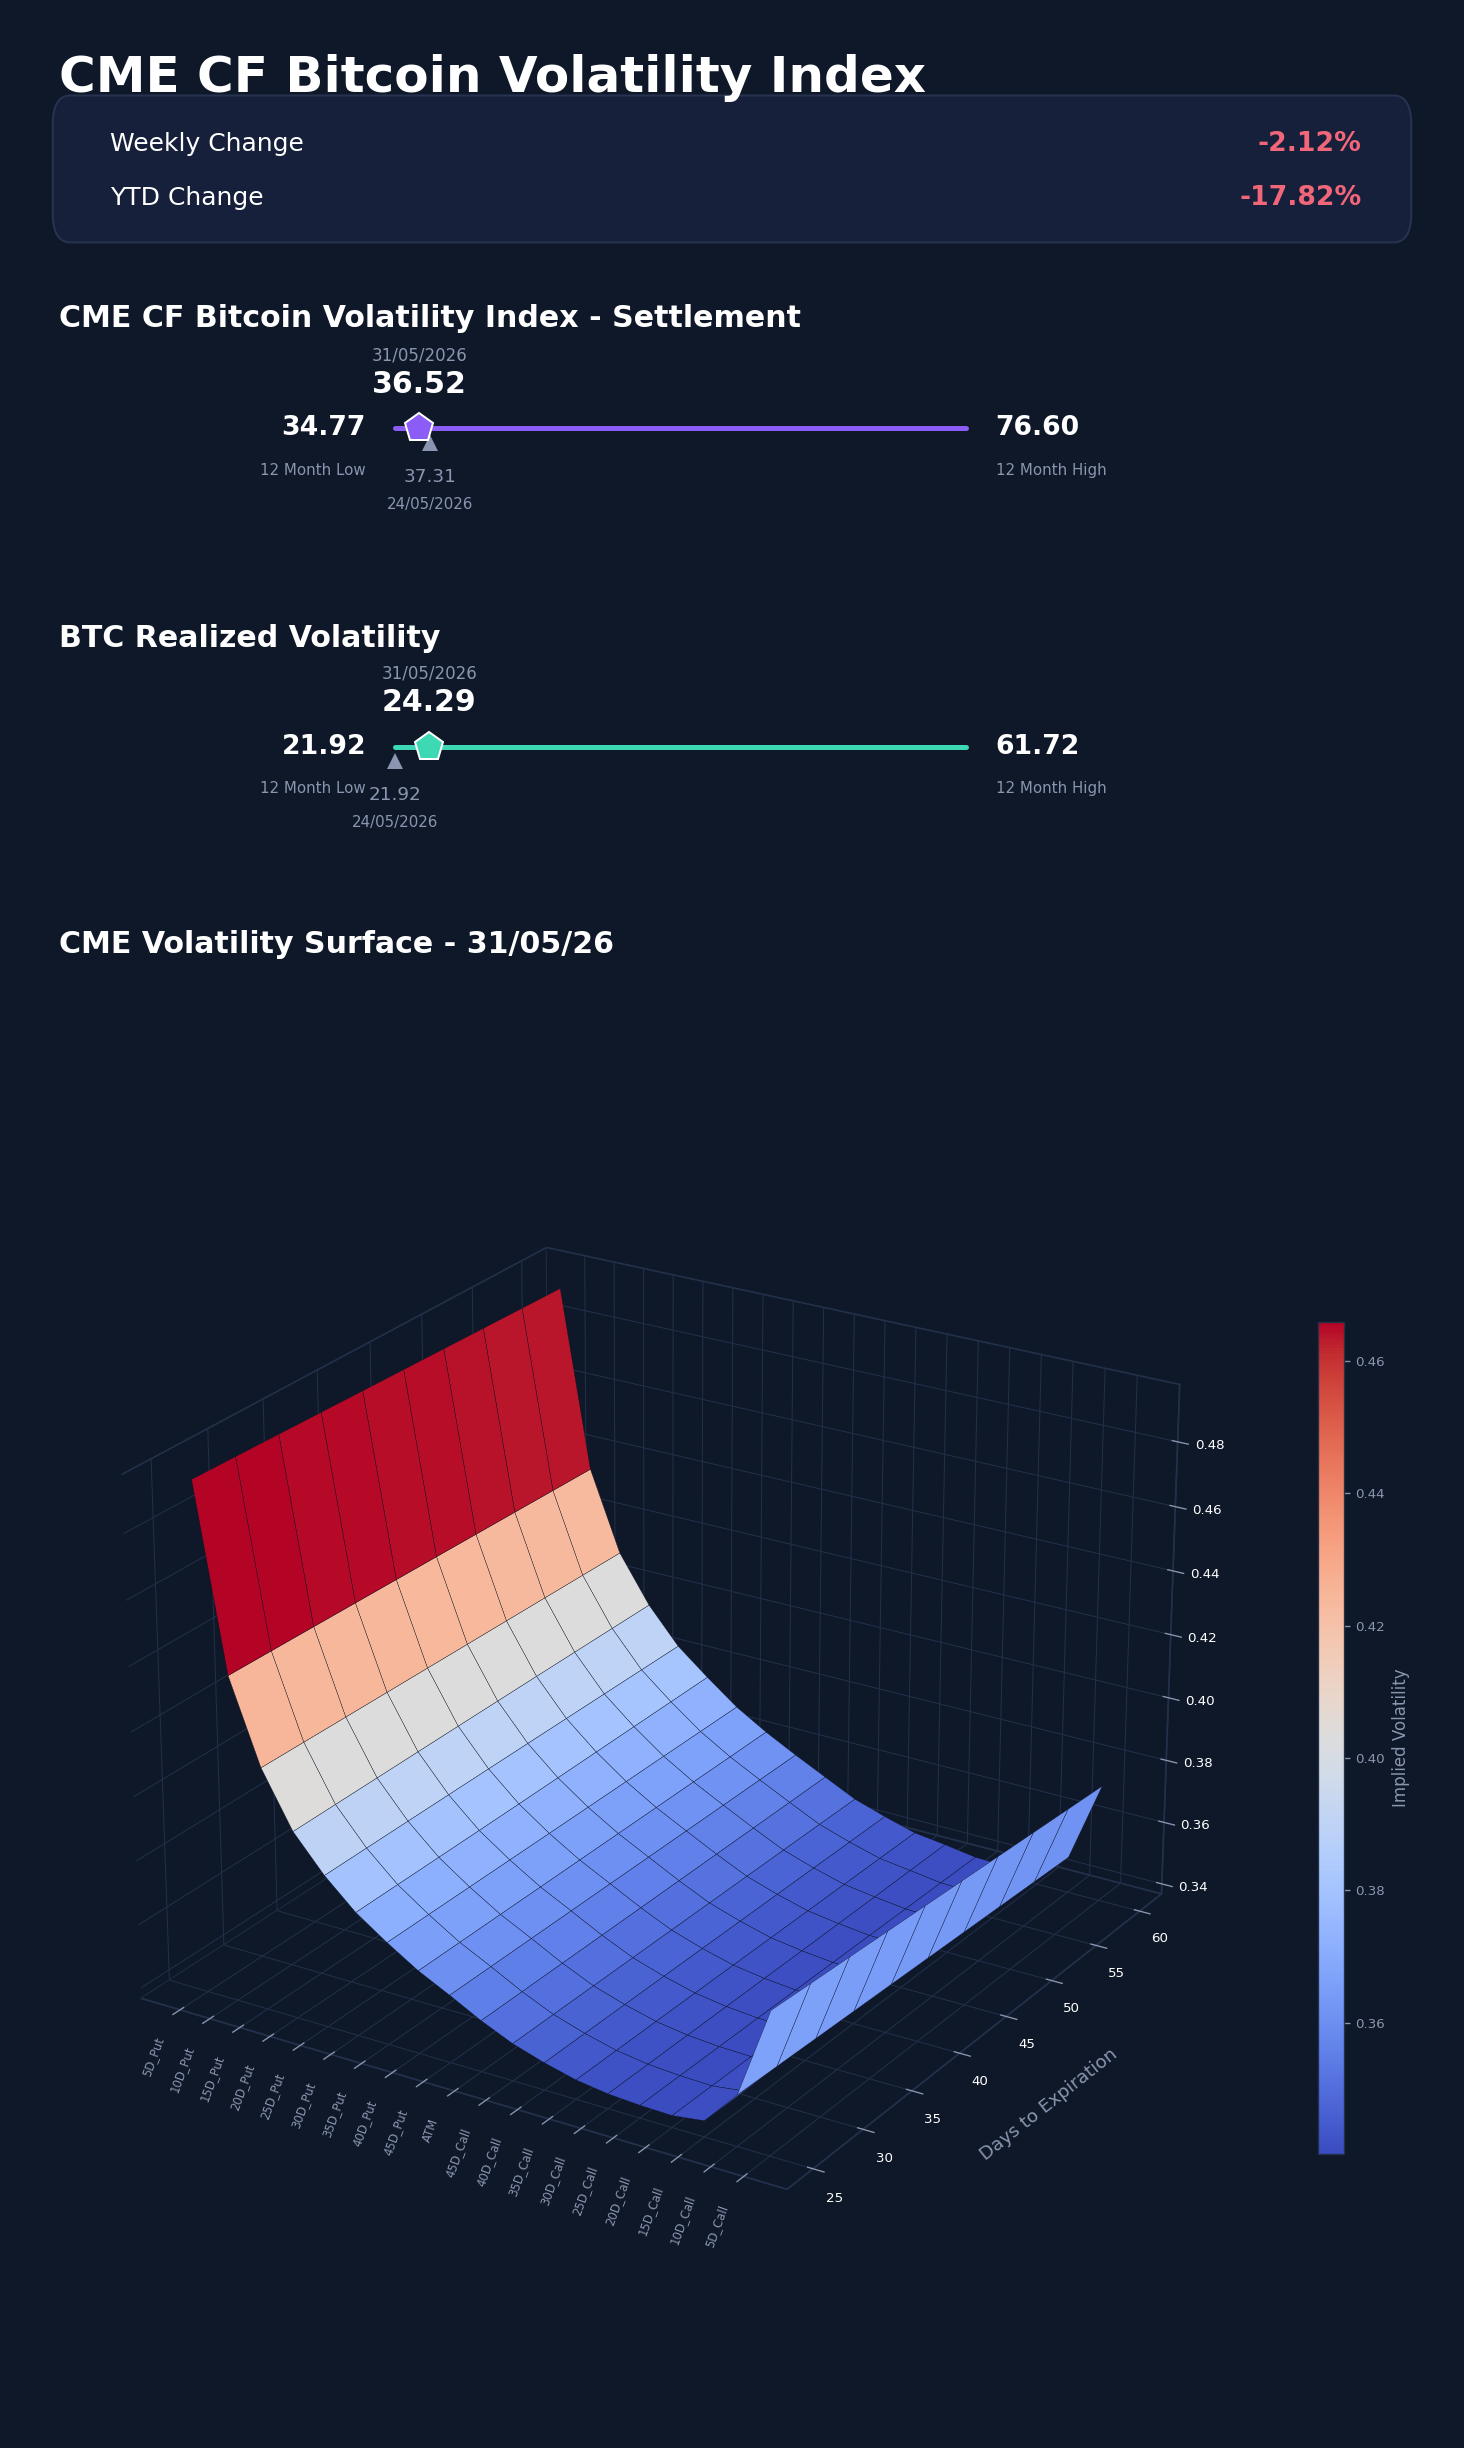
The volatility surface sent the week's most instructive signal, and it was a measured one. Our CME CF Bitcoin Volatility Index Settlement value (BVXS) eased to 36.52, down 0.79 vol. points on the week from 37.31, even as spot fell broadly. Implied volatility briefly pushed to an intra-week high of 38.45 before settling back. Realized volatility moved the other way, rising 2.37 vol. points to 24.29 from a level of 21.92 that had marked its trailing 12-month low. The key reading is in the gap between the two: the implied-to-realized cushion compressed from 15.39 vol. points a week earlier to 12.23, as realized caught up and implied edged lower. A market in genuine distress bids implied volatility aggressively; here, implied actually fell while realized did the rising. That configuration is consistent with orderly de-risking and a degree of hedging fatigue, not panic. With BVXS still 7.92 vol. points below its 44.44 start-of-year reference and only 1.75 points above its 12-month low, the options market is not pricing this selloff as a regime change. The interpolated implied-vol surface tells the same story across the smile and term structure: at the front tenors, 5-delta puts were bid near 49% against an at-the-money level around 35% and 5-delta calls near 38%, a persistent downside skew that points to hedging demand rather than a scramble for upside convexity.
Market Cap Index Performance
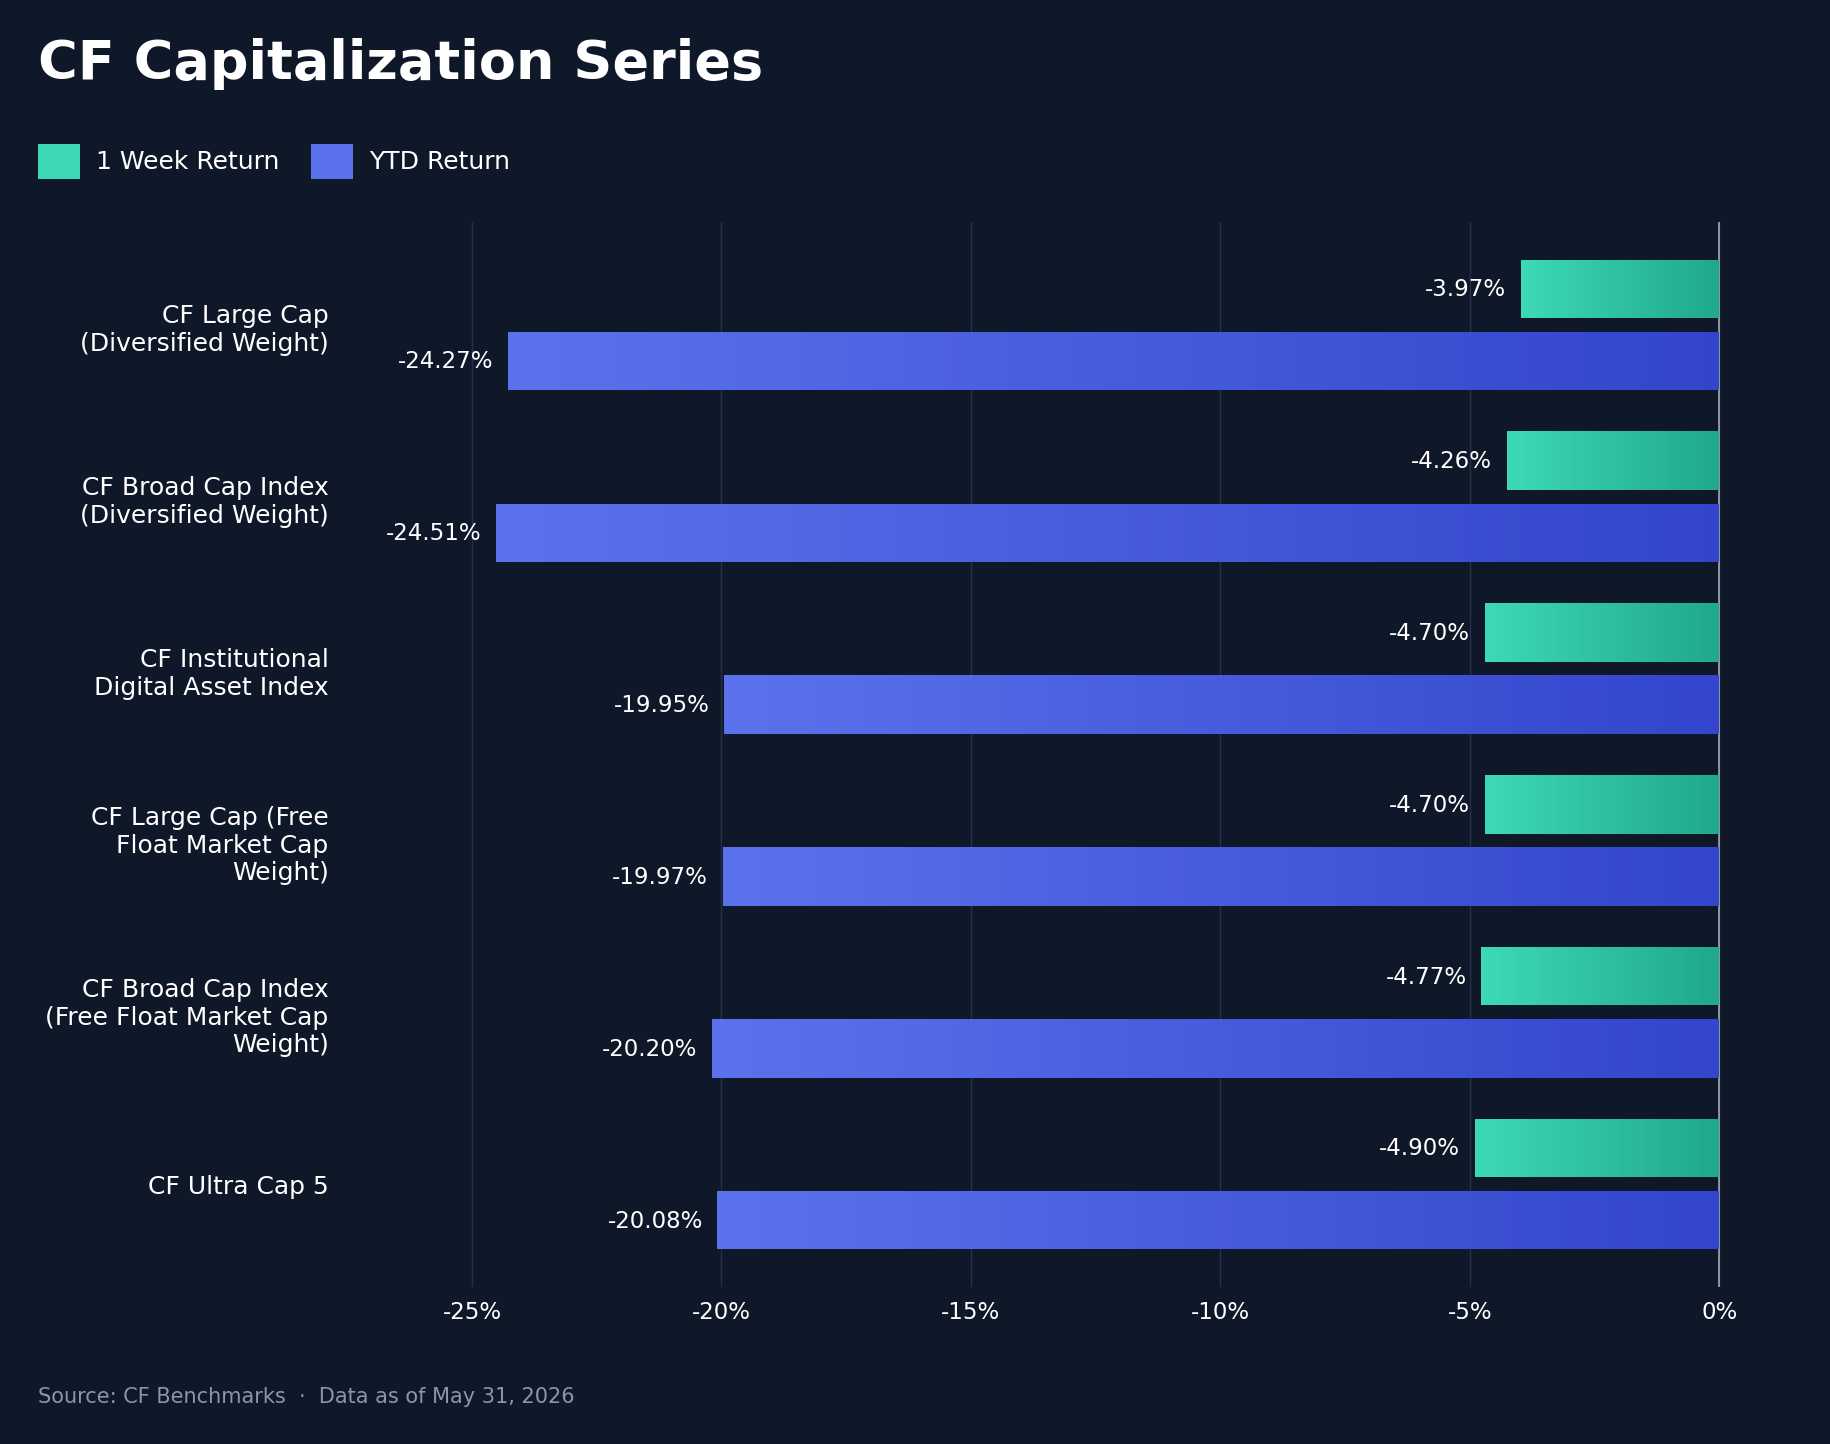
The CF Capitalization Series confirmed both the breadth and the orderliness of the selloff. All six indices fell within a remarkably tight 0.92 pp band. The diversified-weighted indices held up marginally better: CF Large Cap (Diversified Weight) led with -3.97% and CF Broad Cap Index (Diversified Weight) followed at -4.26%, while the free-float-weighted counterparts lagged, with CF Large Cap (Free Float Market Cap Weight) at -4.70% and CF Broad Cap Index (Free Float Market Cap Weight) at -4.77%. CF Ultra Cap 5 brought up the rear at -4.90% and the CF Institutional Digital Asset Index fell -4.70%. The diversified-over-free-float edge of roughly 0.5 to 0.7 pp this week is the mirror image of the YTD picture, where the free-float, mega-cap-concentrated indices are down about 20% against roughly 24% for the diversified sleeves. In other words, the breadth that weighed on diversified strategies all year offered them a small cushion this week. We would not over-read a sub-1-pp dispersion, but the pattern is consistent with the factor and single-asset evidence: this was an index-level de-risking in which the weighting scheme mattered far less than simply being long.
Factor Analysis
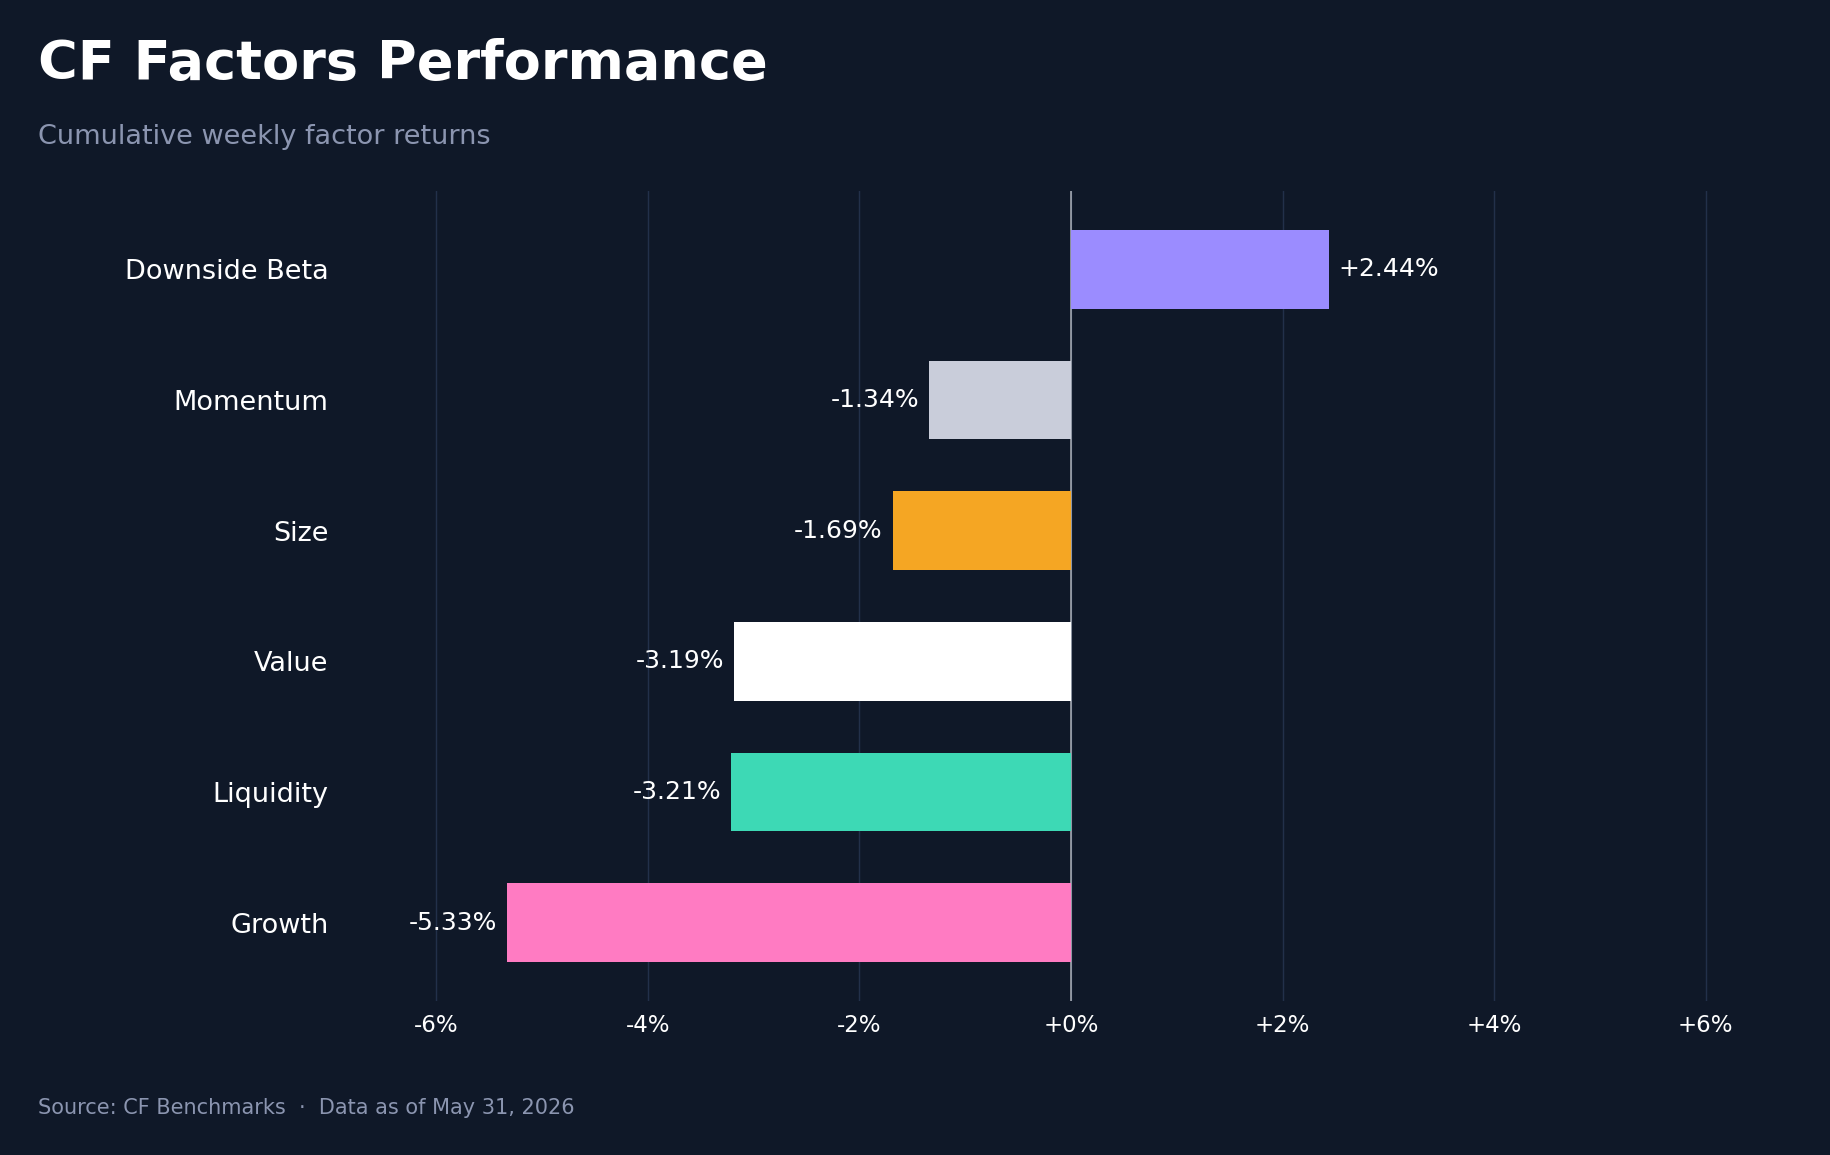
The factor complex is where the week's defensive character was unmistakable. Using CF cumulative weekly factor returns, Downside Beta was the standout, gaining 2.4% and inverting from -2.8% the week before, a 5.2 pp swing that put defense at the top of the leaderboard. Everything pro-cyclical rolled over. Momentum fell to -1.3% from 3.3%, a 4.6 pp reversal, and Value dropped to -3.2% from 2.0%, the largest single swing at 5.2 pp. Size softened to -1.7% from 0.9%, Liquidity slipped to -3.2%, and Growth remained the clear laggard, deepening to -5.3%. The w/w range across the six factors widened to 7.77 pp. The rotation is textbook risk-off: investors paid up for low-beta, defensive exposure and abandoned the momentum and value trades that had led the prior week. When last week's winners become this week's worst performers and defense leads, the market is de-grossing, not repositioning for the next leg higher.
Read our latest weekly crypto factors report: Factor Friday - May 22, 2026
Classification Series Analysis
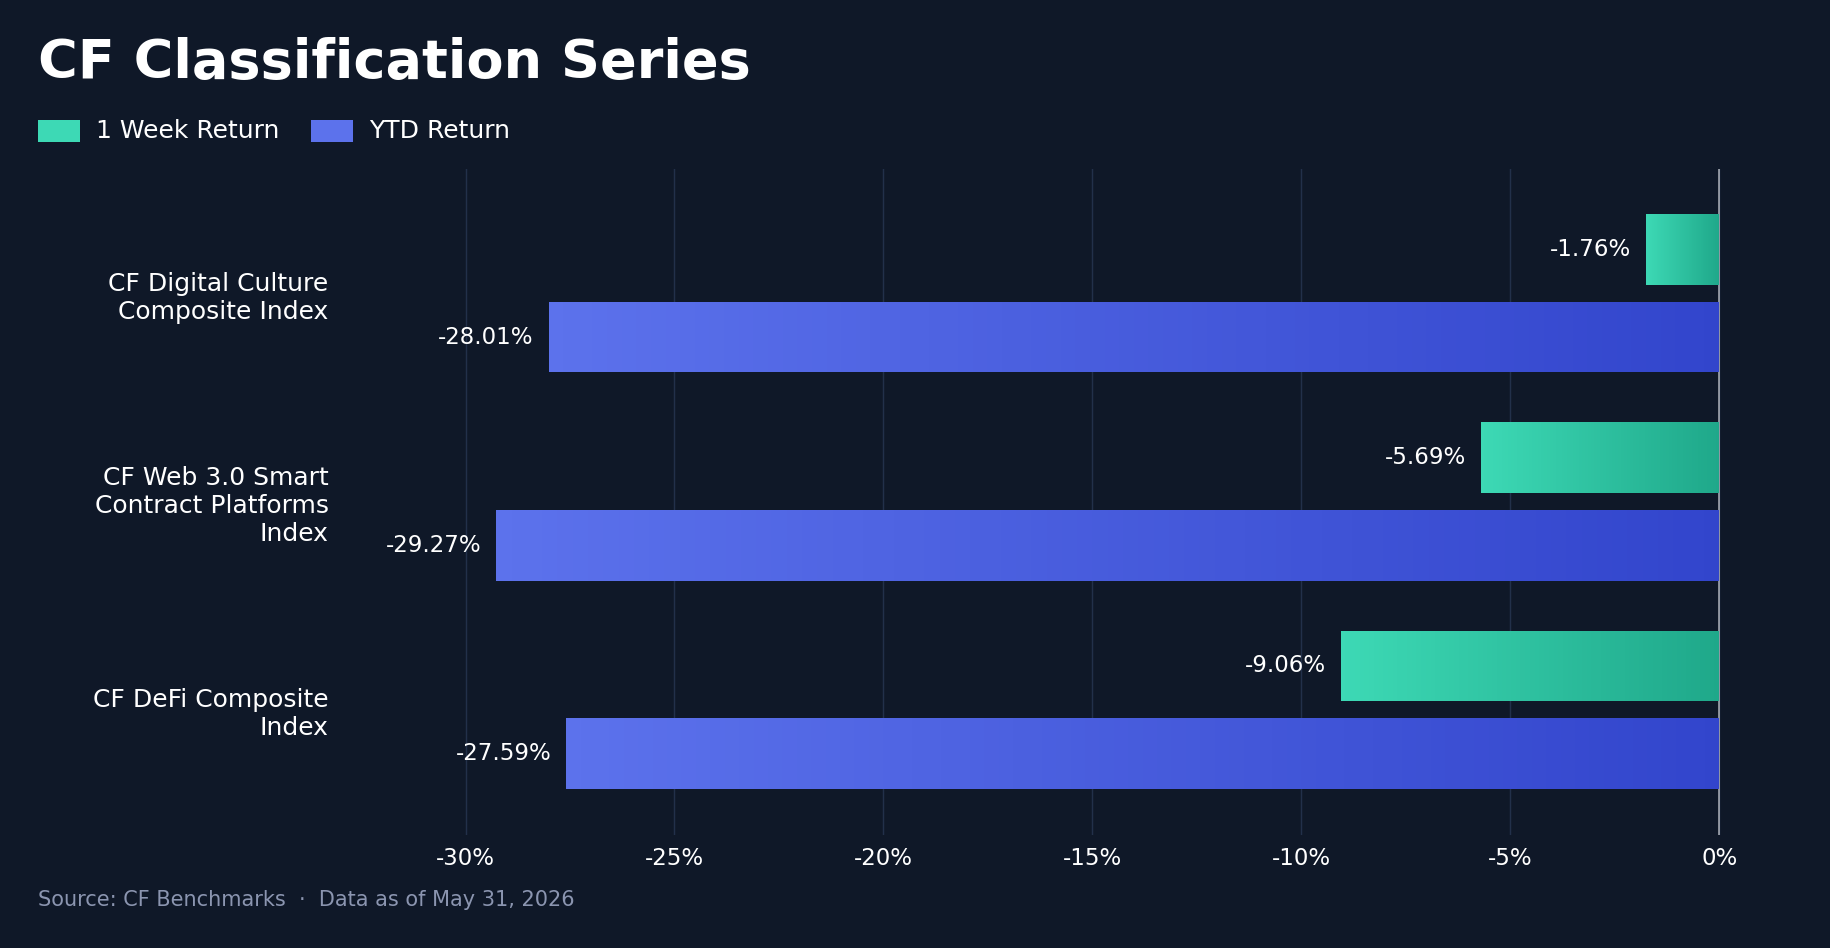
Across the CF Classification Series, thematic exposure moved into positive territory, with returns of 0.7% to 5.6% after the prior week's -10.9% to -8.7% drawdown. The CF DeFi Composite Index led at +5.6% w/w (YTD -22.3%), followed by the CF Web 3.0 Smart Contract Platforms Index at +2.2% (YTD -26.4%) and the CF Digital Culture Composite Index at +0.7% (YTD -28.9%). DeFi outperformed Web 3.0 platforms by 3.5 pp and Culture by 4.9 pp on the week, with Web 3.0 sitting 1.5 pp ahead of Culture. The current-week range of 4.9 pp was substantially wider than the prior week's 2.2 pp band, driven by DeFi's outperformance, and sat well clear of BTC's -0.1% w/w move, a 5.8 pp spread between DeFi and the mega-cap anchor. YTD drawdowns from -22.3% to -28.9% show that the recovery remained incomplete across all three composites, though DeFi's relative lead has reduced its YTD loss to the shallowest of the group.
Sector Analysis
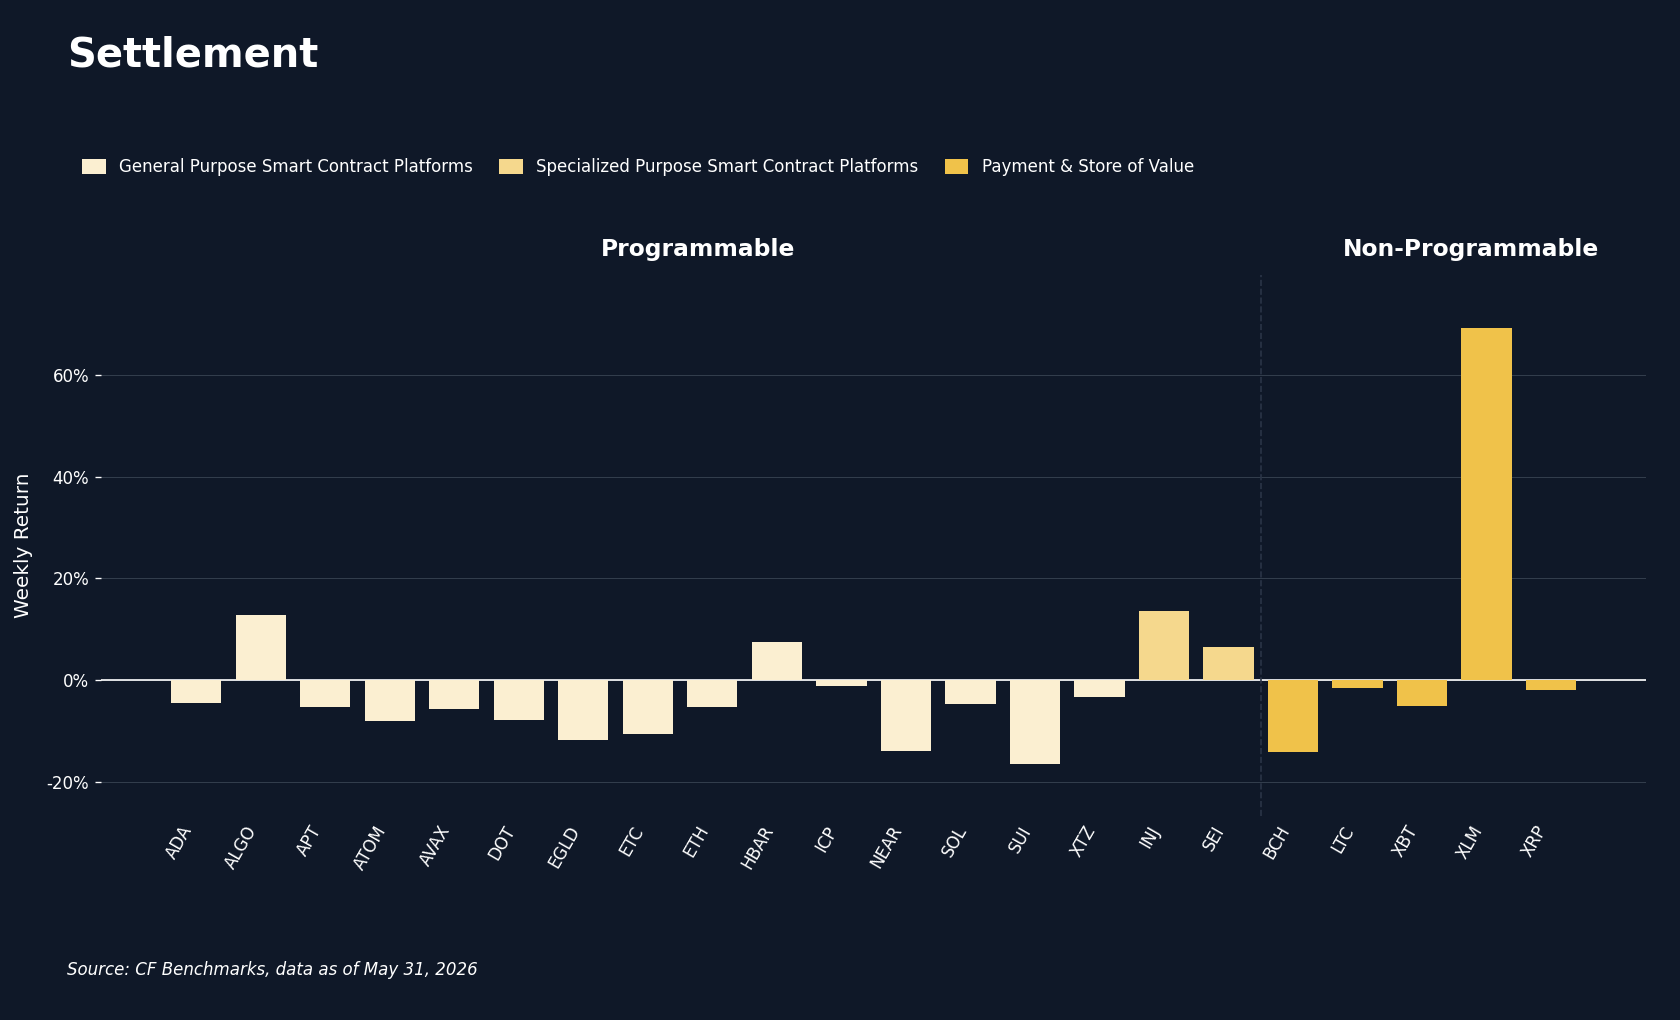
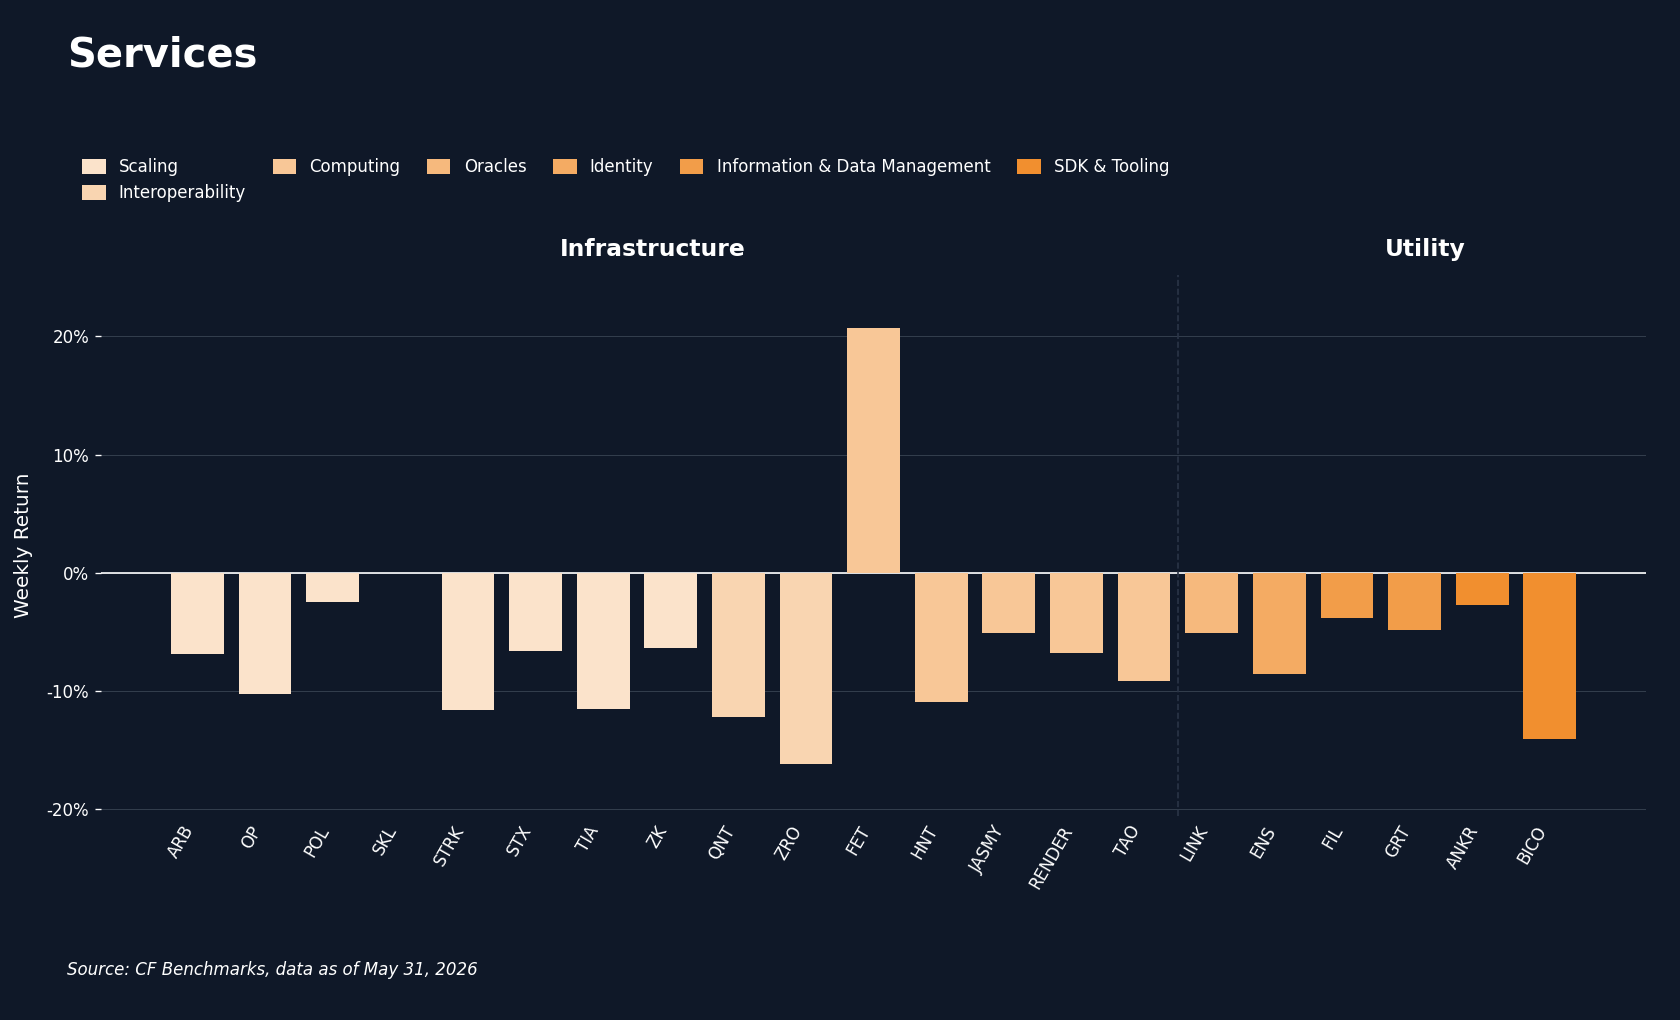
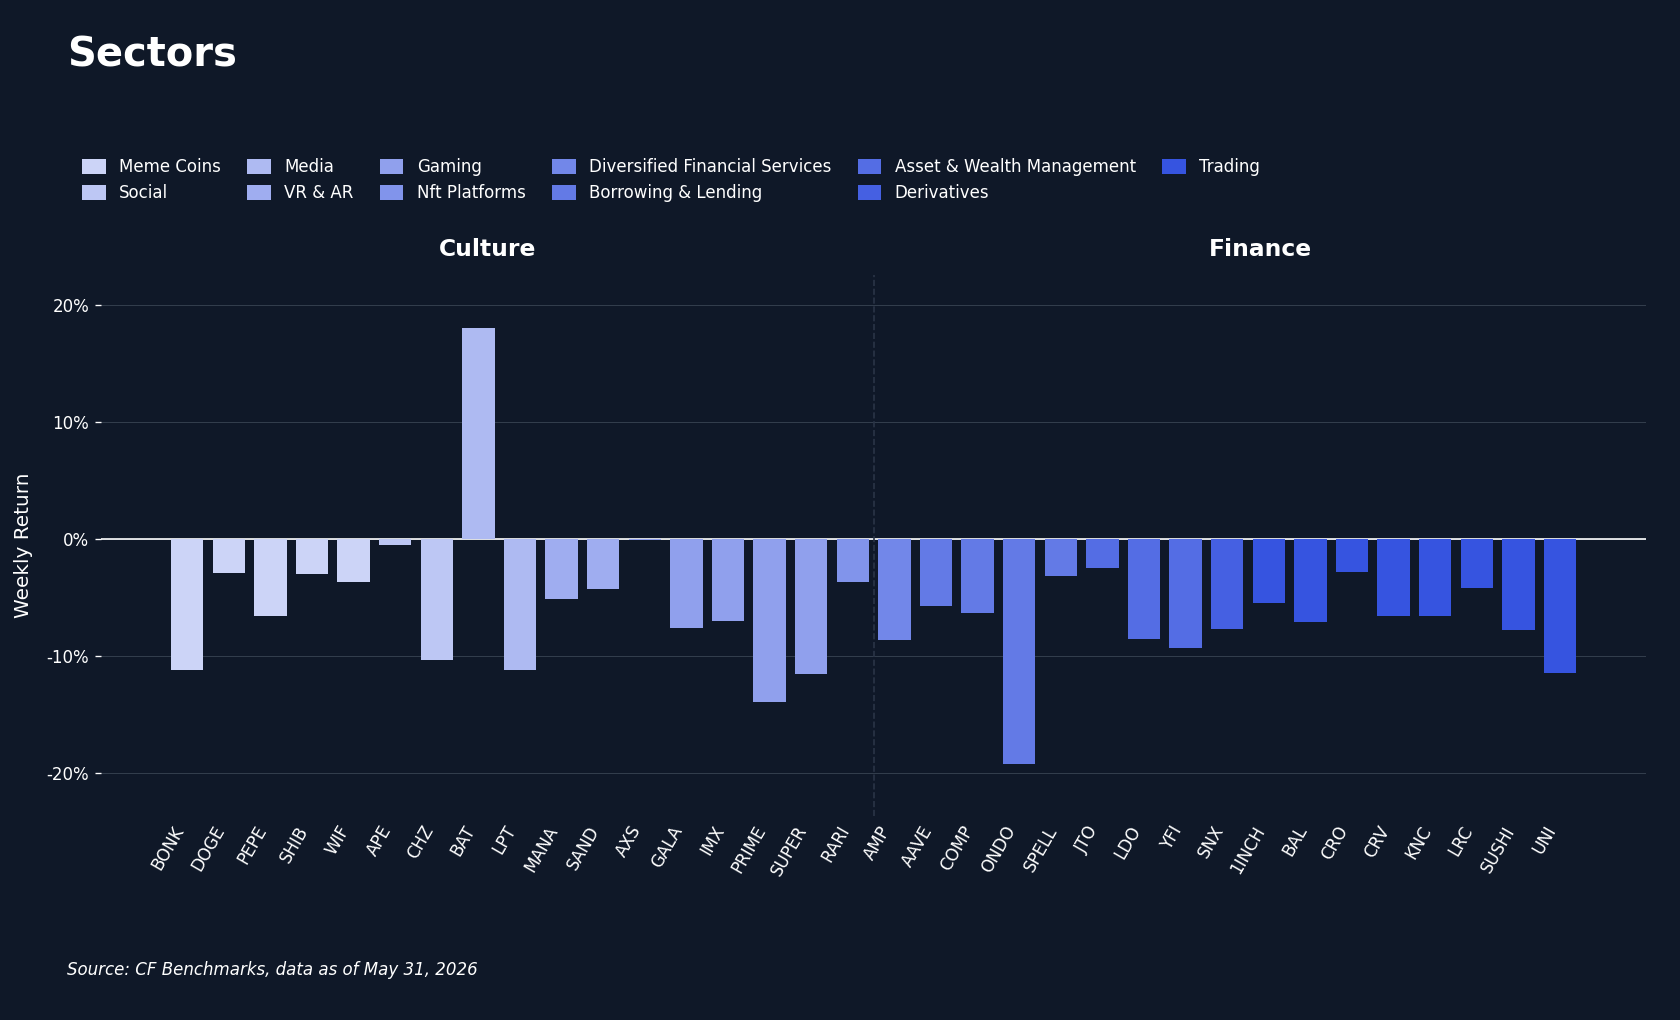
The CF DACS Sub-Categories require a careful read this week, because a single outlier distorts the headline. Non-Programmable posted a 9.3% average, but that figure is almost entirely the work of Stellar (XLM), which surged 69.4%; strip XLM out and the sub-category averaged -5.7%, in line with the rest of the tape. Beneath that artifact, the ranking was uniformly negative: Programmable -3.4%, Culture -5.0%, Infrastructure -6.4%, Utility -6.5%, and Finance the clear laggard at -7.3%. Finance bore the brunt of the DeFi stress, dragged by Ondo (ONDO) at -19.2%, Uniswap (UNI) at -11.5%, and Yearn Finance (YFI) at -9.3%. Outside XLM, the week's gainers were a narrow, idiosyncratic set: Fetch.ai (FET) at 20.7%, Basic Attention Token (BAT) at 18.1%, Injective (INJ) at 13.7%, and Algorand (ALGO) at 12.8%. The widest constituent spread in the complex ran an extraordinary 88.58 pp, from XLM's 69.4% to ONDO's -19.2%. The signal beneath the dispersion is clear: outside a few single-name stories, selling was broad, and it was deepest where leverage and DeFi exposure concentrate.
CF Staking Series
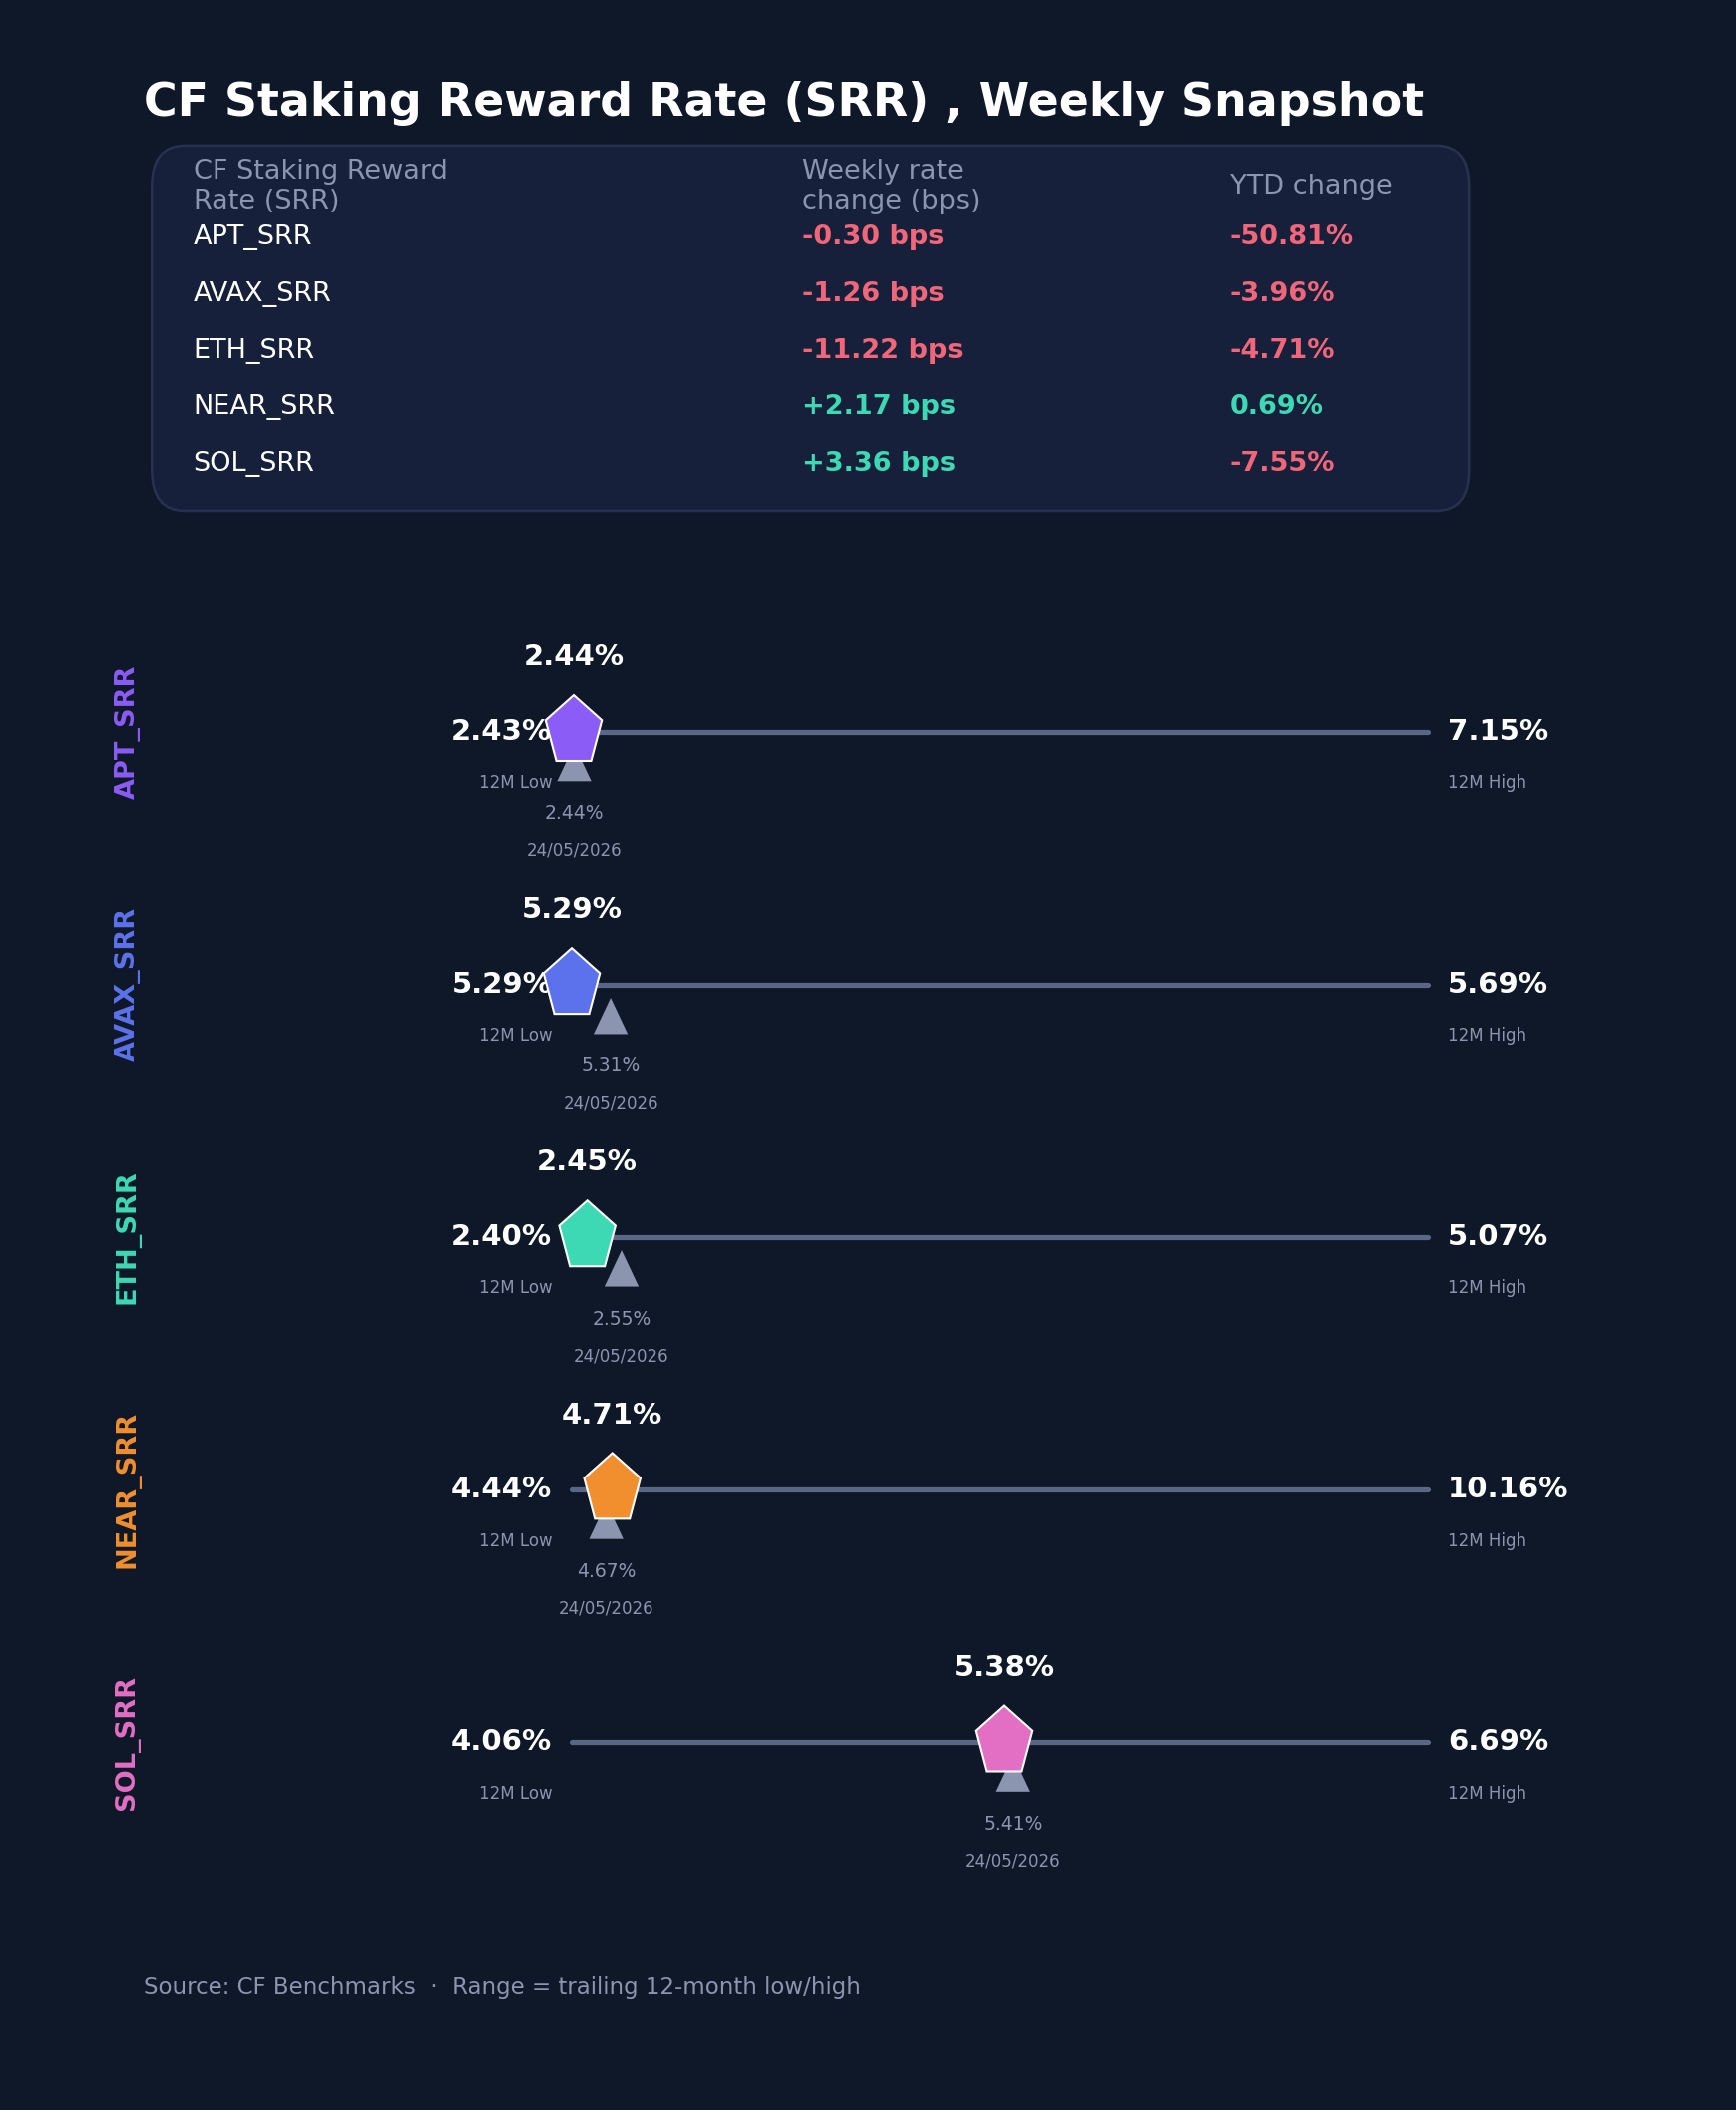
The CF Staking Series echoed the spot tape, with Ether the weak point. The CF Staking ETH (Ether) index fell -4.4% on the week, by far the worst of the five, while CF Staking SOL (Solana) gained 0.6% and CF Staking NEAR (Near) added 0.5%, and CF Staking APT (Aptos) at -0.1% and CF Staking AVAX (Avalanche) at -0.2% were little changed. Reward rates told a consistent story. Ether's reward rate fell 11.22 bps to 2.4474%, the largest move in the set, as validator economics softened alongside the price; Solana's rose 3.36 bps to 5.3849% and Near's gained 2.17 bps to 4.7142%, while Aptos (down 0.30 bps to 2.4413%) and Avalanche (down 1.26 bps to 5.2941%) barely moved. The reward-rate range across the five remained wide at 294.4 bps, anchored by Solana and Avalanche near 5.3% at the top and Aptos and Ether around 2.44% at the bottom. The week's reward-rate moves spanned just 14.58 bps, so the staking story was less about yield and more about Ether's underperformance bleeding through to its staking index.
Interest Rate Analysis
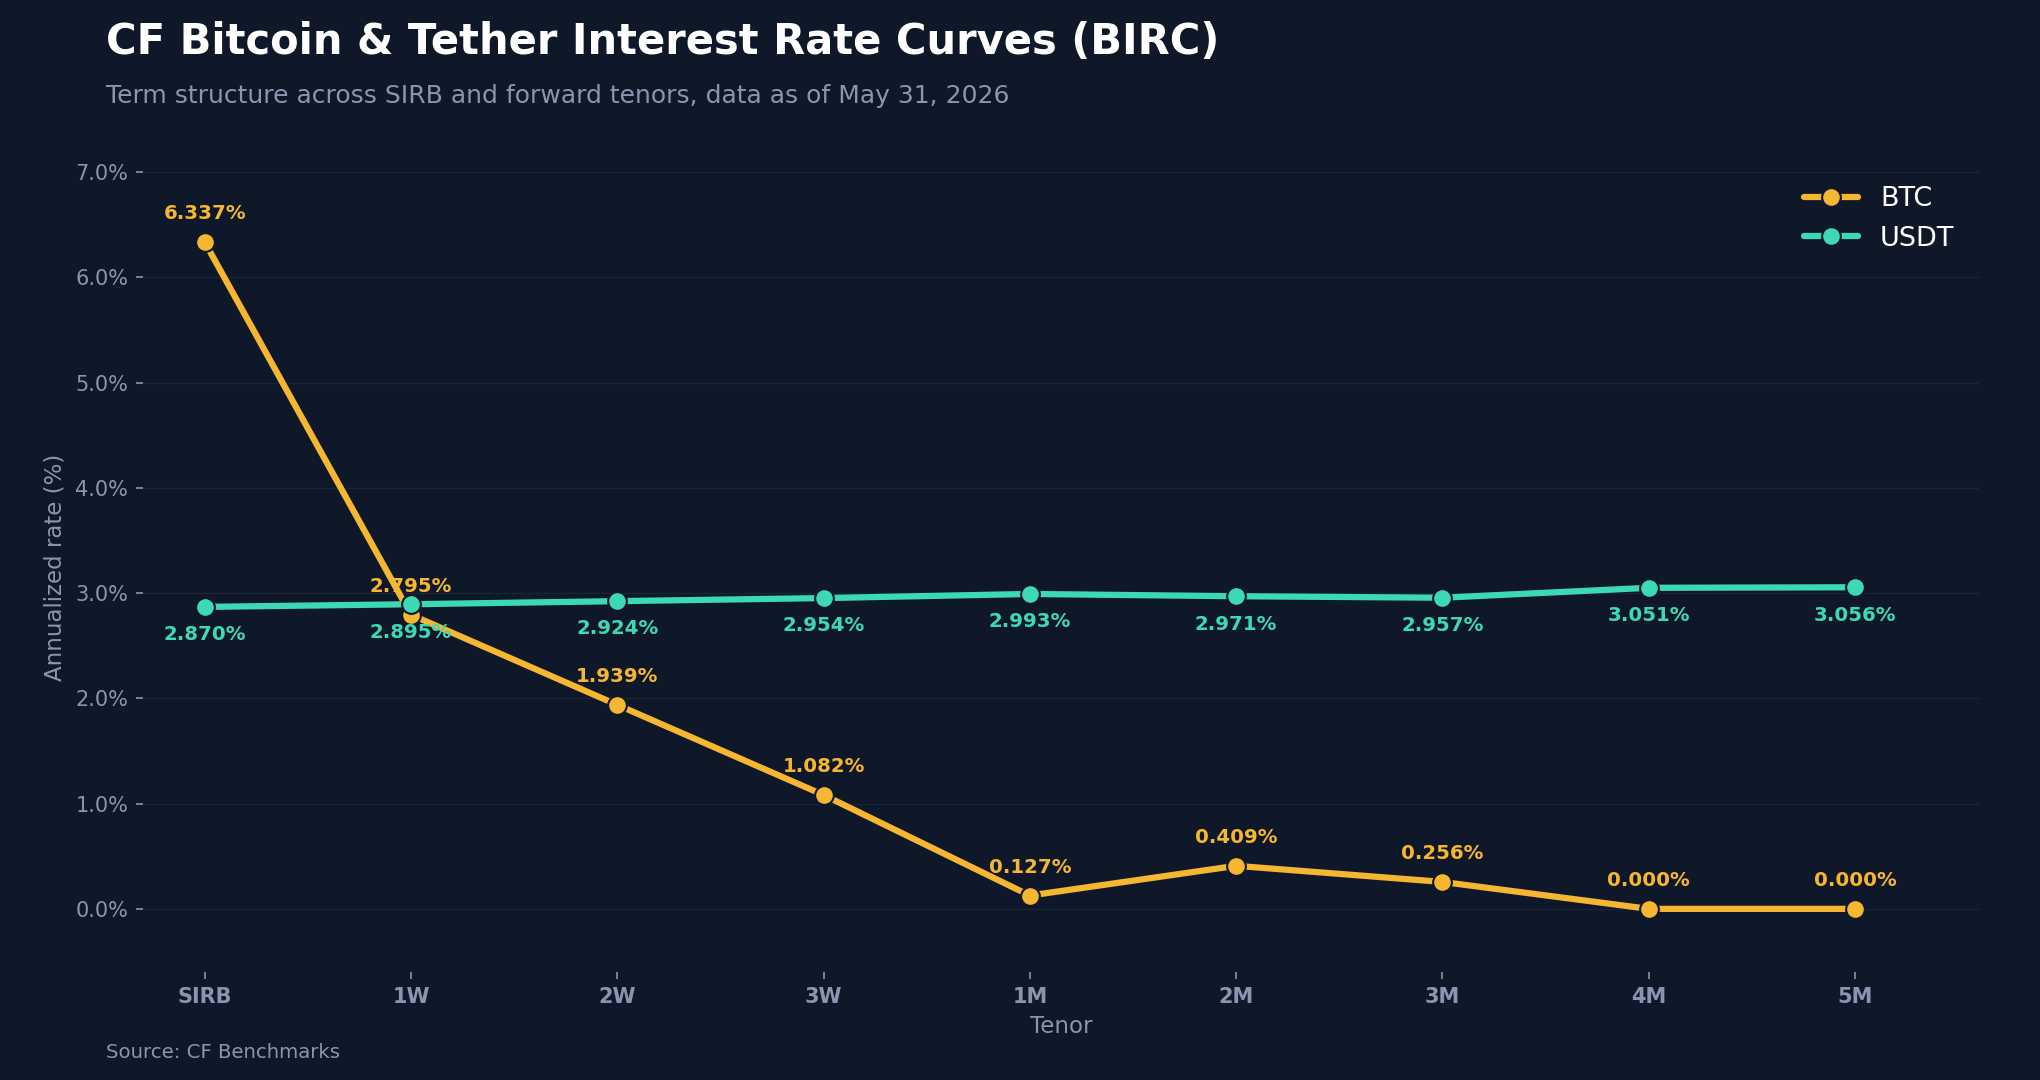
The CF Bitcoin and Tether Interest Rate Curves (BIRC) drew the cleanest line under the de-risking thesis, because the two curves moved in opposite characters. The CF USDT Interest Rate Curve eased in near-parallel fashion, falling between 28.5 bps at the SIRB and 35.6 bps at the 3-month tenor and leaving stablecoin funding in a tight 2.87% to 3.06% range across the term structure. The CF Bitcoin Interest Rate Curve, by contrast, was all about the front end. The Bitcoin SIRB collapsed 252.7 bps to 6.337%, yet the one-week tenor jumped 210.3 bps to 2.795%, the two-week rose 137.2 bps, and the three-week gained 63.5 bps, while the back end was little changed and sat near zero by the four to five-month tenors. That combination, a plunging overnight rate alongside sharply higher one-to-three-week rates, is a textbook front-end dislocation: a positioning unwind in spot and basis that whipsawed near-dated funding rather than a durable repricing of term carry. Across both curves, tenor changes ranged from -252.7 bps to 210.3 bps. The Bitcoin curve was the idiosyncratic one; USDT simply drifted lower with the broader easing in risk appetite.
Bottom Line
Pulling the threads together, the week reads as a controlled reduction of risk rather than a fracture. The evidence rhymes across every lens: a broad but compressed selloff in spot, a defensive factor rotation that lifted Downside Beta and sank last week's momentum and value leaders, theme-level stress concentrated in DeFi and Finance, implied volatility that fell while realized merely caught up off a 12-month low, and a Bitcoin funding curve whose front end unwound without dragging term carry with it. None of these are the fingerprints of capitulation; they are the marks of investors taking risk down deliberately and in order. What we are watching from here is whether realized volatility continues to close the gap to implied and whether the DeFi-specific weakness stays contained to its sector. On this week's data, the regime looks intact.
The information contained within is for educational and informational purposes ONLY. It is not intended nor should it be considered an invitation or inducement to buy or sell any of the underlying instruments cited including but not limited to cryptoassets, financial instruments or any instruments that reference any index provided by CF Benchmarks Ltd. This communication is not intended to persuade or incite you to buy or sell security or securities noted within. Any commentary provided is the opinion of the author and should not be considered a personalised recommendation. Please contact your financial adviser or professional before making an investment decision.
Note: Some of the underlying instruments cited within this material may be restricted to certain customer categories in certain jurisdictions.
Softer CPI Reprices July Hike Risk & Lifts Digital Assets
Digital assets extended their recovery over the past week as cooler US inflation prints repriced Fed expectations; the bid was broad across the large cap indices, growth factor leadership returned, stablecoin funding repriced lower, and stress stayed isolated in names hit by token-specific news.

Mark Pilipczuk
Notice of the Demising of CF Dai-Dollar Settlement Price and Spot Rate
The Administrator announces that it will demise the CF Dai-Dollar Settlement Price (DAIUSD_RR) and CF Dai-Dollar Spot Rate (DAIUSD_RTI) which are members of the CF Digital Asset Index Family.
CF Benchmarks
Addition of the Tether Gold Settlement Price and Spot Rate to the CF Digital Asset Index Family
The Administrator announces the addition of the Tether Gold Settlement Price and Spot Rate to the CF Digital Asset Index Family - Single Asset Series.
CF Benchmarks
By clicking Accept, you consent to CF Benchmarks's use of cookies.
Visit Cookie Settings to learn how CF Benchmarks uses cookies and to adjust your preferences.