
Sep 25, 2020
All the Ether you can trade
For CF Benchmarks, Ether supply is ‘case closed’ though #Supplygate rages on
The ‘Great Ether Supply Debate’ has become something of a moveable feast in crypto, and for good reason. Chiefly because it strikes at the very heart of Ether’s validity as a cryptocurrency asset, and in turn, a store of value.
First, a reminder.
Enter #Supplygate
- Certain idiosyncrasies of Ether mining and Ethereum protocols make working out how much Ether exists trickier than calculating the supply of other cryptocurrencies – like Bitcoin. The fact that Ethereum lacks anything like Bitcoin’s Unspent Transactions Output (UTXO) model is one example. The UTXO model helps make Bitcoin supply easier to determine than Ethereum supply
- These difficulties have been known for years but have largely been overlooked. Until, that is, the prominent Bitcoin evangelist Pierre Rochard provoked a colourful Twitter debate, reminding everyone that there is little agreement about the level of total Ether supply
- The tweets embedded below among hundreds of others - many tagged #supplygate - sum up the polarised nature of the discussion
Ethereum can’t even reconcile its ledger balances.
— PierreRochard.com (@pierre_rochard) August 15, 2020
How is it going to digitize the global economy?
- Rochard went as far as offering a nominal bounty to anyone able to resolve the quandary
- One computer scientist known on Twitter as @lastmjs recently reported “beyond reasonable doubt that the total amount of ETH issued up to and including block 9193265 (the last block of 2019) is 109,094,014.21823”. He went on to clarify that “The total amount of ETH issued is different than the total supply”
- Although it appears progress has been made, to date, the wider ‘project’ has yet to achieve its ultimate aim. Even if it ever does, consensus on an ultimate supply number looks almost impossible
- As such, whilst appearing to limit the scope of the discussion to Ether’s total circulating supply, Rochard continues to assert that the unknown quantity of Ether undermines confidence in the asset, and by extension, other cryptocurrencies as well
Into the Ether
So, as far as #supplygate goes, you can take your pick: you can look at it as an academic problem: possibly involving theoretical mathematics, economics, or even ethical philosophy. Or, you can come at it from a markets point of view, as traders and investors do. The ‘Great Ethereum Supply Debate’ is all of these things and more, depending on your crypto use case.
But what if #supplygate wasn’t just a distant academic problem, or a slightly less distant investment or trading issue that might (or might not) come back to bite you, X years down the line? What if your very existence depended on finding a practical answer to the question of how much Ether exists? Perhaps that might be an overstatement for most, but for CF Benchmarks it’s uncomfortably close to reality.
At CF Benchmarks, our raison d'être is to construct and administer cryptocurrency price indices and market benchmarks of the highest integrity, to a standard that consistently reaches though is not limited to regulatory imperatives. The means by which we have achieved and continue to achieve that goal include methodologies that support replicability, manipulation resistance, stringent exchange criteria and second-by-second price calculation, among others. So, if there’s a problem in determining exactly how much Ether exists, it is very much our problem. If that could potentially prevent us from determining the market capitalisation of Ether to a standard that we deem to be accurate enough, then to us, #supplygate could be a serious threat.
Ethereal solutions
So, how do we neutralise that threat? Well first, we recognise that the available data is the only resource available to anyone looking to resolve #supplygate. Yes, that is a recognition that there are limitations on resolving the dispute in an absolute sense any time soon. Certainly to the extent that any credible researcher would arrive at an identical level of circulating Ether supply as we have. Is that a cop out? At a very simple level, yes. But there is little about this topic that is simple.
More to the point, CF Benchmarks’ ‘use case’ is quite unique and highly specific. It is largely informed by the goal of maintaining replicable data integrity and transparency, as mentioned earlier. That is why we have demarcated a multi-tiered definition of ‘supply’ and having done that, why we admit only a fraction of crypto market activity into our pricing methodology.
That’s not to say that we sidestep the byzantine conditionality of the supply problem. On the contrary, whilst #supplygate has only recently acquired a label, it’s a puzzle that CF Benchmarks has worked on for years. Also, our solution has been driven by our own team of talented, dedicated computer scientists. Still, it’s fair to say that like much of the crypto sphere, up until recently, we mostly overlooked the uniqueness of this issue. We simply treated it as one of many crypto conundrums we had to deal with.
Broken blockchain family
This article isn’t the place for a full-blown exposition of structural blockchain mechanics, so we’ll begin by boiling our explanation right down to the bare bones. The crux of the conundrum revolves around two idiosyncrasies of blockchain engineering; two distinct block types in fact: orphan blocks and uncle blocks. As the child-like diagram in Figure 1 indicates, and the informal term suggests, orphan blocks (also known as stale blocks) stand apart from the blockchain.
Figure 1. - Simplified diagram showing how parent, orphan and uncle blocks exist on a blockchain 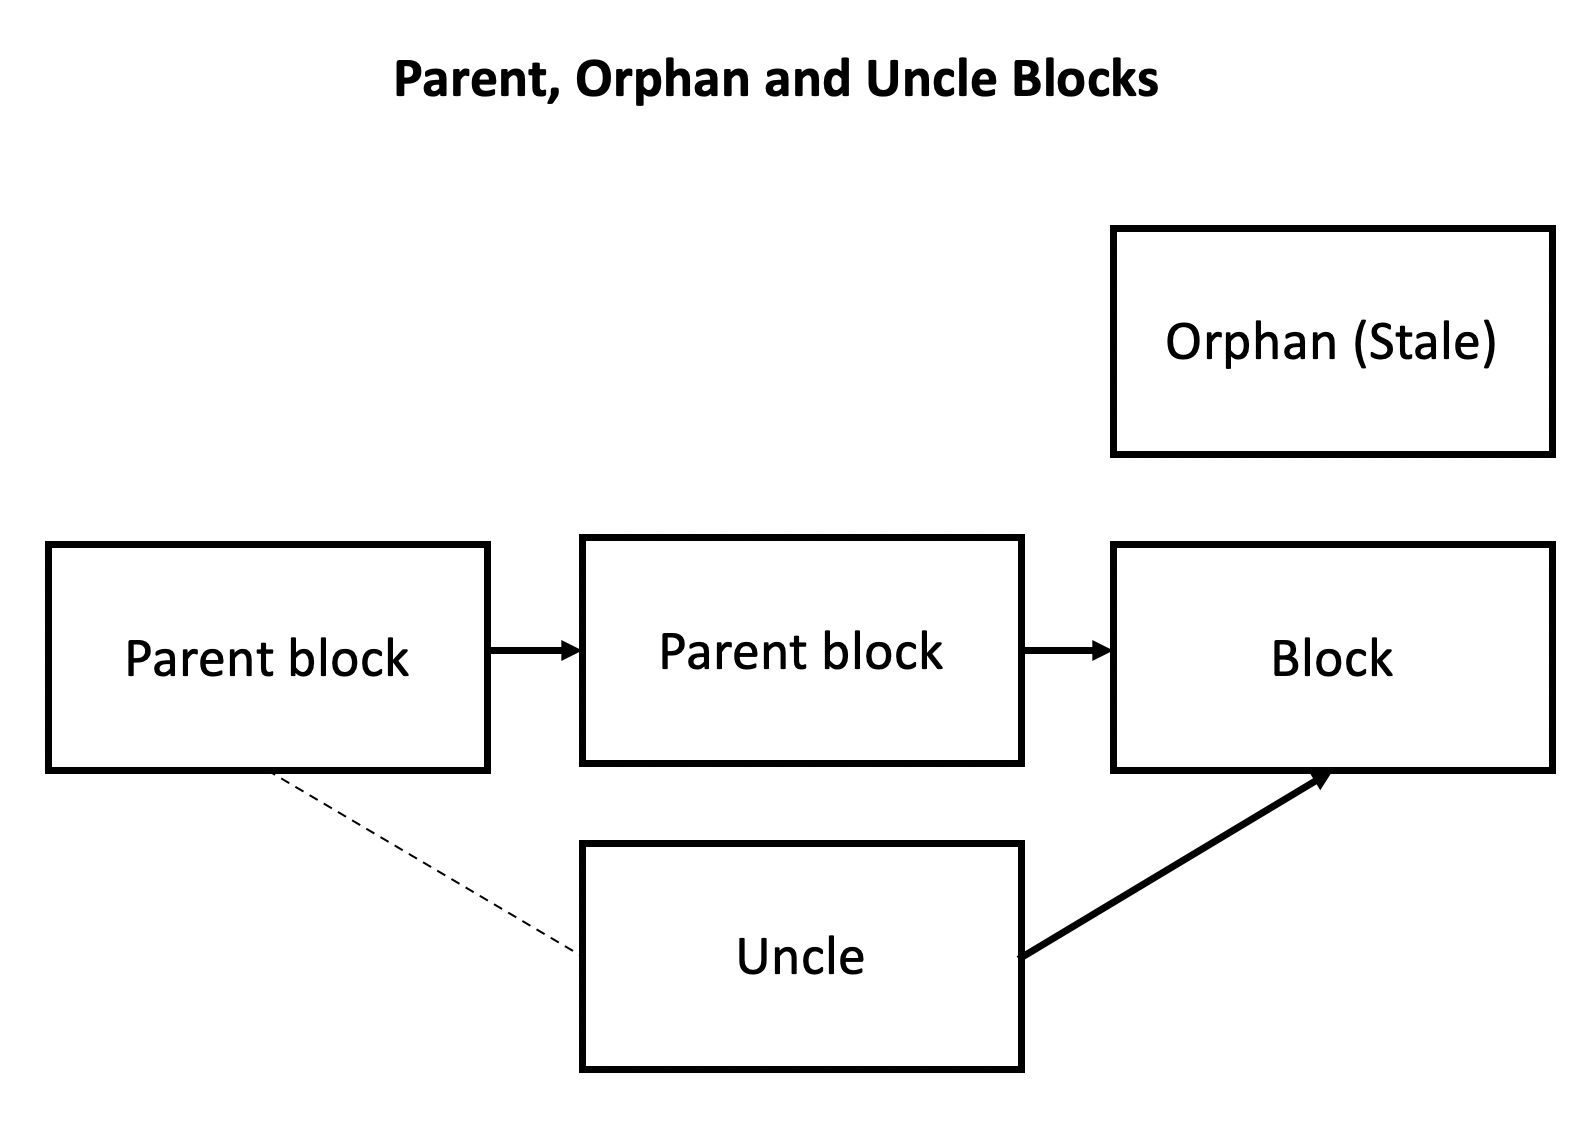
How orphans happen
It may surprise some to learn that orphan blocks have been validated and verified by proof-of-work just like ordinary parent blocks. However, they are not admissible to the blockchain due to those very same proof-of-work principles that can render some blocks redundant. Remember, all nodes in the ledger are not necessarily updated simultaneously whenever a new block is mined. Therefore, unbeknownst to the miner of an orphan block, another miner may have completed the solution to the mathematical equation inherent in a cryptographic proof-of-work whilst achieving a higher level on the proof-of-work’s ‘difficulty’ parameter. The miner achieving the higher difficulty level would then win the block reward. They would subsequently write the initial transaction on that block. Consequently, the block would be linked to the blockchain. Given that the miner of the orphaned block would receive no reward, there’d be no initial transaction and that block would remain isolated from the blockchain.
Block’s your uncle
Uncle blocks are similar to orphan blocks with some critical differences. Chiefly, they are only possible on the Ethereum blockchain. Unlike Bitcoin’s blockchain and those of other cryptocurrencies, the Ethereum protocol permits a reward for certain orphaned blocks, albeit a lower one than for blocks that successfully join the blockchain. Orphaned blocks that are nevertheless referenced by parent blocks are known as uncle blocks on the Ethereum blockchain. The fully admitted Ethereum block wins the miner a reward of 3 Ether, but the discoverer of an uncle block is only credited an eighth of the full reward. The rationale behind rewarding uncle miners is to incentivize them to continue mining. However, the proportionate reward for consecutively mined uncle blocks diminishes by a further 1/8th of the full reward per each consecutive uncle block mined. Therefore, while Ethereum uncle networks exist, the economics behind them are unattractive for miners, so they’re shallower than the main network.
Sizing up #supplygate
It should now be evident that there are several levels of determination required to calculate Ethereum’s total supply, just as there are several levels of determination required to calculate the total supply of all cryptocurrencies. However, there are factors that are germane to the methodology CF Benchmarks uses to compute Ethereum supply. These are italicized in the list below.
Categories of cryptocurrency supply
- Full Supply by Design
- Ether: excluding uncle rewards
- Ether: max possible, including uncle rewards
- Total Fungible Supply (TFS)
- Total Supply Likely to be Available for Trading (TSAT)
- Ether: TSAT=TFS-Ether held for long-term investment
- Full Capitalisation: Total Fungible Supply * Price
- Free Float Capitalisation: Total Supply Likely to be Available for Trading * Price
It's worth noting that whilst measures like Total Fungible Supply are widely standardised, Total Supply Likely to be Available for Trading is a refinement that has largely been configured by CF Benchmarks. (It makes sense that our model of circulating supply would be more stringent than most.)
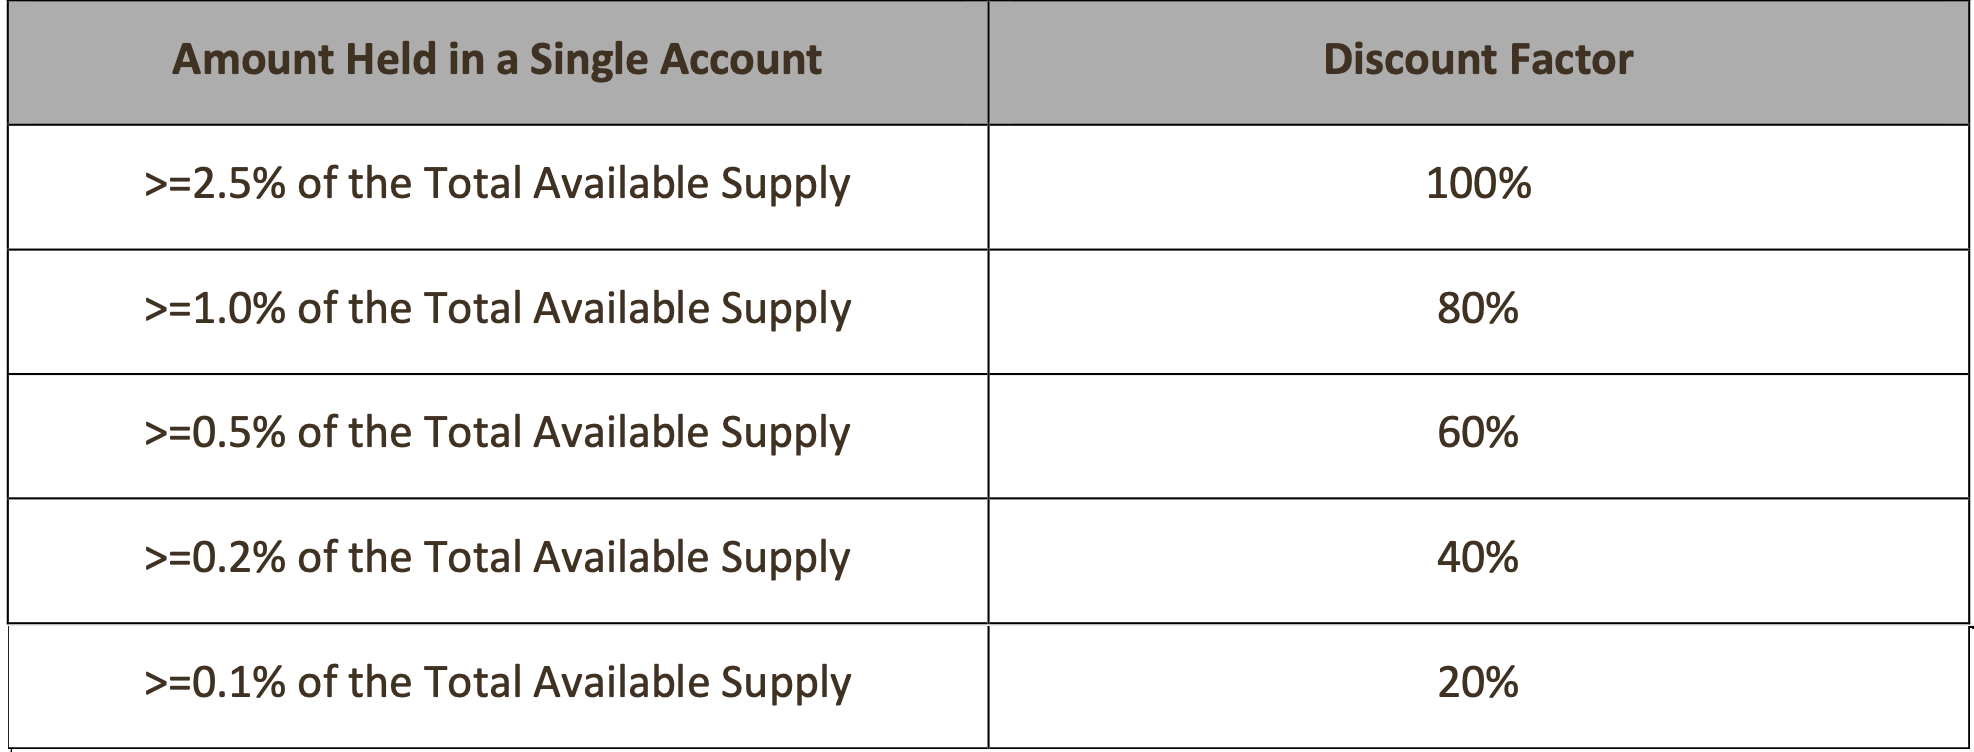
The TSAT rationale is predicated on the assumption that accounts holding large amounts of Ether are doing so for long-term investment or strategic purposes or may be locked or escrowed for other reasons. Our methodology therefore approximates the amount of Ether held by accounts for long-term investment purposes and similar, to better determine how much Ether is available for trading.
Accounts holding Ether for long-term investment purposes are defined by the scale in the table below. A corresponding discount factor is applied, depending on the proportion of Total Fungible Supply in the account. For example, if an account has 0.1% or more of Total Fungible Supply, the proportion is multiplied by 20% and the sum is deducted from Total Fungible Supply to determine Total Supply Likely to be Available for Trading.
Importantly, our discount model exempts accounts that are effectively ‘aggregations’ of a large number of owners, for instance those controlled by exchanges, or pooled balances under smart contracts.
Figure 2. - Discount factors applied to large Ether accounts
There's more
There are further stipulations, though we’ve limited our attention here to the ones most relevant to the matter at hand. In any case, as befits CF Benchmarks’ transparent policy, in line with the regulatory accreditation that underpins our status as an official Benchmark Administrator, anyone is free to check our working out for themselves. Relevant documentation can be found here.
We should also point out that all data published by CF Benchmarks have been subjected to numerous conditions to ensure accuracy. Consequently, CF Benchmarks’ conclusions as regards data are as replicable as its indices. All told, our solution to the Great Ether Supply Debate is pragmatic, serviceable and theoretically rigorous.
Is it the optimal solution for everyone involved in the debate? Unlikely. But we would expect our rendition to be among the best possible solutions – if not the best possible solution - given the data available. Finally, whilst results for a specific ‘snap date’ are published here, again, data for any date are available on request.
Figure 3 – Ether Total Supply and capitalisation as of 29th July 2020 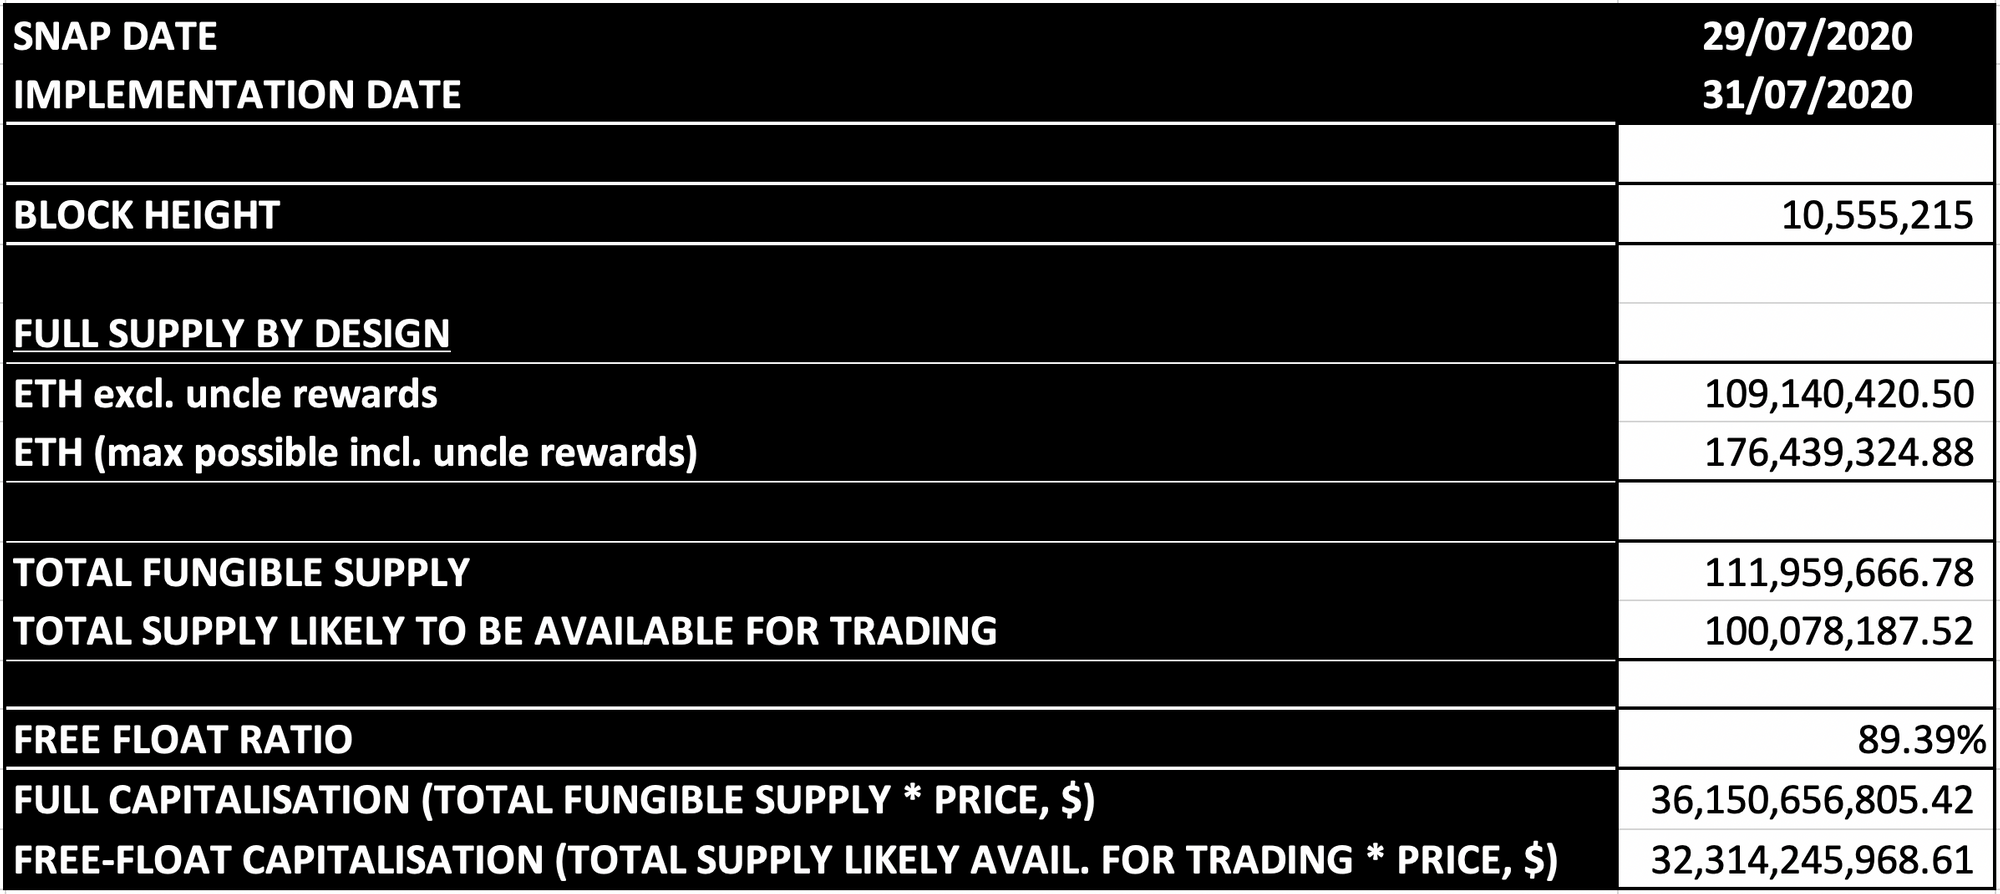 Source: CF Benchmarks
Unchained asymmetry
So, where does this exercise leave us? The key would be to compare our main conclusions on Ether supply with those of other researchers. But there’s the rub. The degree of disparity—instead of what ought to be, theoretically, a high degree of consensus—underscores the central contention of Ethereum blockchain critics.
In the end, the absence of consensus and empirical certainty about Ethereum’s total supply continues to contrast sharply with the lower level of equivocation about supply on other blockchains. Given the huge monetary value engendered by the Ethereum network—with a free-float capitalisation of more than $32bn at the end of July, by our calculations—the lack of supply consensus should be chilling.
For the moment, however, that lack of consensus barely seems to bother the majority of Ethereum participants. Whether or not such confidence will continue to be vindicated is perhaps a secondary point. The main one is that regardless of material risks there is a sufficient degree of consensus about Ethereum overall.
There’s evidently enough confidence in its protocols to prevent discordant supply views from destabilizing the entire project.
As with Ethereum’s myriad other risks, #supplygate could yet blow-up in its users’ faces at some point. As with many other ‘marketplaces’ though, the most powerful consensuses are social and tacit. That includes an agreement to avoid addressing central flaws, unless and until they cause an asset to implode!
The information contained within is for educational and informational purposes ONLY. It is not intended nor should it be considered an invitation or inducement to buy or sell any of the underlying instruments cited including but not limited to cryptoassets, financial instruments or any instruments that reference any index provided by CF Benchmarks Ltd. This communication is not intended to persuade or incite you to buy or sell security or securities noted within. Any commentary provided is the opinion of the author and should not be considered a personalised recommendation. Please contact your financial adviser or professional before making an investment decision.
Note: Some of the underlying instruments cited within this material may be restricted to certain customer categories in certain jurisdictions.
Factor Friday - May 22, 2026
The market pulled back hard at -5.65%, the worst weekly drop of 2026. Growth and Value were the only positive factors, with fundamentals leading during the drawdown. Downside Beta fell, deviating from its pattern of resilience in earlier drawdowns.

Mark Pilipczuk
Outcome of Consultation on Changes to the CME CF Bitcoin Volatility Index - Real Time Methodology
The Administrator can now confirm it will implement all proposed changes to the CME CF Bitcoin Volatility Index - Real Time methodology.
CF Benchmarks
UPDATE: xStocks-Owner Payward Added to DTCC Tokenization Task Force
Two recent moves by the Depository Trust & Clearing Corporation (DTCC) have compelling implications for the evolution of tokenized equities broadly, and potentially for xStocks.
Ken Odeluga
By clicking Accept, you consent to CF Benchmarks's use of cookies.
Visit Cookie Settings to learn how CF Benchmarks uses cookies and to adjust your preferences.