
Jun 22, 2026
Bitcoin Implied Volatility Holds Steady Despite Hawkish Fed
Weekly Index Highlights, June 22, 2026
This was a clean risk-off week with a single clear driver. The June 16th to 17th Federal Open Market Committee meeting, Chair Kevin Warsh's first, held the policy rate but published a Summary of Economic Projections that flipped the 2026 dot plot from a cut to a lean toward a hike, and the complex sold off across the board: Bitcoin (BTC) fell 3.72% and only Solana held its ground among the seven major single assets, which spanned a wide 14.27 percentage points. We read it as a macro-led repricing, not an internal rotation. A hawkish Fed and a hot May retail sales print lifted the 2-year Treasury yield about 16 basis points and pushed the dollar to a fresh 2026 high, and that front-end and dollar impulse hit beta uniformly. The one place the market spoke for itself was volatility: the CME CF Bitcoin Volatility Index Settlement (BVXS) barely moved while realized volatility rose into it, closing the implied cushion the prior week had kept open. The signal this week was the macro tightening the whole complex absorbed, alongside a volatility surface that stopped paying for protection just as realized vol caught up.
Market Performance Update
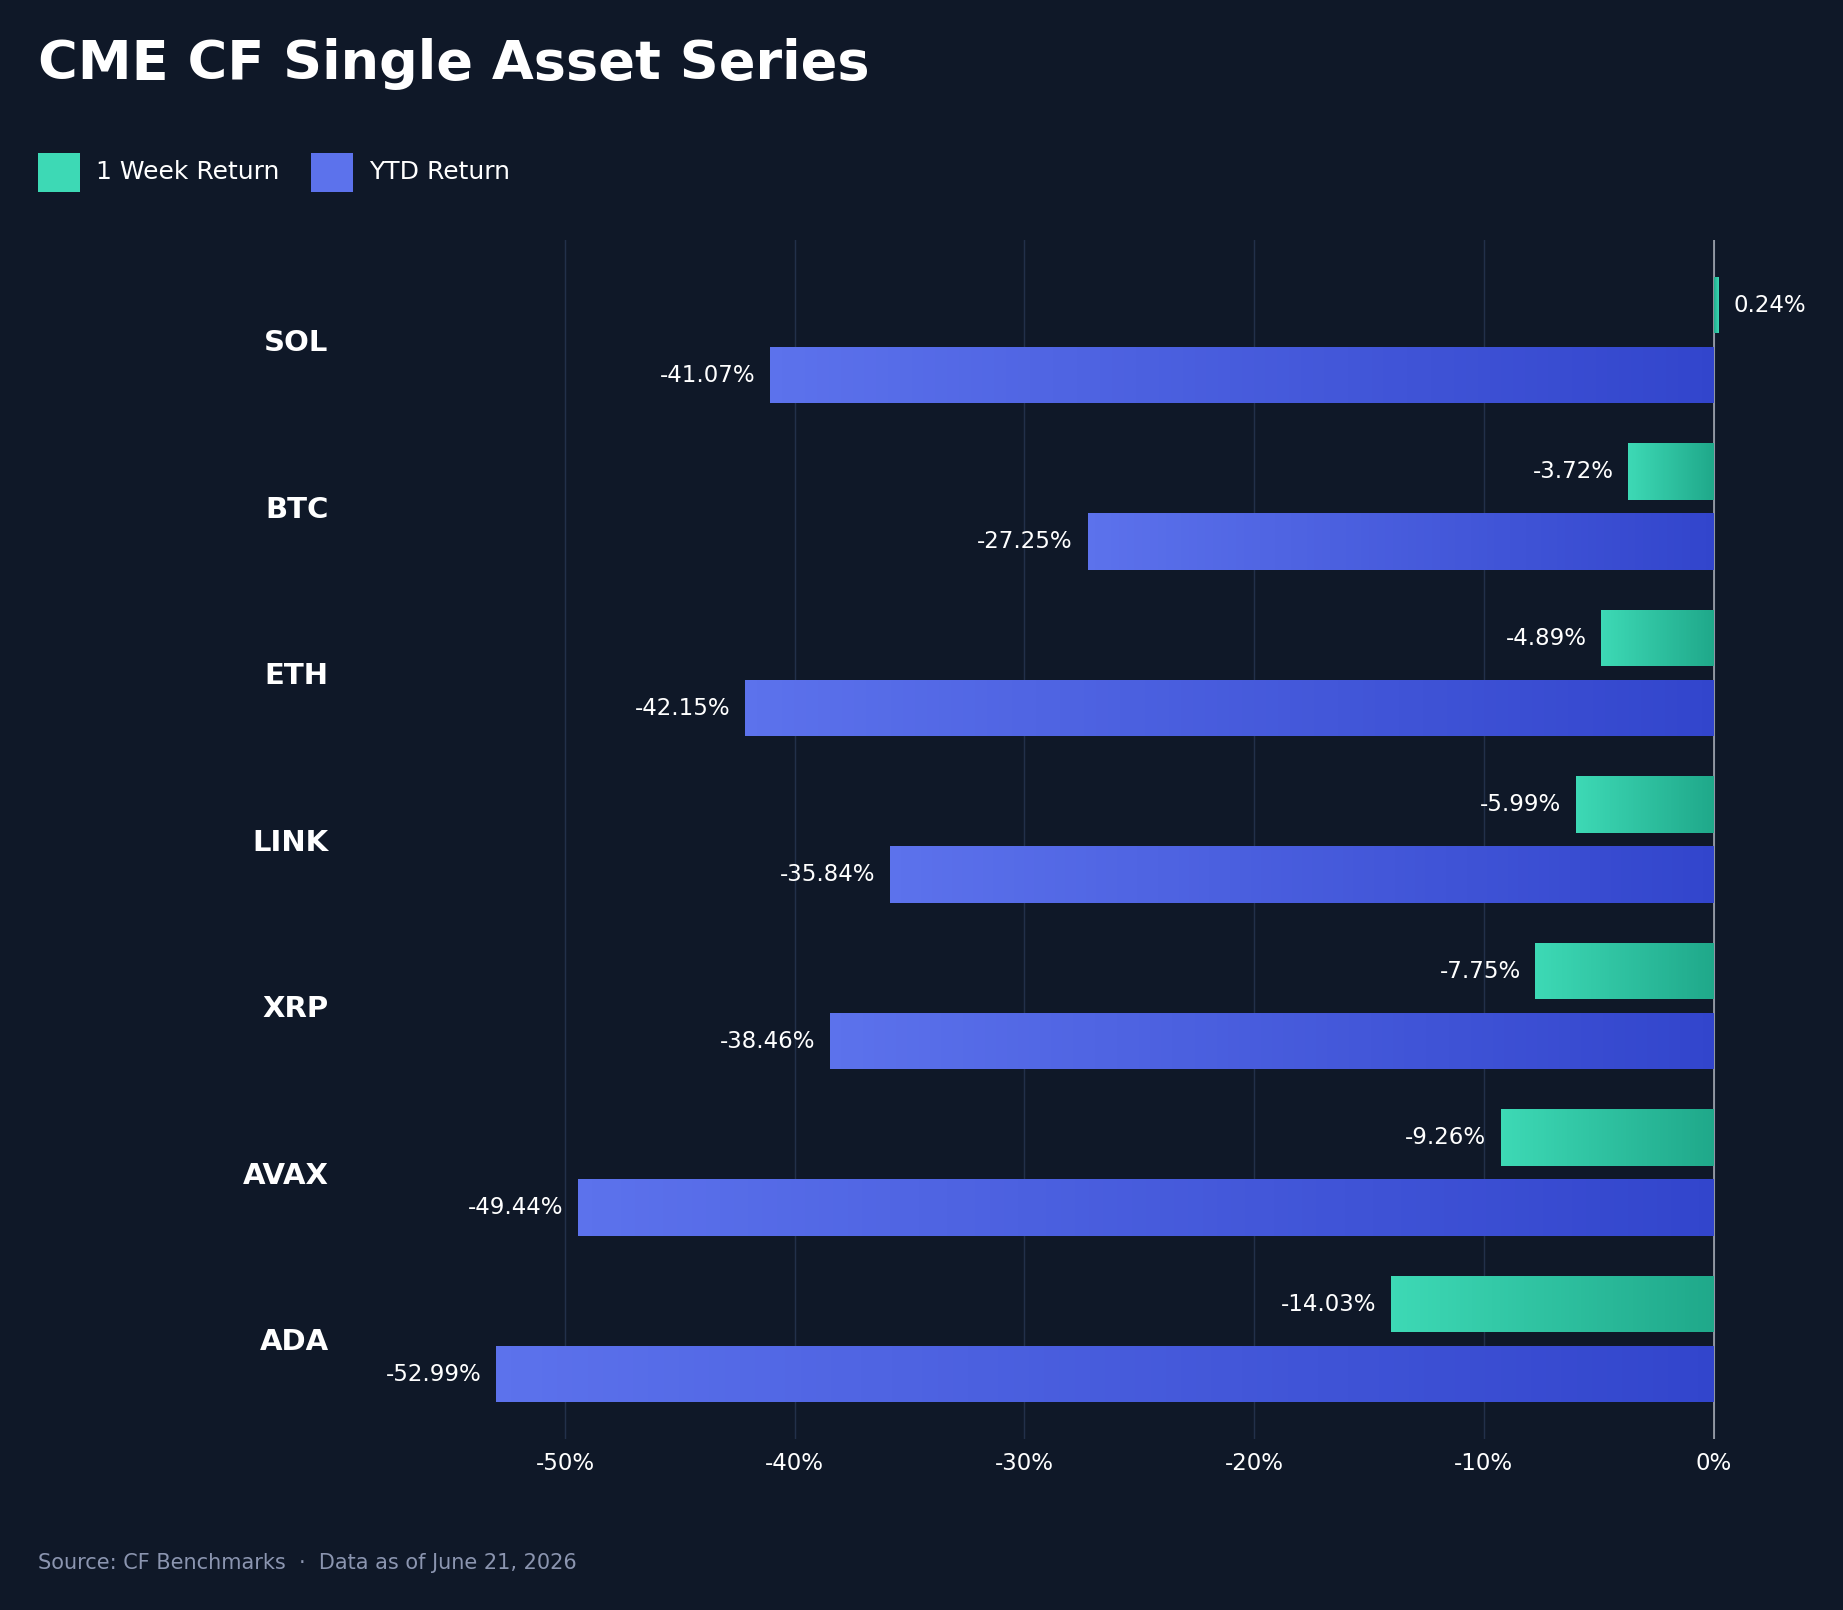
All of our CF Single Asset Series fell broadly over the June 15th to June 21st week, with only Solana (SOL) holding its ground at +0.24%; Bitcoin (BTC) lost 3.72%, Ether (ETH) 4.89%, Chainlink (LINK) 5.99%, XRP 7.75%, Avalanche (AVAX) 9.26% and Cardano (ADA) 14.03%, the worst of the set. The 14.27 percentage point (pp) spread between SOL and ADA was wide for a single down week and points to relatively higher-beta names absorbing the heaviest selling, with BTC's smaller 3.72% drawdown keeping mega-cap exposure at the defensive end. The week's framing came from Wednesday's Federal Open Market Committee (FOMC) meeting, Chair Kevin Warsh's first: the policy rate was held at 3.50% to 3.75%, but the Summary of Economic Projections moved the median 2026 dot to about 3.8% from 3.4% and removed the prior bias toward cuts, a hawkish surprise that lifted the 2-year Treasury yield roughly 16 basis points (bps) and carried the dollar index to a fresh 2026 high. BTC traded down about 2% to 4% in the session after the 2:00 pm decision, and a hot May retail sales print the same morning, +0.9% month over month against a +0.5% consensus, reinforced the move by pushing expected rate relief further out. No major decoupled from the rates-and-dollar tape. On a YTD basis the majors remain deeply underwater, from BTC's -27.25% to ADA's -52.99%. The complex traded the Fed, and the highest-beta names paid for it.
Volatility Analysis
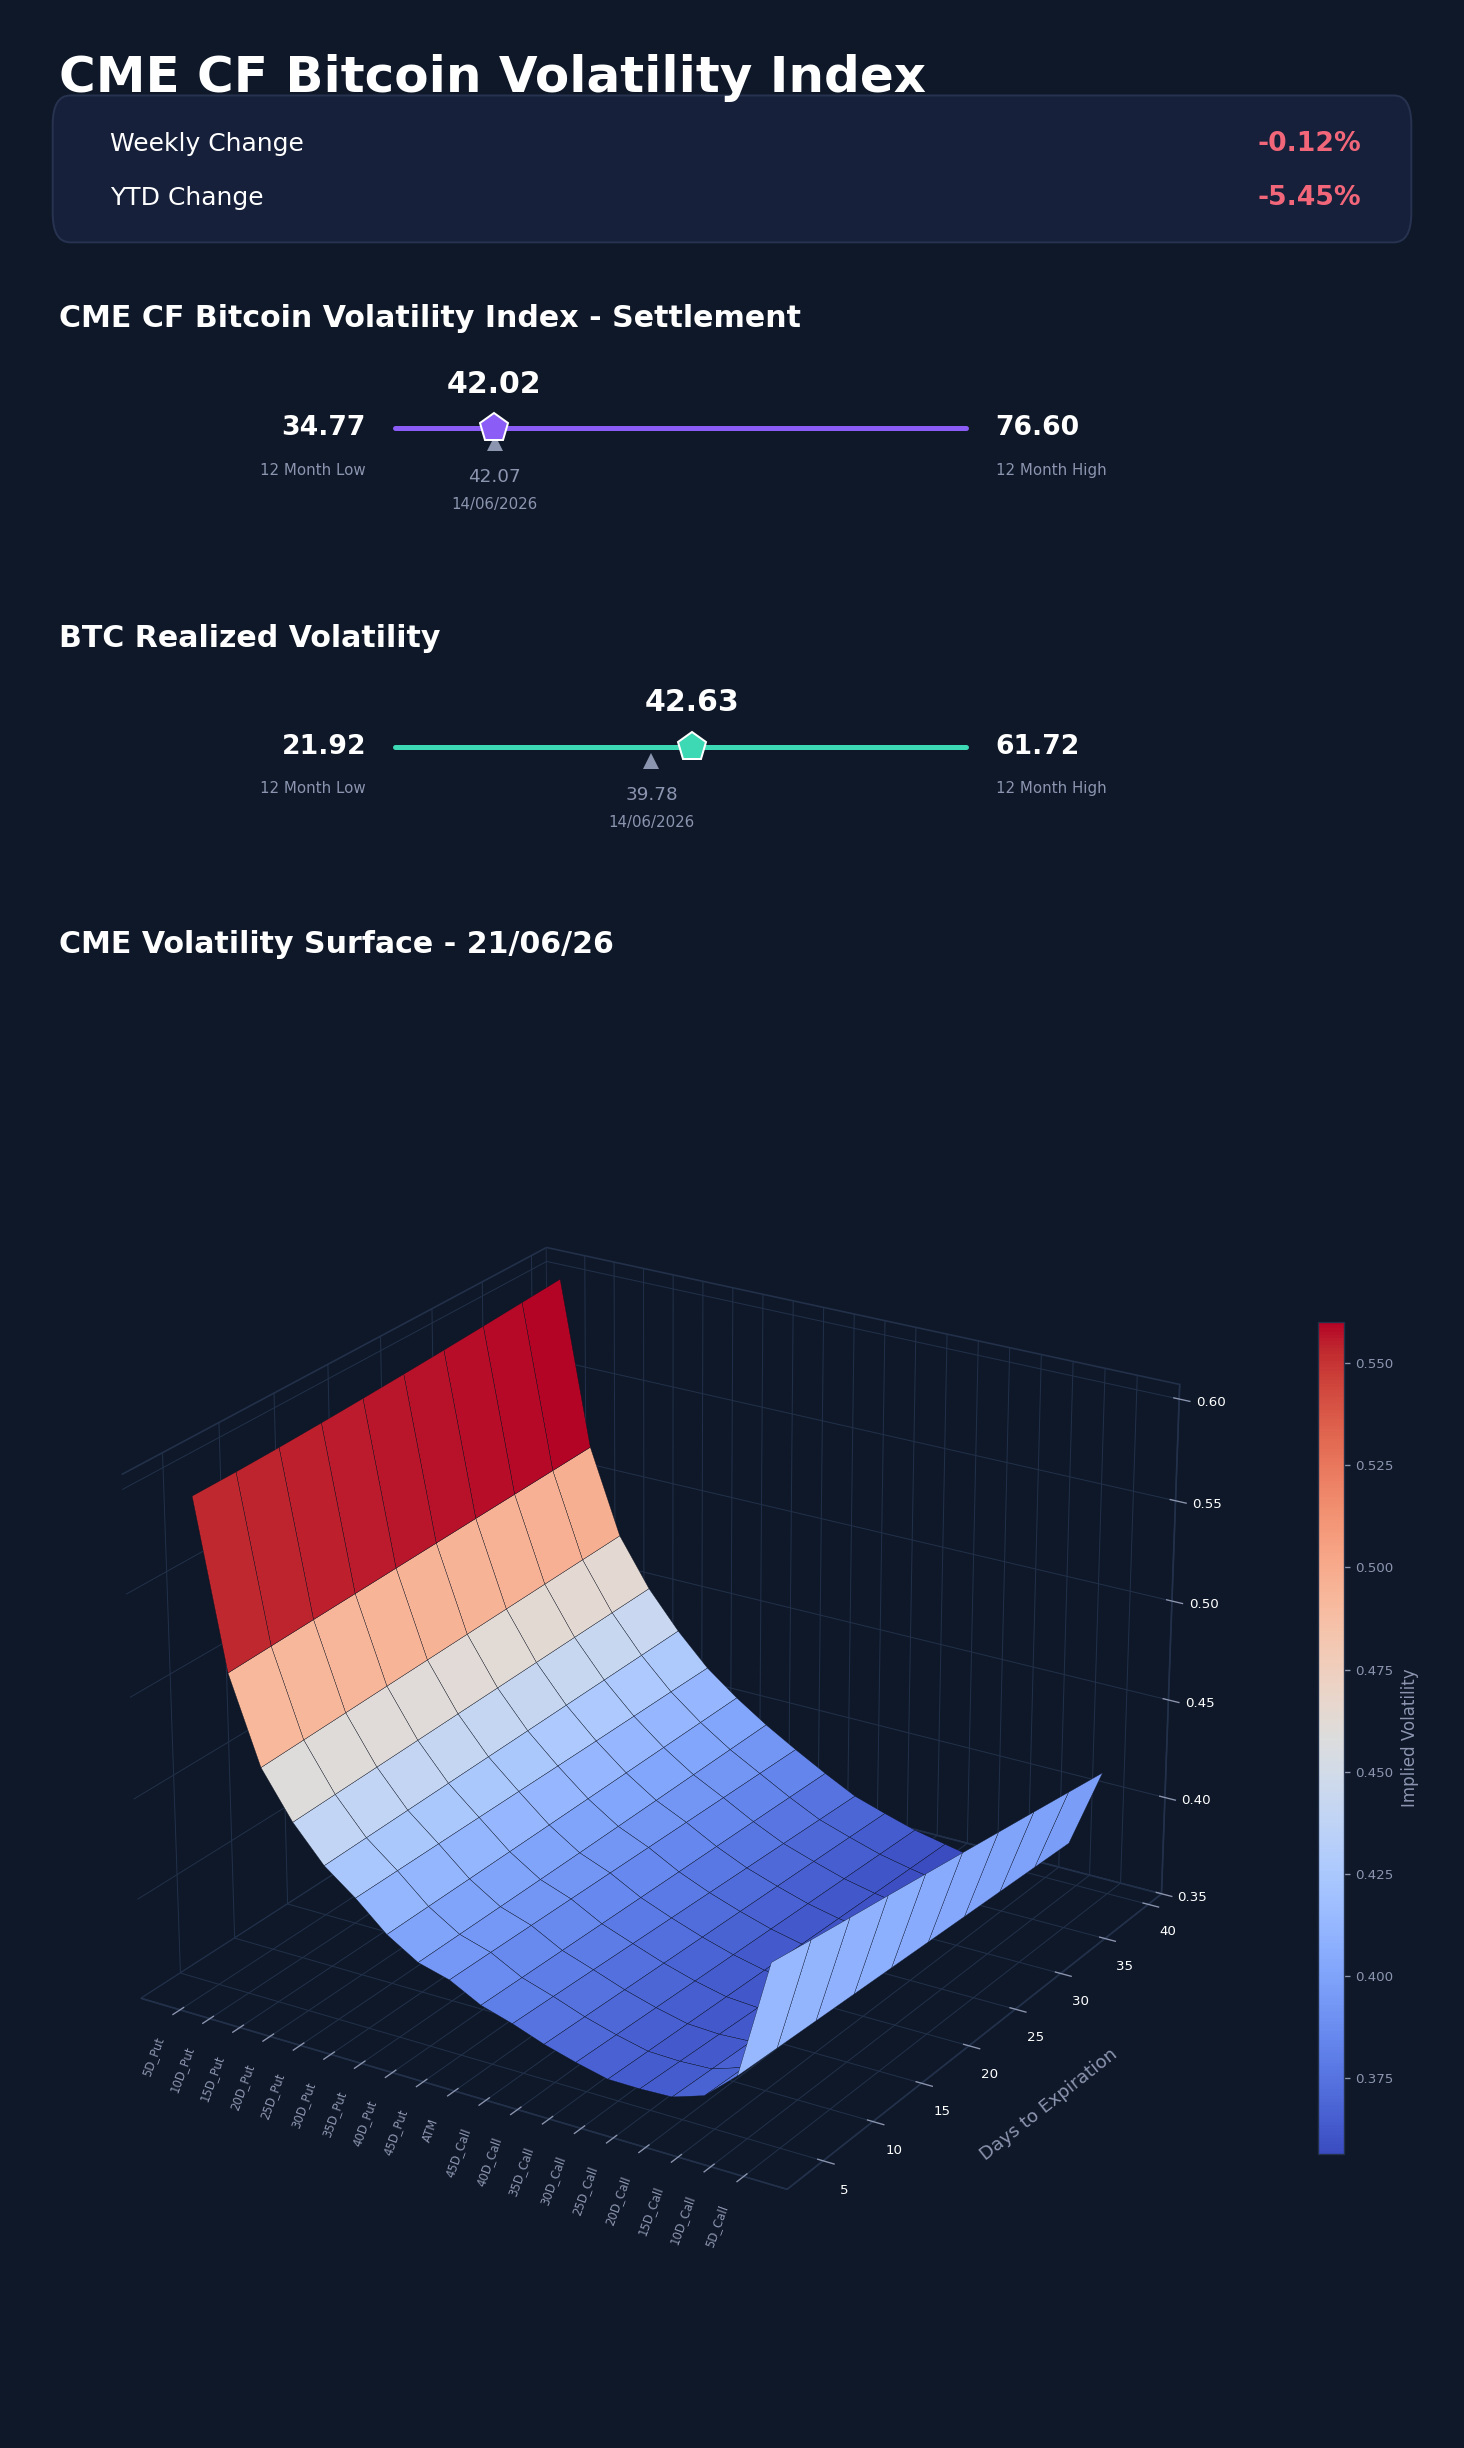
The volatility surface told the more interesting story. CME CF Bitcoin Volatility Index Settlement (BVXS) was effectively unchanged week-on-week, easing from 42.07 to 42.02, a move of just -0.05 of a vol. point even as spot sold off; within the business week it climbed from 39.76 on Monday June 15th to 42.02 by Sunday June 21st, a 5.68% rise off the Monday open. Realized volatility moved up more decisively, rising from 39.78 to 42.63 as daily ranges widened through the Fed week. That left implied volatility 0.61 of a vol. point below realized at the June 21st close, compared with a +2.29 vol. point cushion a week earlier, a 2.90 vol. point swing that took the spread negative. The configuration is the signature of a market that stopped paying up for forward protection just as realized vol caught up: implied vol held flat while the volatility actually being delivered rose to meet and slightly exceed it. Relative to the 12-month range, BVXS sits 7.25 vol. points above its 34.77 low and far beneath its 76.60 high, while realized, at 42.63, sits 20.71 points above its 21.92 low. BVXS also closed 2.42 points below its 44.44 start-of-year reference, leaving implied volatility -5.45% YTD. With realized now running marginally above implied into a hawkish macro backdrop, the surface reads as a market braced for delivered volatility rather than hedging ahead of it.
Market Cap Index Performance
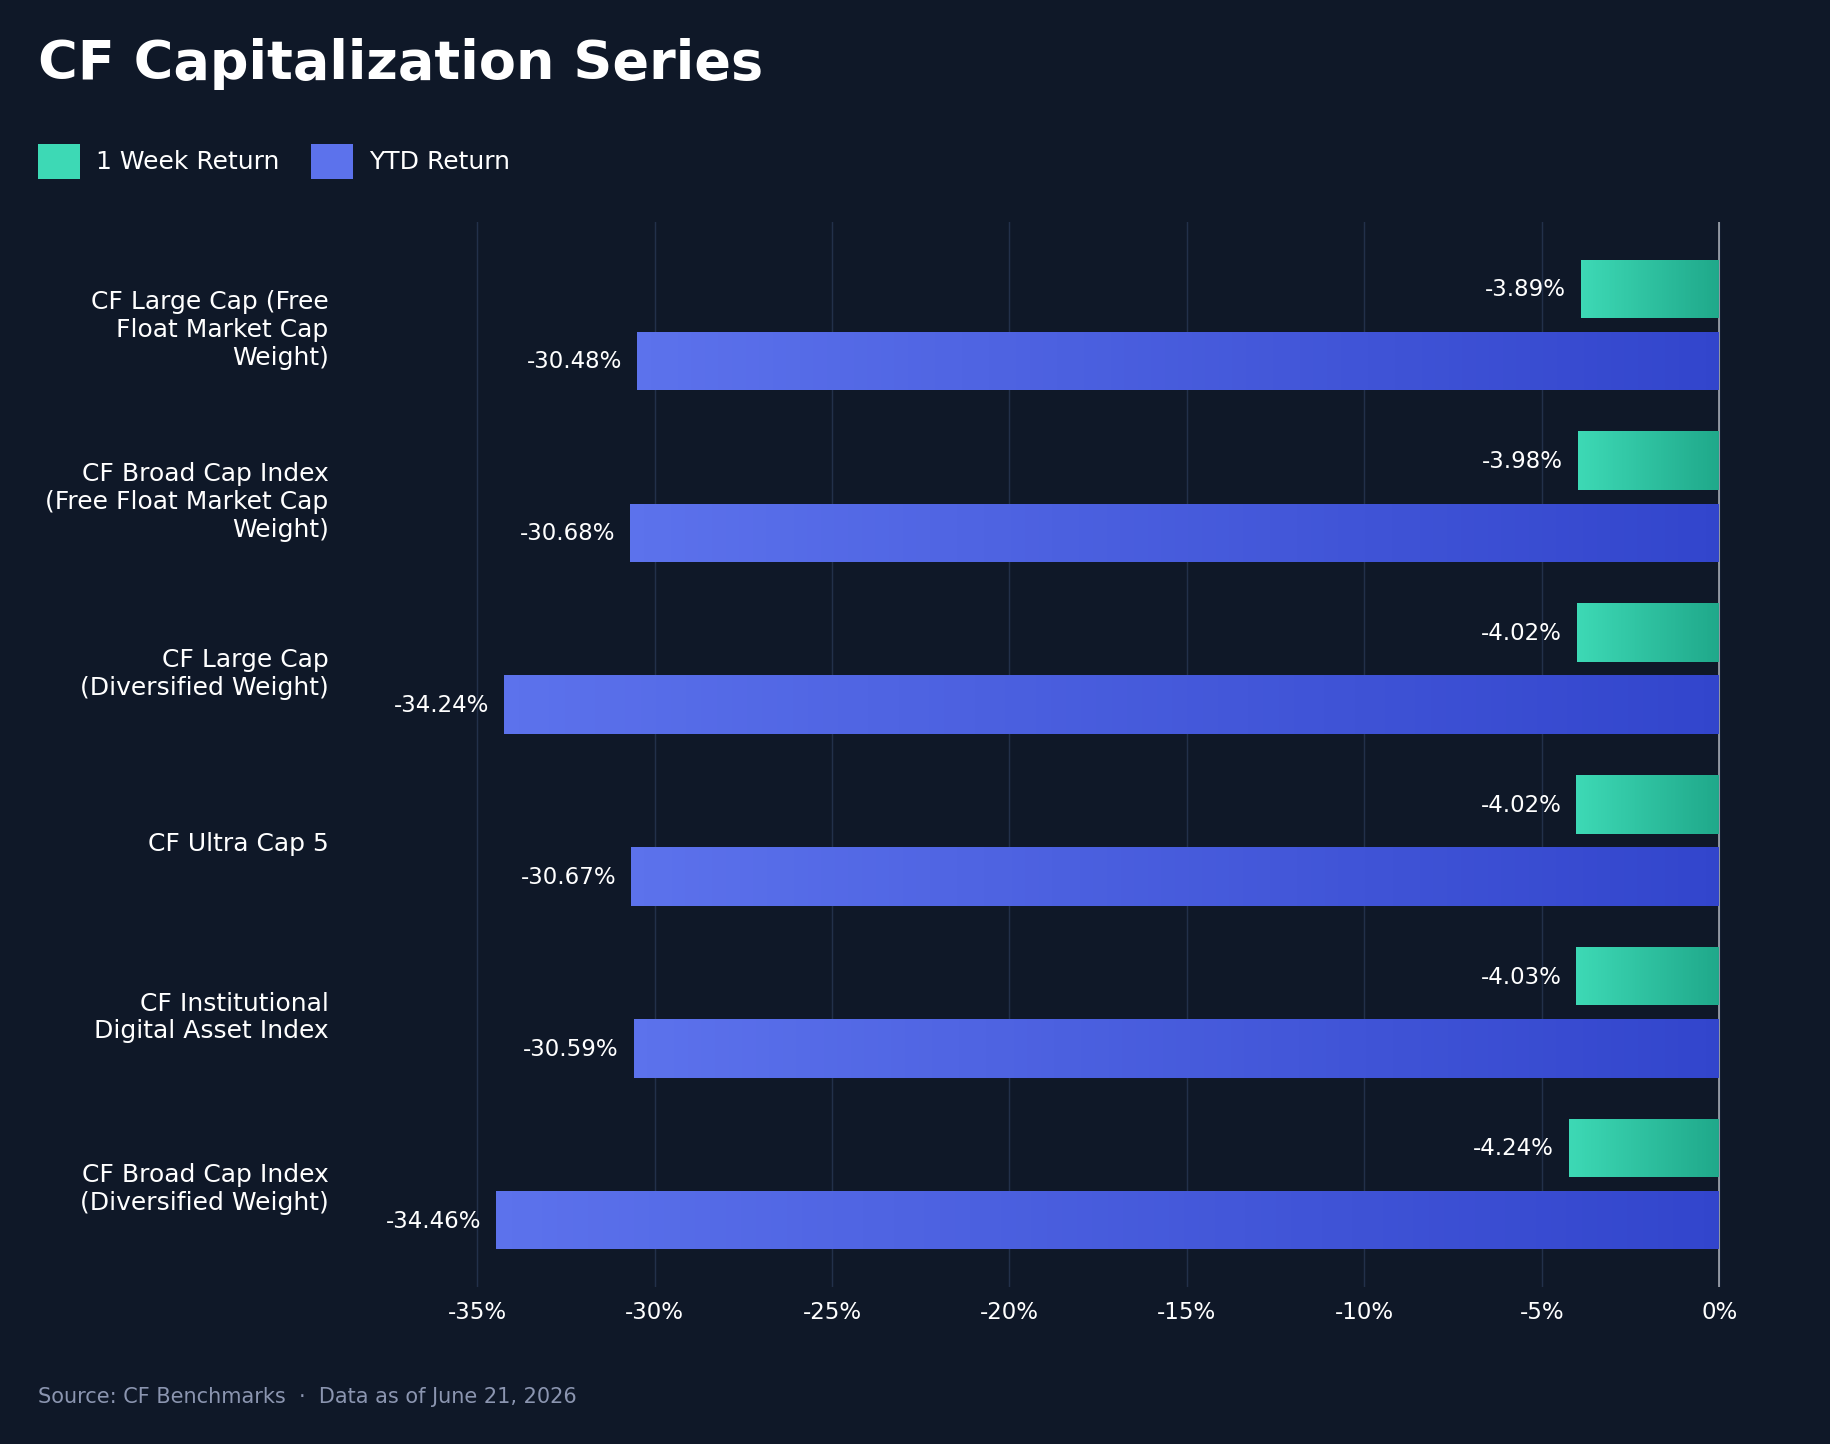
Breadth confirmed the macro read: the cap tiers fell together in a tight band rather than fanning out. The six CF Capitalization Series indices finished inside a 0.35 pp range, from the CF Large Cap (Free Float Market Cap Weight) at -3.89% to the CF Broad Cap Index (Diversified Weight) at -4.24%. In between, the CF Broad Cap Index (Free Float Market Cap Weight) fell 3.98%, the CF Large Cap (Diversified Weight) and CF Ultra Cap 5 each fell 4.02%, and the CF Institutional Digital Asset Index lost 4.03%. A hawkish FOMC, a firmer dollar and higher front-end yields amount to a broad financial-conditions tightening, and the near-uniform 4% drawdown across the set is what that looks like: beta repriced together rather than rotated. The week-on-week diversified-versus-free-float gap was just 0.35 pp, far narrower than a week that singled out the long tail would produce, consistent with a top-down macro shock rather than a tail-specific event. The gap is wider on a YTD basis, where the CF Large Cap (Diversified Weight) sits about 3.76 pp behind the free-float large-cap measure (-34.24% versus the CF Large Cap (Free Float) at -30.48%), but that is a year-to-date composition effect, not this week's story. Spot Bitcoin and Ether exchange-traded fund flows fit the risk-off tape, running net negative into the decision, about -$103.5m combined on June 18th and led by IBIT, rather than offering an offsetting bid. The whole capitalization set now sits 30% to 34% lower YTD.
Factor Analysis
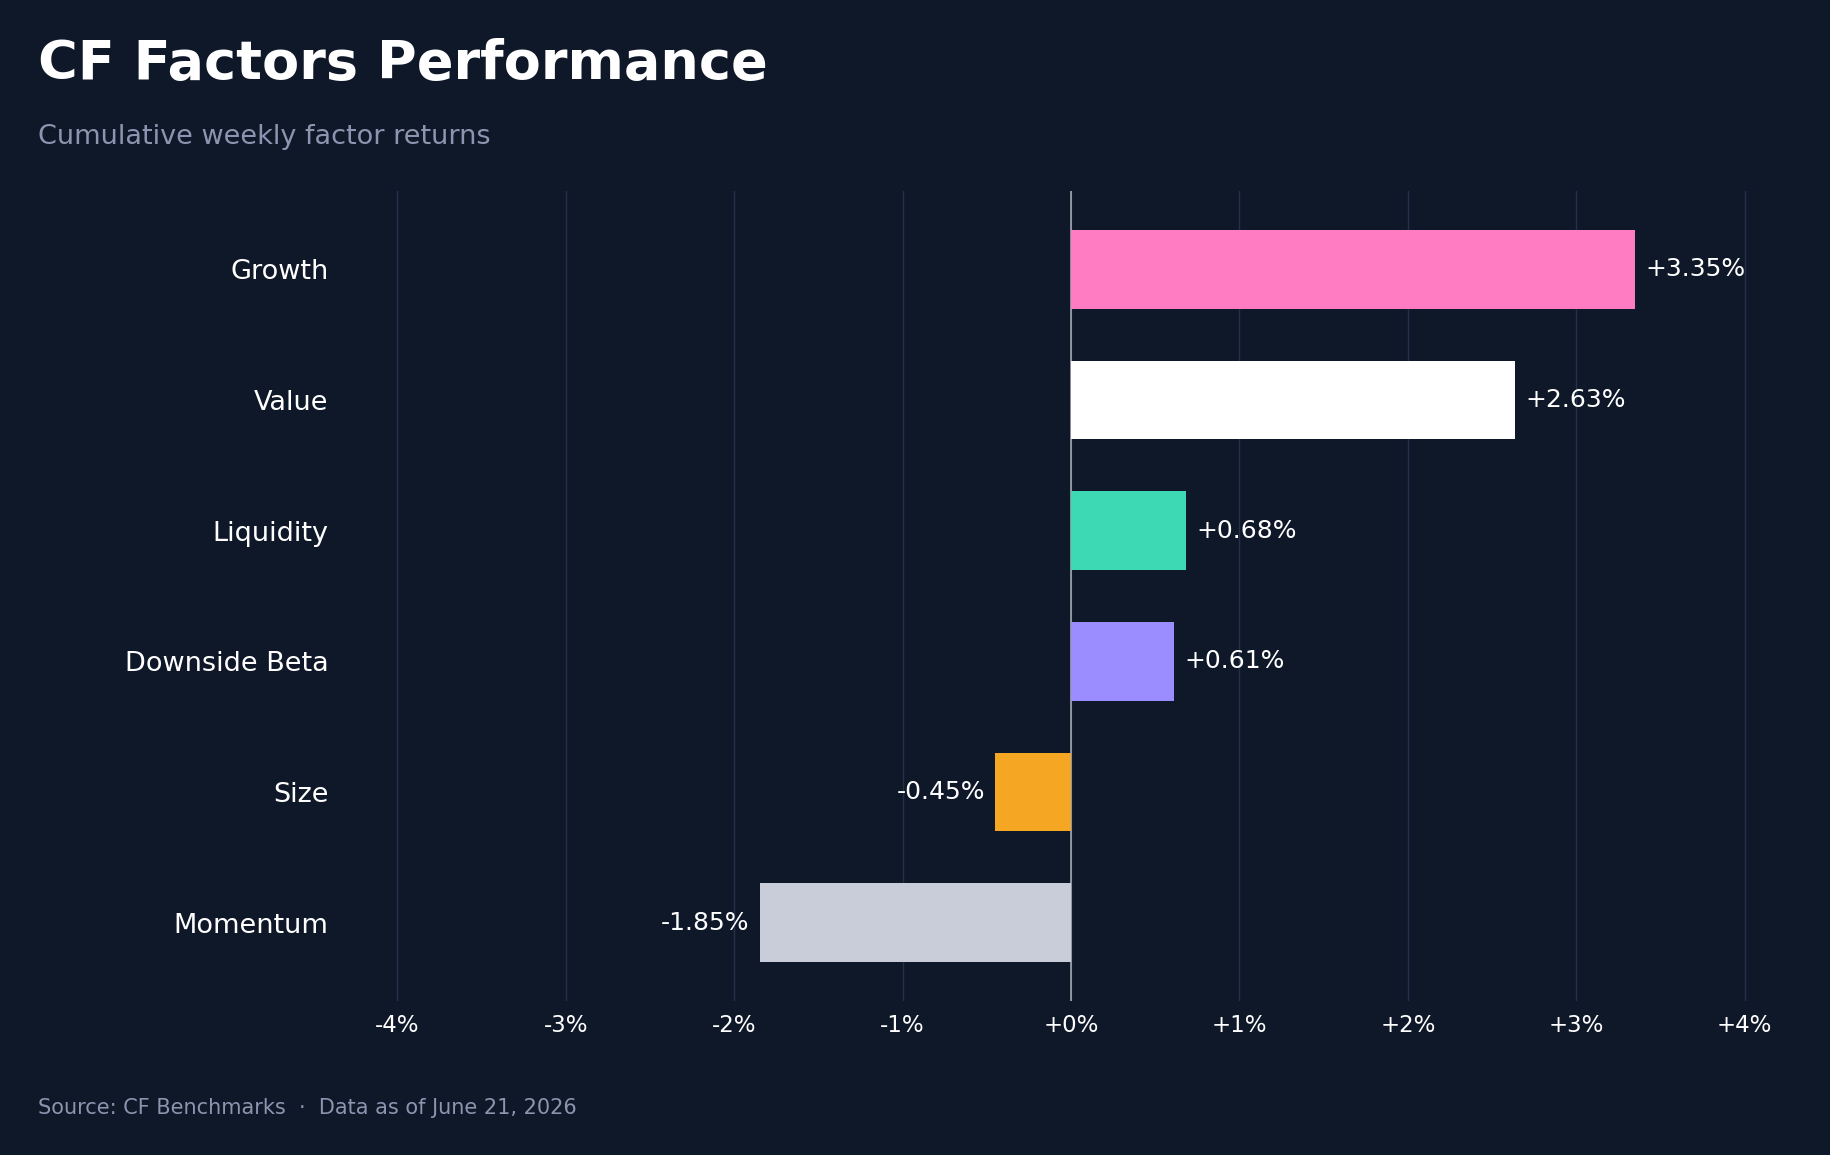
Within the week, factor returns split by style, ranging from Growth at +3.35% to Momentum at -1.85%, a 5.20 pp spread. The rotation versus the prior week was large and pointed toward growth-and-value quality: Growth swung from -0.03% to +3.35%, a 3.38 pp move and the biggest of the set; Value improved from +0.53% to +2.63%, up 2.11 pp; and Liquidity flipped from -0.69% to +0.68%, a 1.37 pp reversal. The weaker side was Size, easing from +0.06% to -0.45%, and Momentum, sliding from -1.34% to -1.85% and finishing the worst factor for a second straight week. Downside Beta was roughly steady at +0.61%. Read together, the week rewarded Growth, Value and tradable Liquidity while penalizing Momentum, a configuration consistent with a macro-driven repricing in which the prior week's leaders were trimmed and cheaper, higher-quality exposure was favored. Growth and Value were the only factors to clear +2%, and their combined average sat well above the Momentum and Size readings, giving the style rotation its main force.
Read our latest weekly crypto factors report: Factor Friday - June 19, 2026
Classification Series Analysis
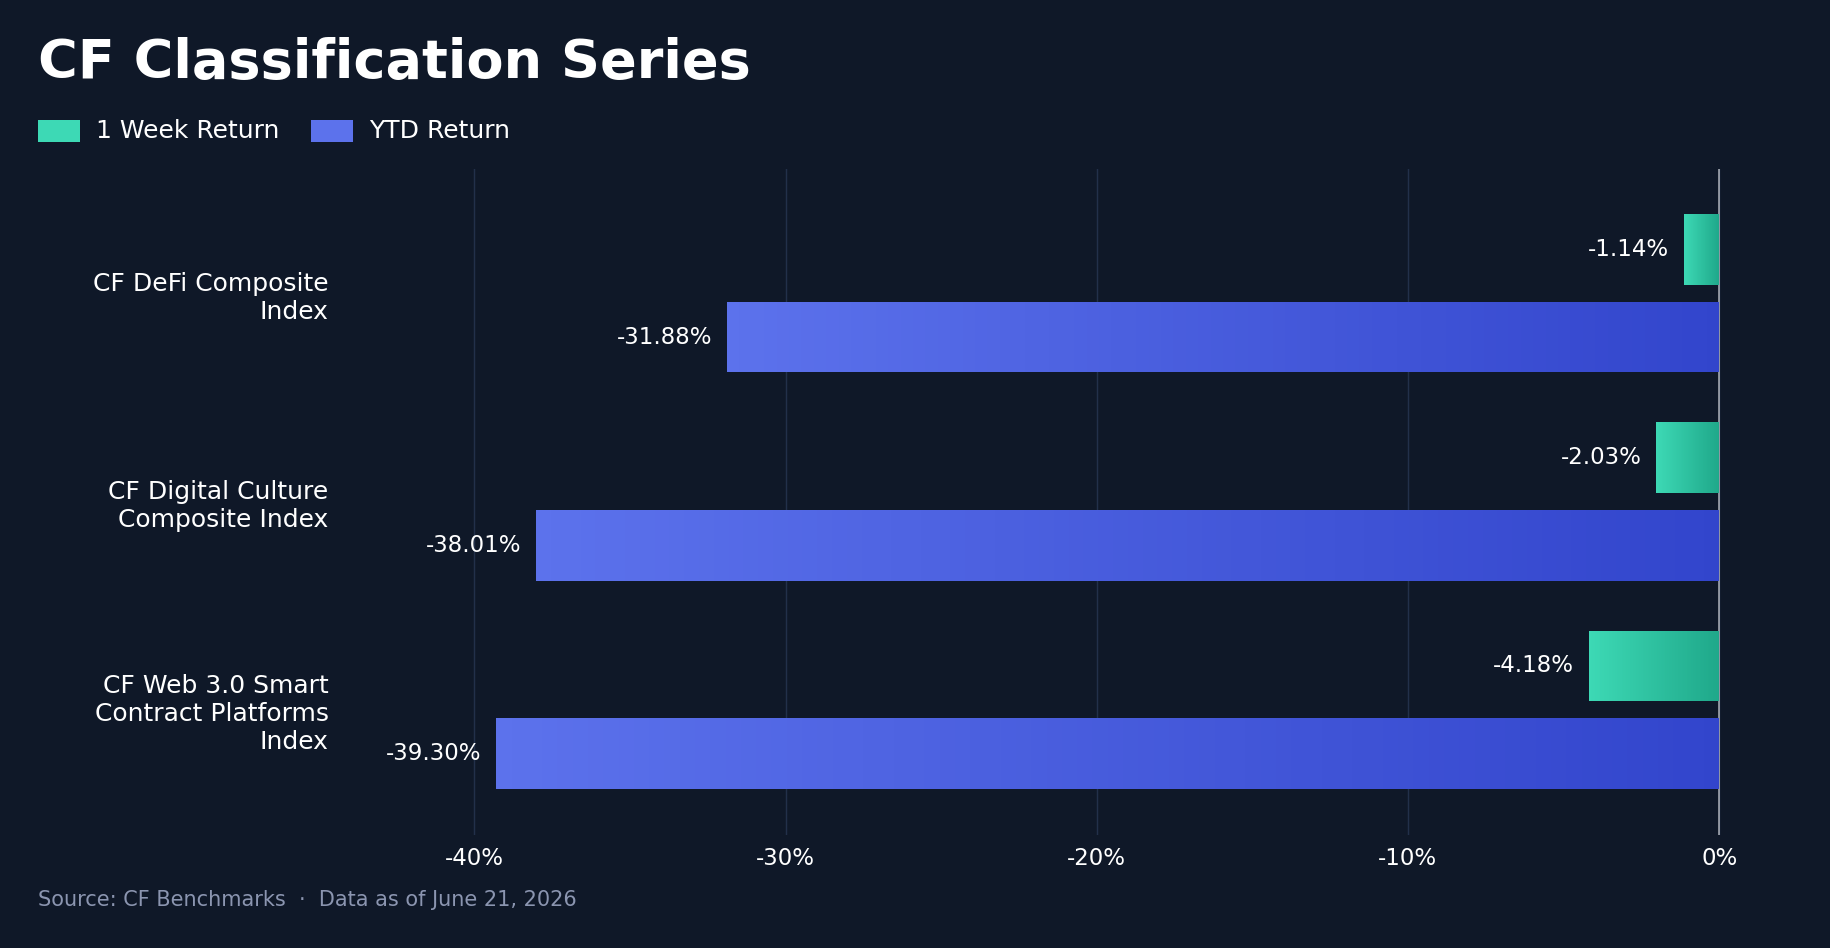
The three thematic composites all finished lower but in a clear order. The CF DeFi Composite Index held up best at -1.14%, ahead of the CF Digital Culture Composite Index at -2.03% and the CF Web 3.0 Smart Contract Platforms Index at -4.18%, the weakest of the three. DeFi outperformed the smart-contract platforms by 3.04 pp and Digital Culture by 0.89 pp, while Culture sat 2.16 pp ahead of Web 3.0. DeFi's relative resilience owed partly to Uniswap (UNI), which led the Finance names after Standard Chartered initiated research coverage on June 15th, while the Web 3.0 platforms tracked the heavier alternative layer-1 tape that drove the broad selloff. On a YTD basis the ordering holds and the gaps widen, DeFi at -31.88% against Digital Culture at -38.01% and the platforms at -39.30%. The read is broad thematic softness led lower by the smart-contract platforms, with DeFi the marginal outperformer and the only composite to keep its weekly loss inside 2%.
Sector Analysis
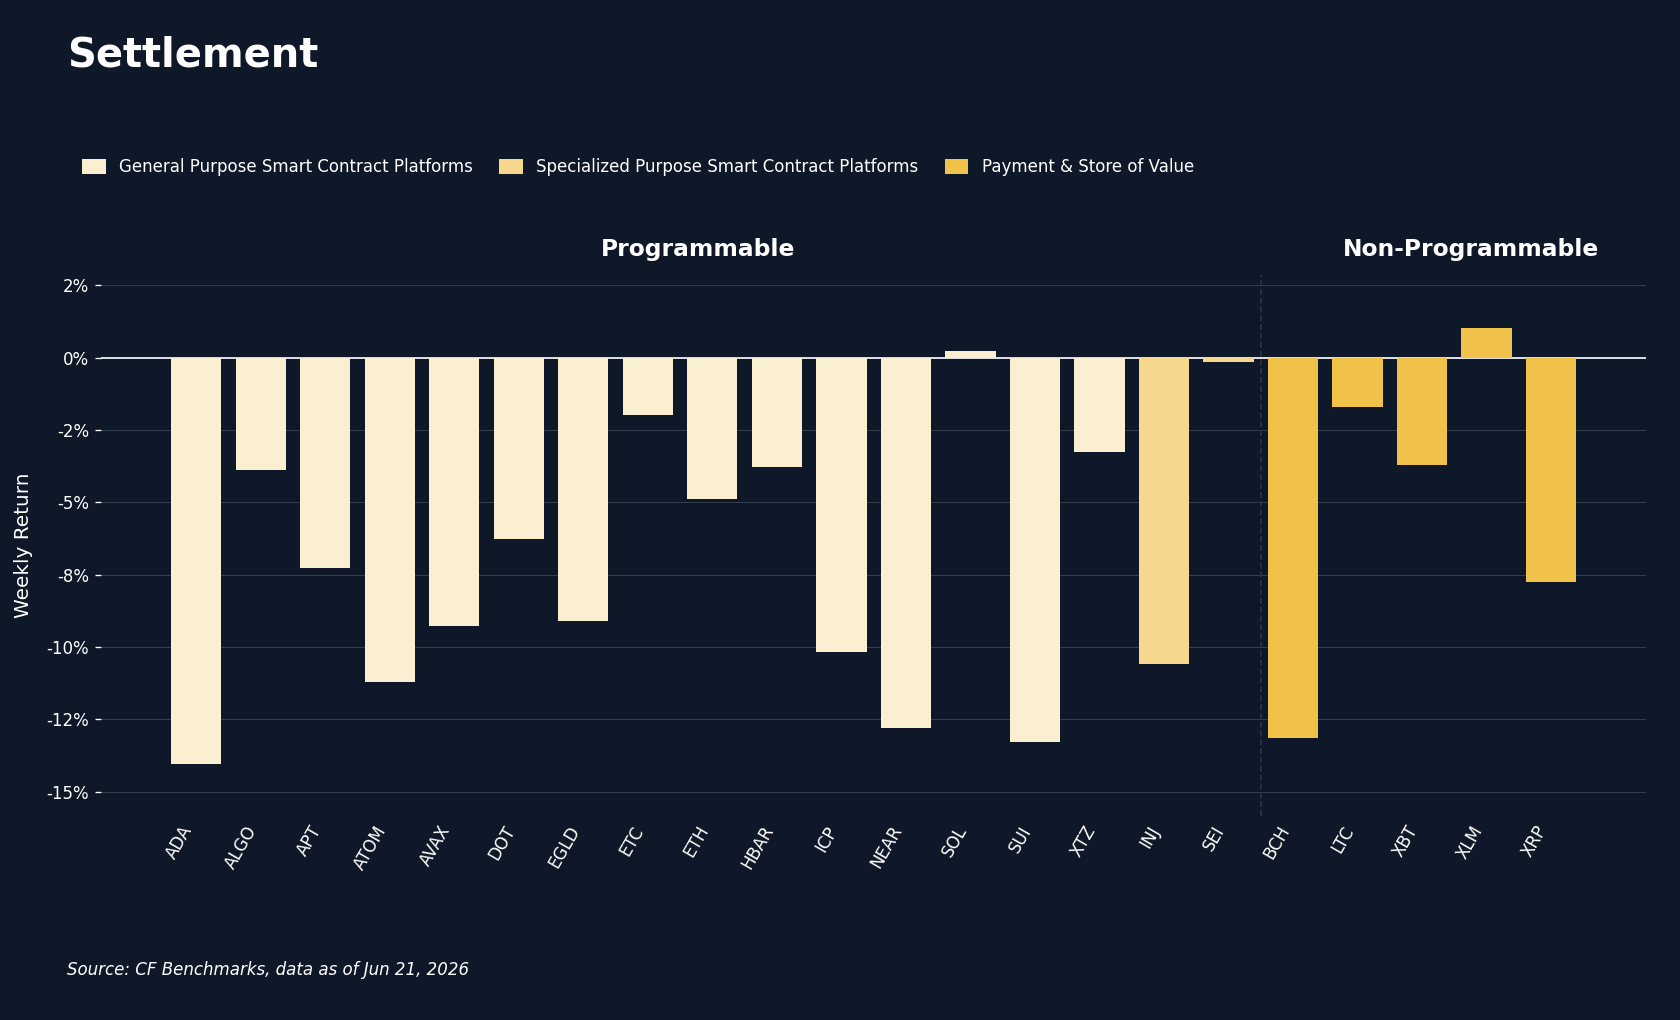
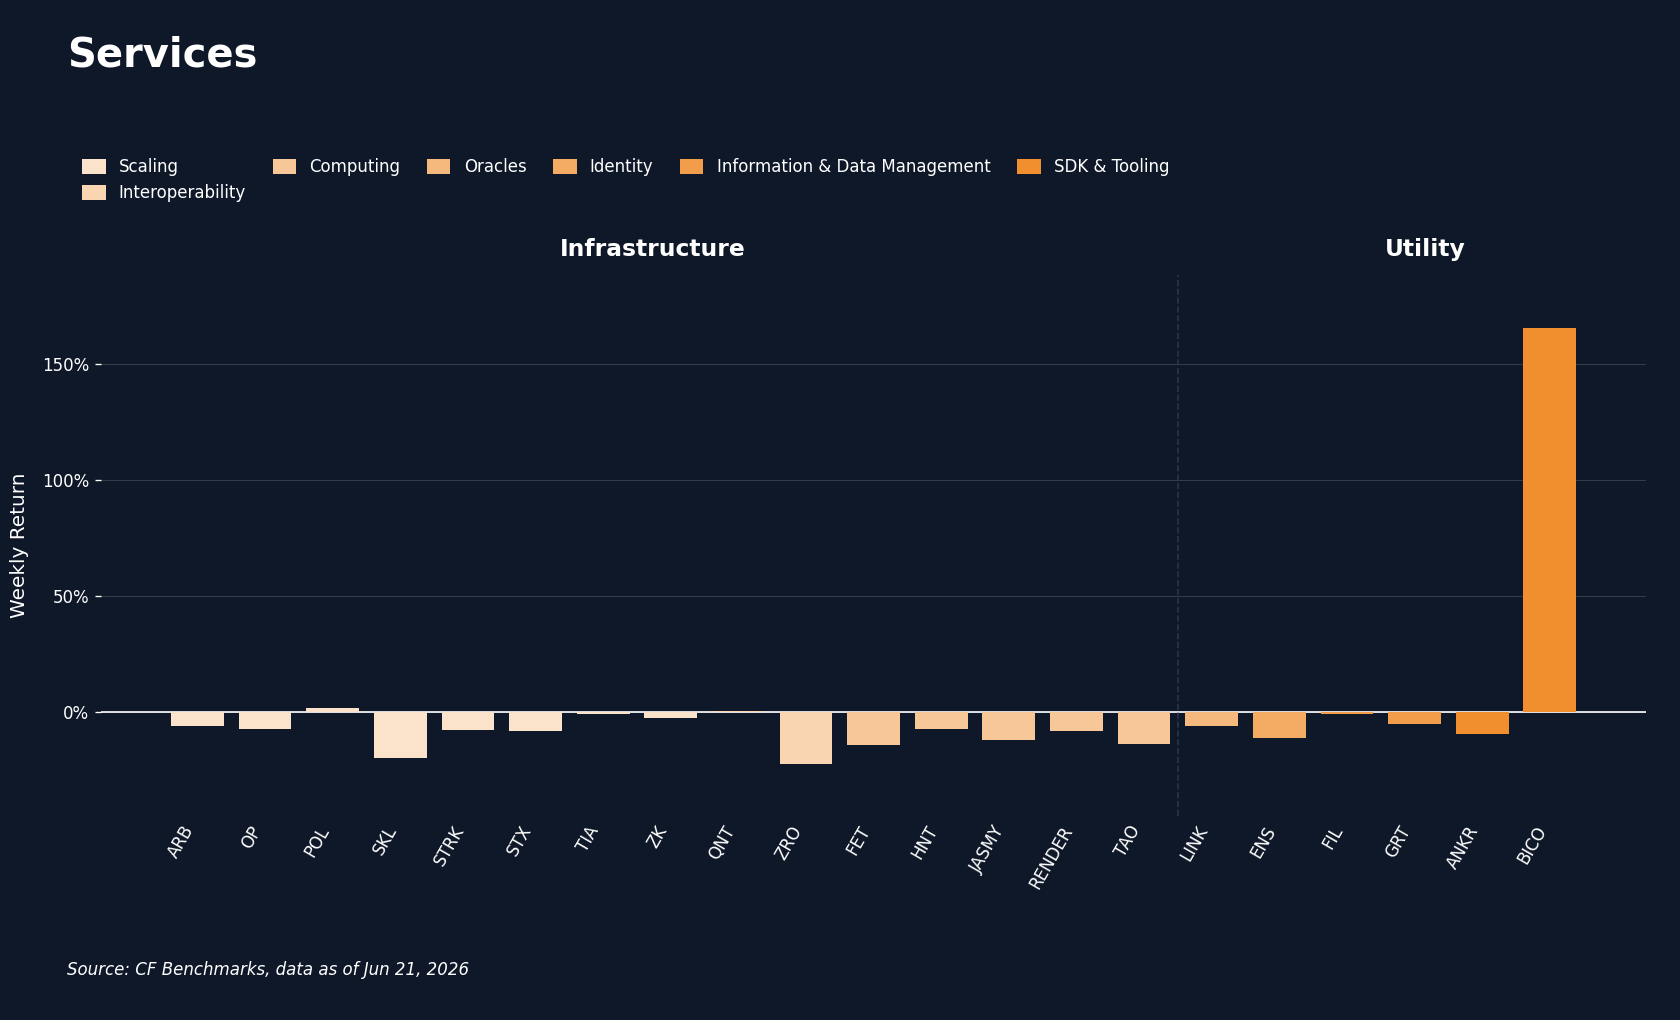
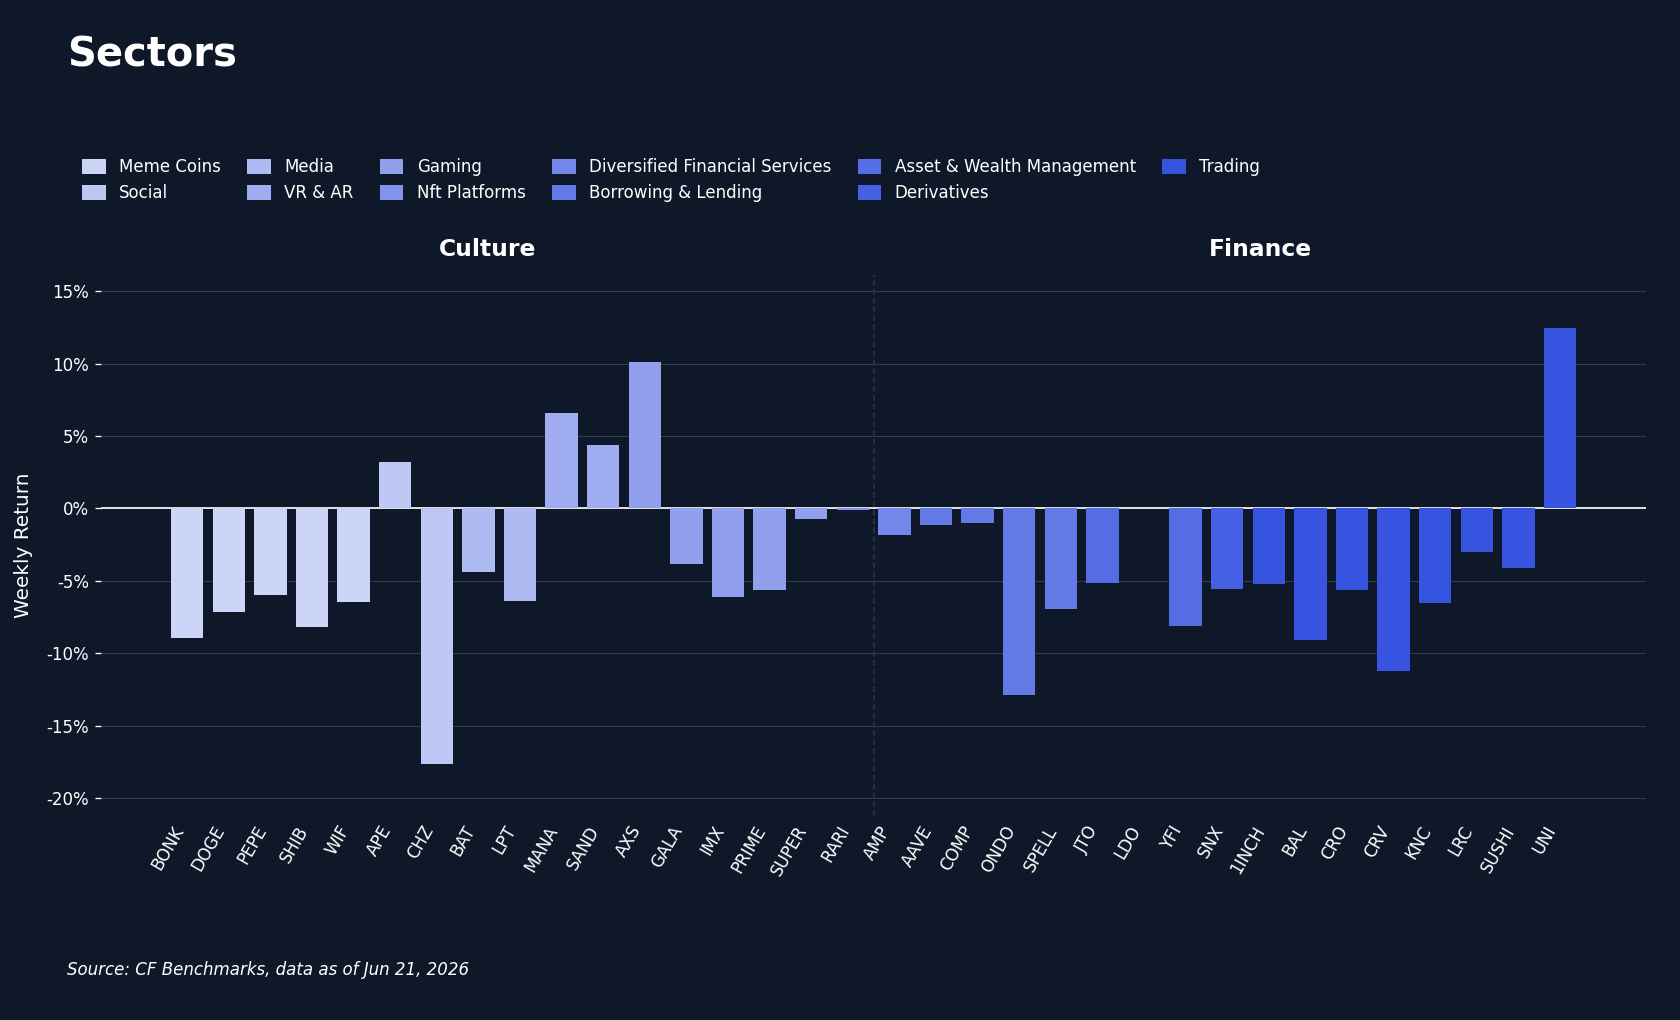
Across the CF Digital Asset Classification Structure (CF DACS) taxonomy, sub-category averages were negative and the dispersion sat at the extremes. Culture was the least-bad sub-category at -3.37% w/w, ahead of Finance at -4.41% and Non-Programmable at -5.06%, while Programmable (-7.15%) and Infrastructure (-8.66%) were the heaviest. The Utility average screened at +22.15%, but that figure is an artifact of a single constituent: Biconomy (BICO) printed +165.86% after a June 16th announcement that an unrelated Dream Bowl meme coin would list on the similarly named, and unaffiliated, Biconomy Exchange, a name-collision repricing rather than a re-rating of the Utility sector. Excluding BICO, Utility averaged about -6.59%, in line with the rest of the complex, and we flag BICO as an idiosyncratic outlier rather than a sector signal. The widest token-level move that reflected a real catalyst sat in Infrastructure: LayerZero (ZRO) fell 22.44%, the worst constituent in the complex, coinciding with a scheduled unlock of 25.71m ZRO, about $23m to $24m, on or around June 20th, a supply event rather than a fundamental one. Setting the BICO artifact aside, the widest catalyst-driven token-level spread ran 34.92 pp, from Uniswap (UNI) at +12.48% to ZRO at -22.44%. Elsewhere the decentralized-AI names gave back the prior week's policy-driven rally, with Bittensor (TAO, -14.13%), Fetch.ai (FET, -14.36%) and JasmyCoin (JASMY, -12.02%) among the Infrastructure laggards, while Culture's smaller loss leaned on Axie Infinity (AXS, +10.10%) and the metaverse names Decentraland (MANA, +6.57%) and The Sandbox (SAND, +4.37%). The sector story was a broad, macro-led drawdown with the true cross-sectional action concentrated in Infrastructure.
CF Staking Series
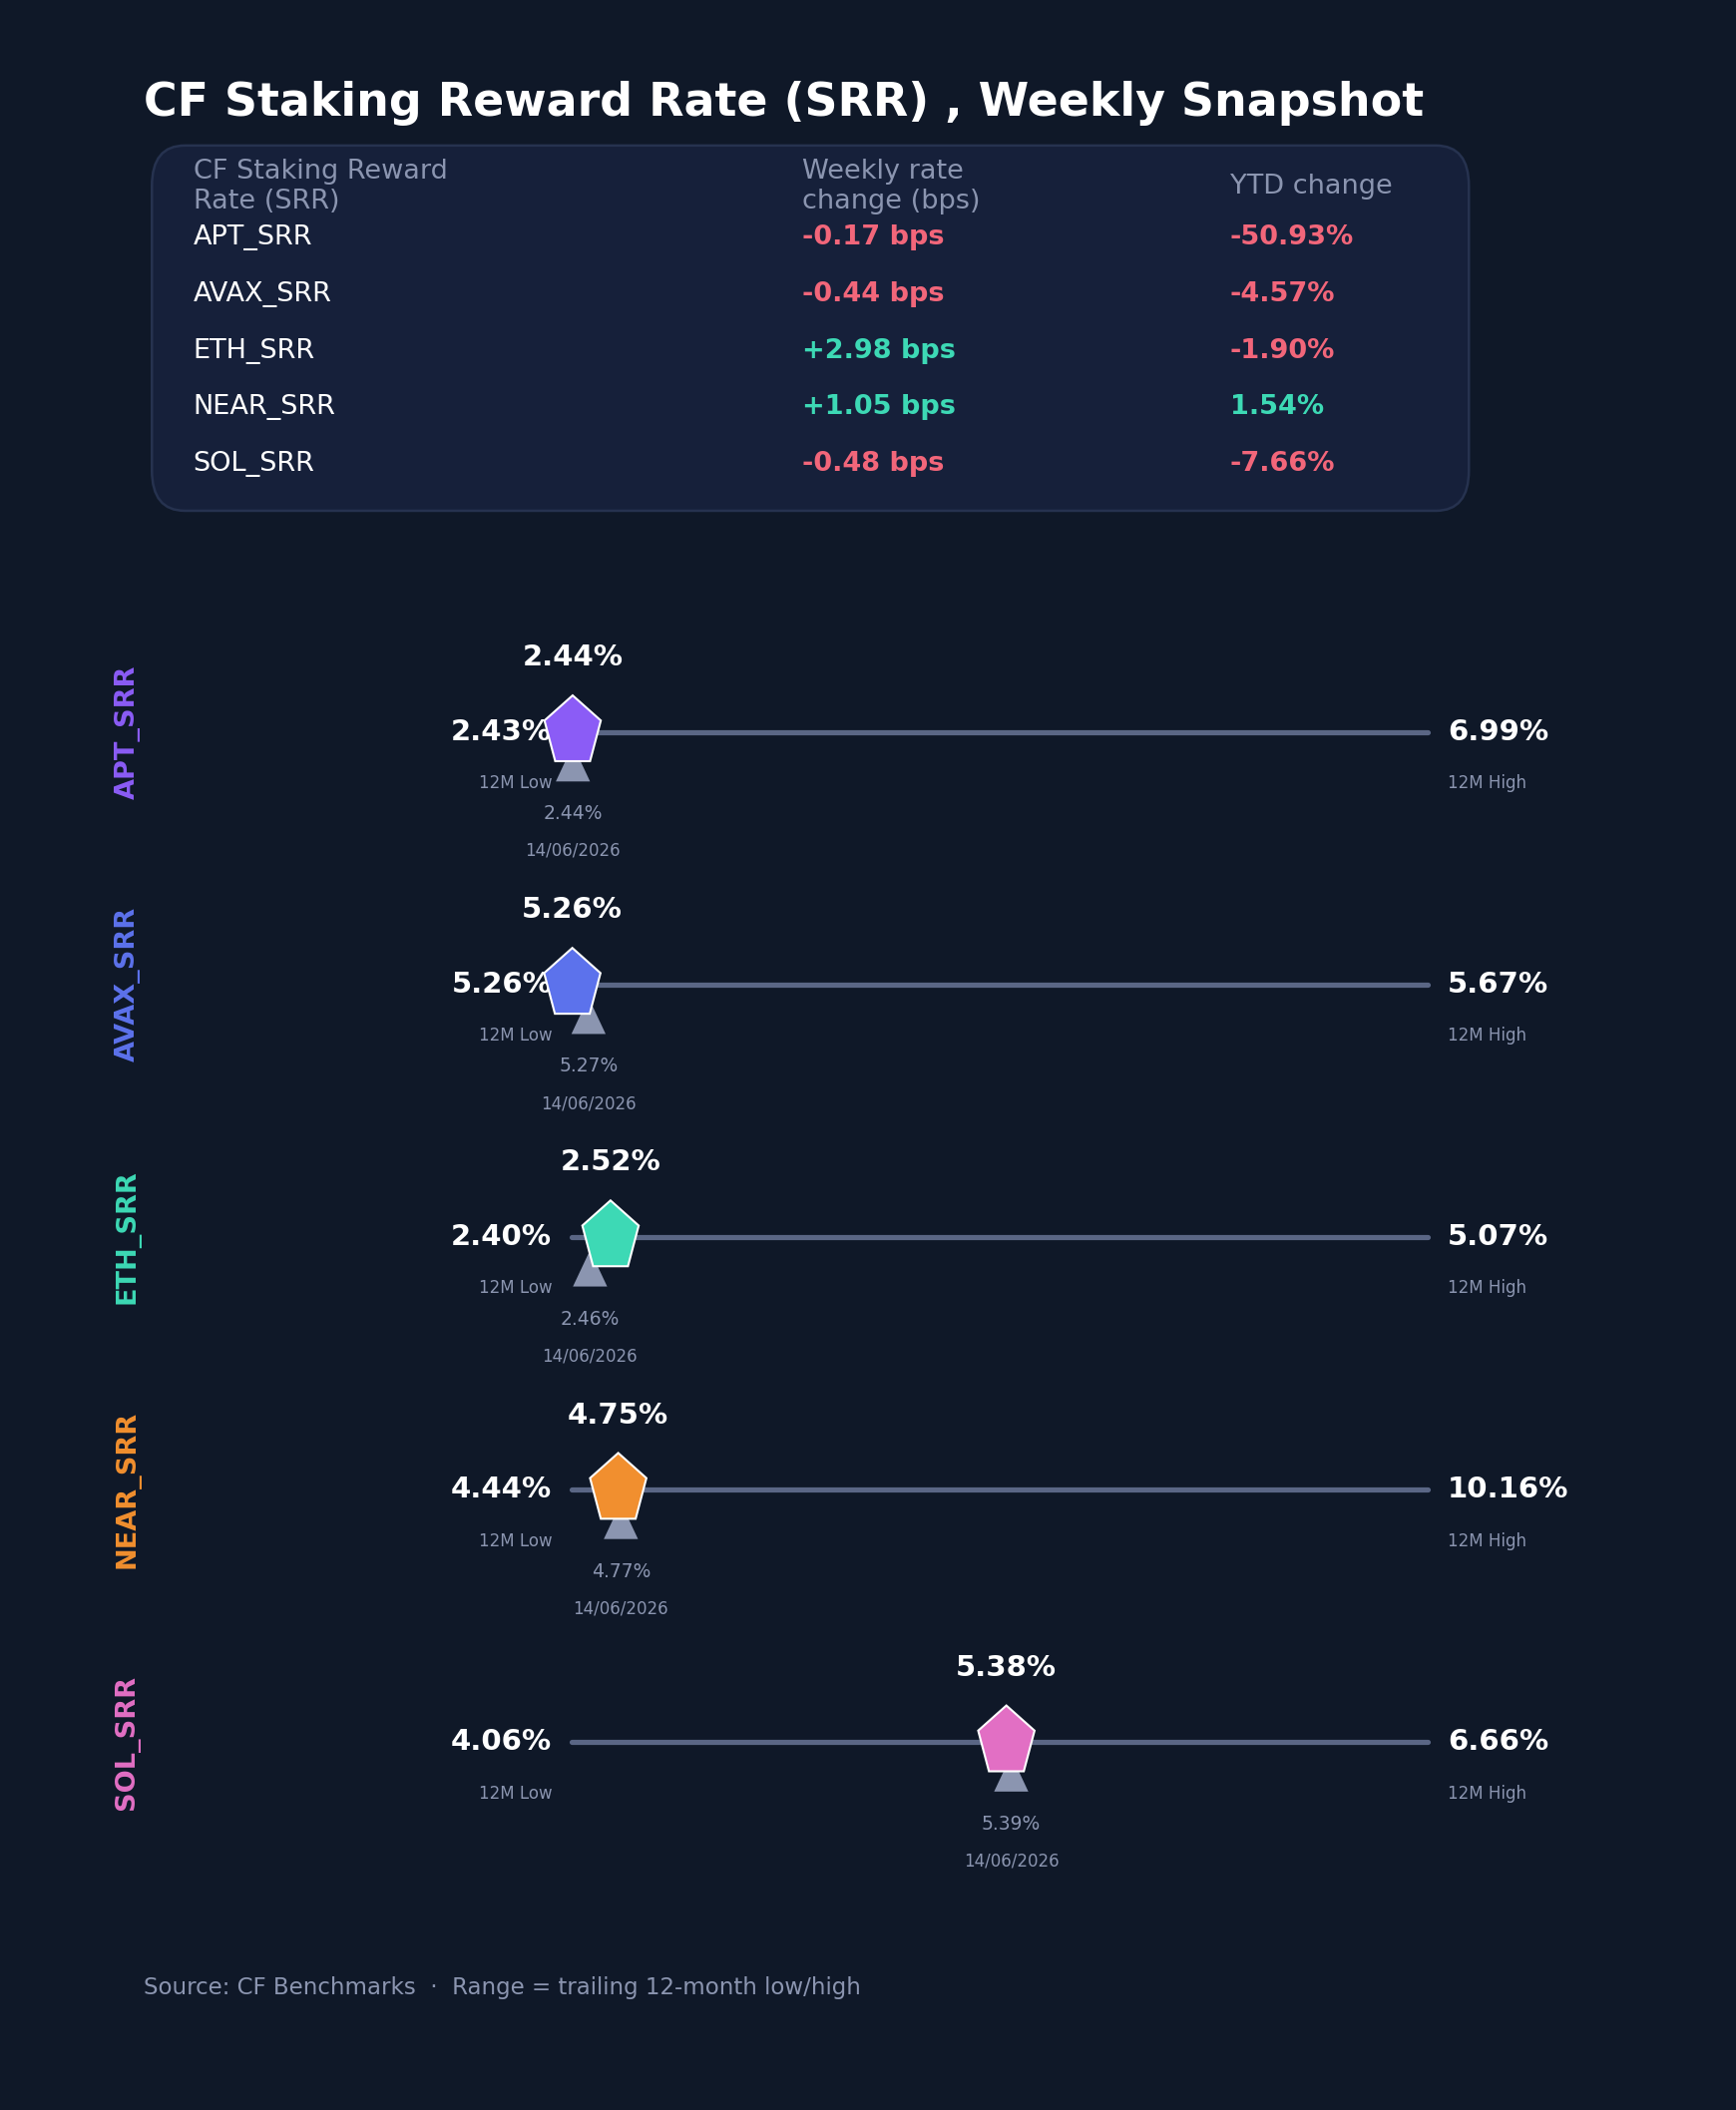
Reward rates across the five CF Staking Series indices were broadly stable, with Ether the one mover of note. ETH Staking returned +1.20% on the index and its reward rate rose from 2.4560% a week earlier to 2.5198%, the only clearly positive move of the set and a reversal of the prior week's decline; its published weekly rate change of +2.98 bps was the largest in the group. The other four were quiet: APT Staking returned -0.07% with its reward rate easing from 2.4370% to 2.4354%, a -0.17 bps published change; AVAX Staking -0.08% with its rate at 5.2606%, -0.44 bps; SOL Staking -0.09% with its rate at 5.3784%, -0.48 bps; and NEAR Staking +0.22% with its rate at 4.7538%, +1.05 bps. That left SOL the highest reward rate of the set at 5.3784% and APT the lowest at 2.4354%, a spread of roughly 2.94 pp, with published weekly rate changes spanning just -0.48 bps to +2.98 bps. Index relative returns ran from SOL's -0.09% to ETH's +1.20%. The set points to a quiet week for staking economics, with the ETH reward-rate increase the only data point worth flagging.
Interest Rate Analysis
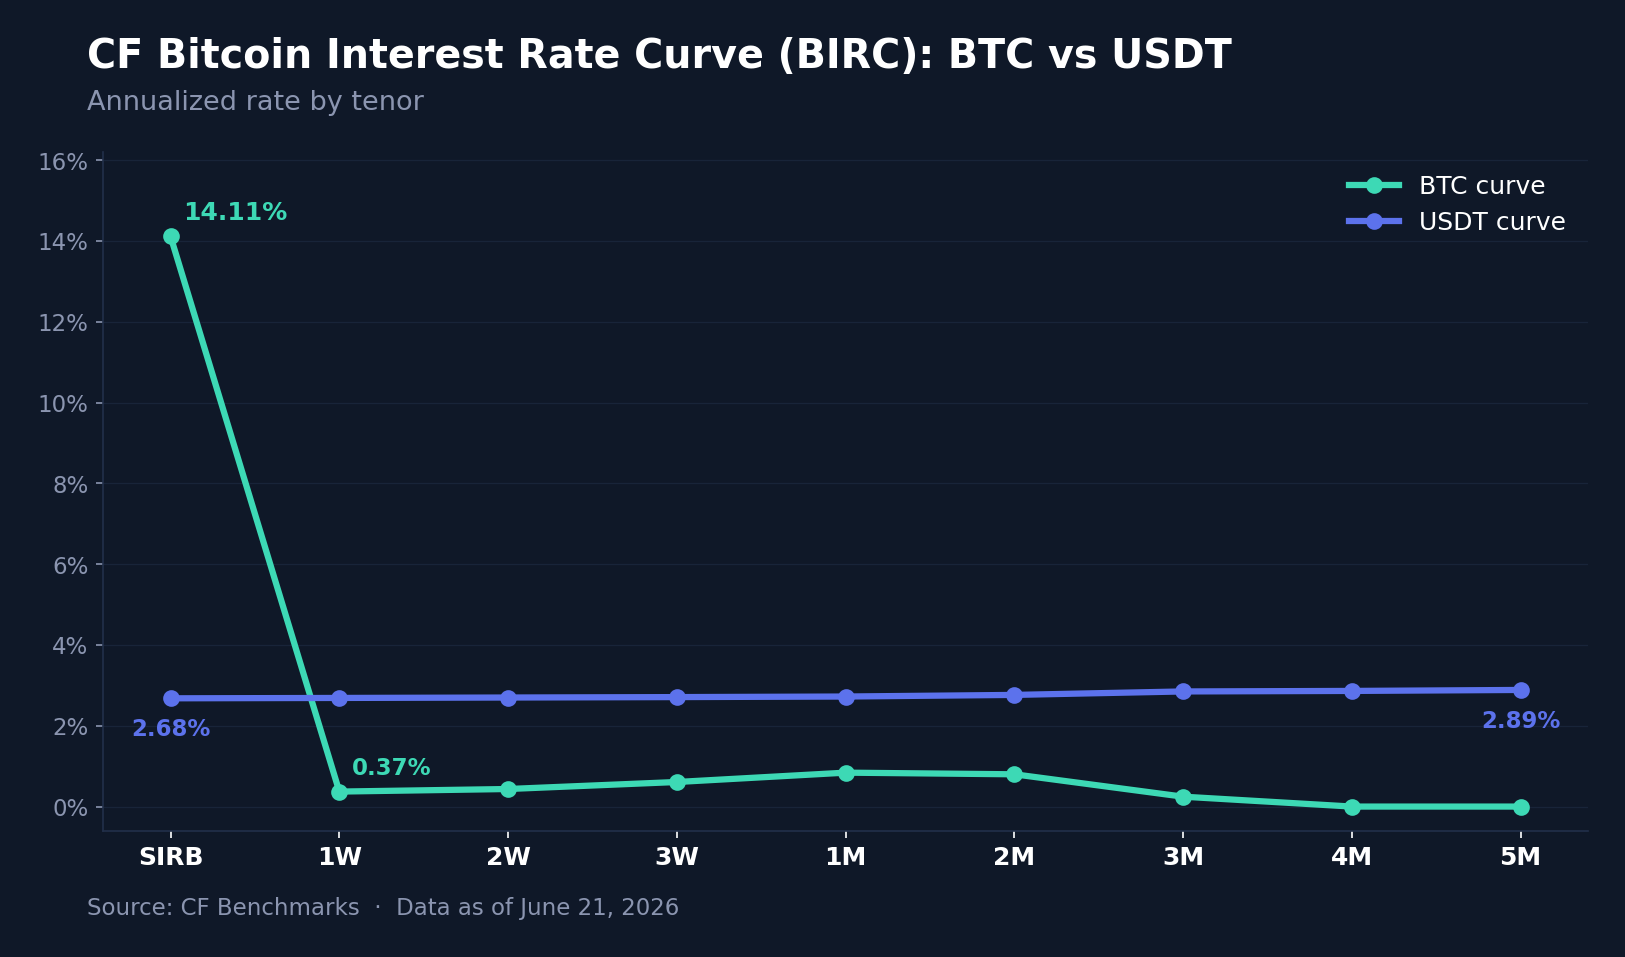
The two CF Bitcoin Interest Rate Curve (BIRC) curves moved in different ways, and the Bitcoin front end did the talking again, this time in reverse. The BTC spot reference borrow rate (SIRB) fell 512.5 bps to 14.11%, unwinding much of the prior week's overnight squeeze, though it remains far above the rest of the BTC term structure; the 1-week rate eased 52.3 bps to 0.37%, while the belly firmed modestly, the 3-week up 6.8 bps to 0.61% and the 1-month up 15.7 bps to 0.84%, and the 3-month slipped to 0.25%. The USDT curve, by contrast, shifted lower in parallel, easing 26.7 to 32.0 bps across every tenor while keeping its gentle upward slope from 2.68% at SIRB to 2.89% at 5 months. Across both curves, tenor changes ranged from -512.5 bps to +15.7 bps. The pattern is the mirror image of the prior week: the BTC overnight borrow that spiked then is normalizing now, while dollar funding eased uniformly, likely tracking the same front-end repricing the FOMC set in motion. We read the SIRB move as the unwind of a positioning and collateral event at the very front of the BTC curve rather than a change in term carry, since the BTC term tenors barely moved and the USDT curve eased as one.
Bottom Line
Taken together, the week was a clean, macro-led drawdown. A hawkish first FOMC under Chair Warsh, reinforced by a hot retail sales print, repriced the front end and the dollar and pulled the whole complex lower together: spot fell across the board, the cap tiers clustered near -4%, and breadth gave no sign of an internal rotation. The factor tape rewarded Growth, Value and Liquidity over Momentum, a quality bid consistent with a risk-off repricing rather than a fresh style call. The volatility surface was the most telling internal signal: implied vol held flat while realized rose into and slightly through it, so the market stopped paying for protection just as delivered volatility caught up. The two genuine cross-sectional stories were both idiosyncratic, a name-collision spike in Biconomy that distorted the Utility average and a scheduled LayerZero unlock that produced the week's worst constituent, while the front-end Bitcoin borrow squeeze of the prior week unwound. This was a week the macro set the direction and the complex followed; the information was in how uniformly it did so.
The information contained within is for educational and informational purposes ONLY. It is not intended nor should it be considered an invitation or inducement to buy or sell any of the underlying instruments cited including but not limited to cryptoassets, financial instruments or any instruments that reference any index provided by CF Benchmarks Ltd. This communication is not intended to persuade or incite you to buy or sell security or securities noted within. Any commentary provided is the opinion of the author and should not be considered a personalised recommendation. Please contact your financial adviser or professional before making an investment decision.
Note: Some of the underlying instruments cited within this material may be restricted to certain customer categories in certain jurisdictions.
Factor Friday - July 10, 2026
The relief rally extended for a second week with Market +2.27%, but the real story is risk appetite: Liquidity led styles at +1.51% as thinner, less liquid names caught a bid. Value paused at -0.79% yet still leads over four weeks. Defensive tilts kept unwinding into the bounce.

Mark Pilipczuk
2026 Mid-Year Market Outlook
Iran risk, regulatory policy, Bitcoin rebalancing, tokenization, and protocol revenue are reshaping the outlook. Growth is narrowing, but regulatory progress and productive on-chain activity create offsets. Dispersion, not broad beta, should define the next year.
Gabriel Selby
Changes to the Token Market Price Benchmarks Series - Market Prices – 07 July 2026
The Administrator has confirmed changes to the Token Market Price Family for the period 30 June 2026 to 07 July 2026.
CF Benchmarks
By clicking Accept, you consent to CF Benchmarks's use of cookies.
Visit Cookie Settings to learn how CF Benchmarks uses cookies and to adjust your preferences.