
Mar 20, 2023
What’s driving relative strength in cryptocurrencies? Read the equity market tea leaves...
Since the spectacular demise of Silicon Valley Bank (SVB), we have seen a divergence in digital assets compared to other traditional risky assets. For example, the CF Diversified Broad Cap Index has rallied over 27% since the SVB debacle. Meanwhile, the S&P 500 Index is broadly unchanged. So, what are we to make of this dichotomy?
To better understand this, let us consider two potential catalysts for this divergence in performance:
• The sound money thesis
• Changes in interest rate expectations (or interest rate sensitivity)
The last major crypto-equity divergence occurred during fiat-currency crashes last October. This rally could be attributed to the “sound money” thesis. Bitcoin and other major cryptos emulate sound money through fixed (or even diminishing supply), which is transparently decentralized on an immutable blockchain ledger. Traditional fiat currency models run counter to these approaches and explicitly accept a moderate level of inflation to dilute purchasing power over time. Last fall, when the UK elected a new Prime Minister who proposed a potentially inflationary stimulus package, forex market volatility surged. The British Pound and the Euro both fell substantially, along with other traditional risky assets, such as equities. Meanwhile, the sound money thesis clearly experienced bids into markets with crypto prices rallying approximately 20% during this period of fiat uncertainty.
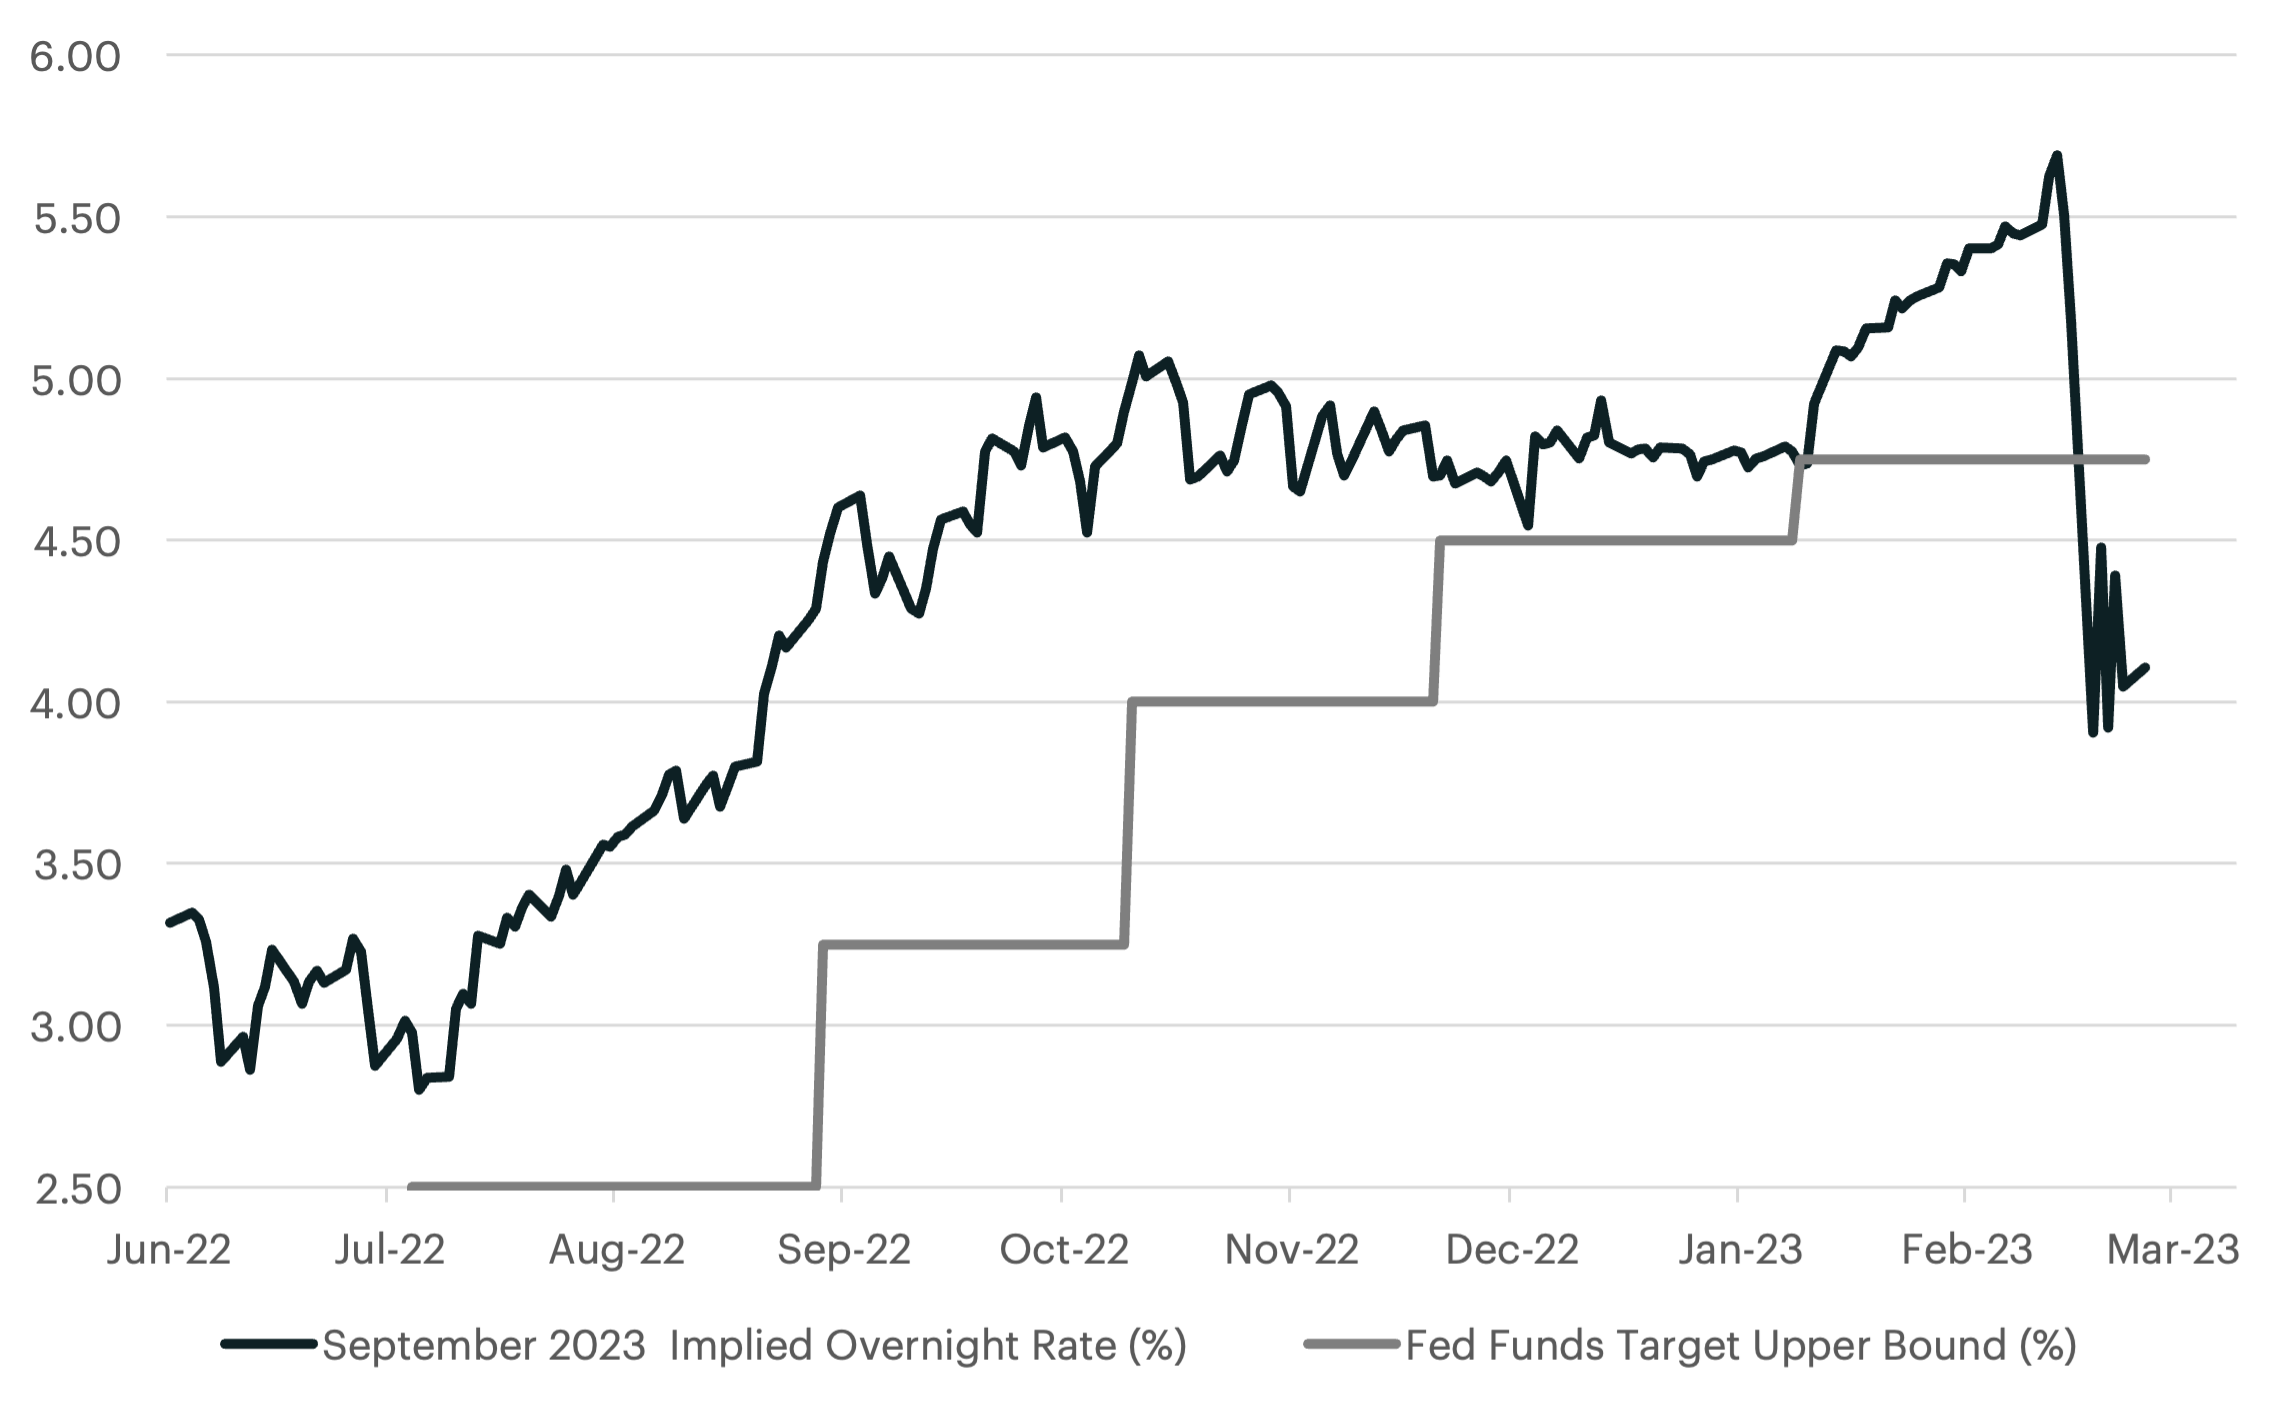
Now let us consider the second catalyst, a repricing in the Fed’s terminal rate. Markets are anticipating that we may be reaching a fed funds peak fairly soon (or perhaps we have already). In our 2023 outlook, we outlined that the Fed may have to cut rates sooner than some forecasters were anticipating. Since then, a few hotter than anticipated inflation prints have countered this initial view, but now that financial stability has come into question, our outlook is beginning to materialize. Below, we highlight the dramatic shift in the futures market implied September Fed Funds Rate, which was the forecasted terminal rate before SVB’s collapse. Markets now anticipate that this benchmark rate will yield approximately 4.0-4.5% come September. This is over 100bps lower from the pre-SVB banking crisis level. Furthermore, the current implied outlook for the Fed’s monetary landscape is for a possible pause in rate hikes, with an eventual 25bps cut coming as soon as mid-2023.
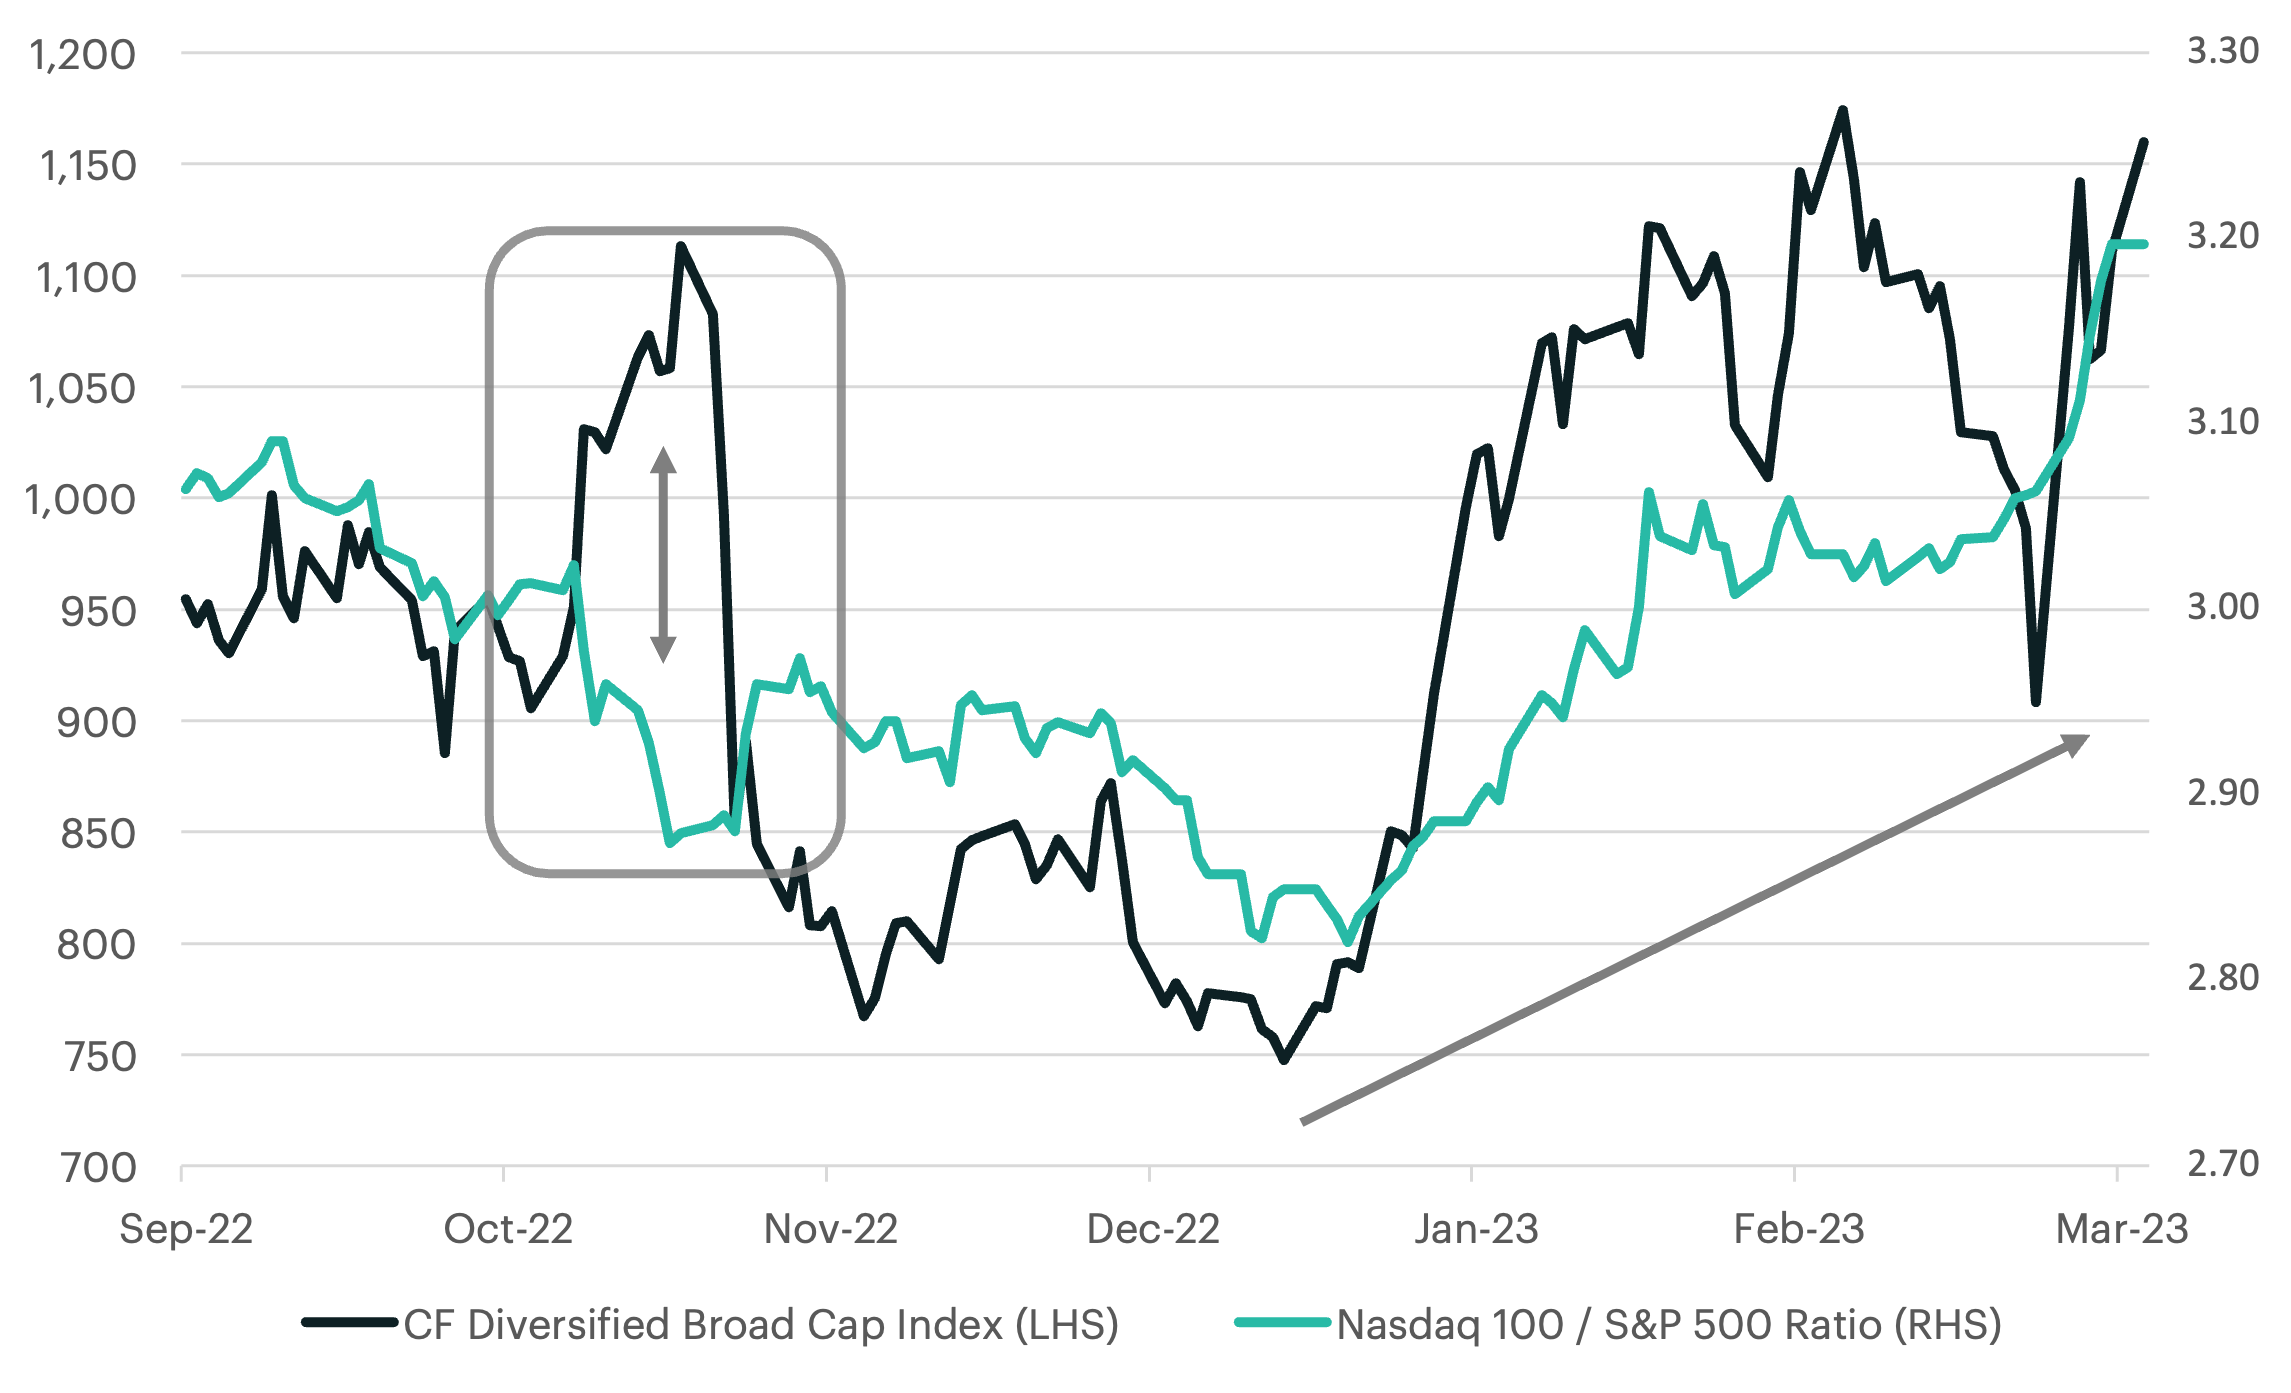
As we take a deeper look at the equity market performance, we can single out other assets that maintain higher sensitivities to changes in interest rate expectations. Much like crypto, growth-style companies are expected to provide cash flows, or some form of fundamental value, further out into the future than their non-growth peers. These assets find their performance more heavily influenced by shifts in interest rates. The Nasdaq 100 index, for example, is comprised of mostly growth-style sectors, such as technology companies, who are more sensitive to rising or falling rate expectations. If we compare the relative performance of this index to the S&P 500 index (as a simple ratio), we can show this measure is tracking the broader crypto market higher as well. This certainly bears credence to our interest rate expectations catalyst as this is different than the fiat currency scares from last October. This may also mean that the pricing divergence between equities and crypto markets may not be so wide as we initially thought.
Investors, traders, and other market participants have now seen a teaser for the “Fed pivot” playbook. Cryptos, along with growth-style risky assets, should continue to see market leadership if this regime change materializes. However, it is worth noting that crypto's deeper oversold technical levels from the end of last year will likely keep digital assets in pole position as we continue the 2023 racing season.
The information contained within is for educational and informational purposes ONLY. It is not intended nor should it be considered an invitation or inducement to buy or sell any of the underlying instruments cited including but not limited to cryptoassets, financial instruments or any instruments that reference any index provided by CF Benchmarks Ltd. This communication is not intended to persuade or incite you to buy or sell security or securities noted within. Any commentary provided is the opinion of the author and should not be considered a personalised recommendation. Please contact your financial adviser or professional before making an investment decision.
Note: Some of the underlying instruments cited within this material may be restricted to certain customer categories in certain jurisdictions.
Factor Friday - June 26, 2026
Growth and Value led the factor rankings for the week ending June 25 as momentum-driven positioning continued to unwind - Momentum finished last, extending its YTD loss to -7.14%. Size remains the top YTD performer.

Gabriel Selby
Suspension of itBit Paxos as a Constituent Exchange from Certain CME CF Cryptocurrency Pricing Products
Suspension of itBit Paxos as a Constituent Exchange from Certain CME CF Cryptocurrency Pricing Products
CF Benchmarks
Suspension of itBit Paxos as a Constituent Exchange from Certain CF Digital Asset Index Family Benchmarks
Suspension of itBit Paxos as a Constituent Exchange from Certain CF Digital Asset Index Family Benchmarks
CF Benchmarks
By clicking Accept, you consent to CF Benchmarks's use of cookies.
Visit Cookie Settings to learn how CF Benchmarks uses cookies and to adjust your preferences.