
Sep 08, 2025
Weekly Index Highlights, September 8, 2025
Market Performance Update
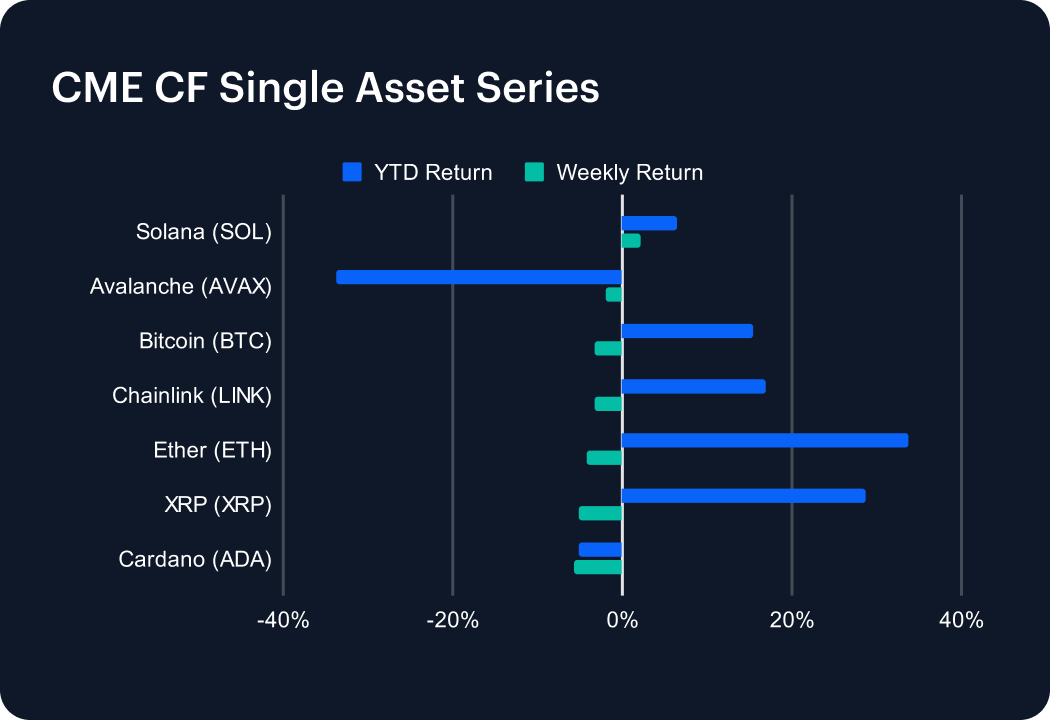
In a constructive week for digital assets, major tokens largely held firm, with several staging notable rebounds. XRP led the pack, rallying 4.58% to expand its YTD advance to an impressive 32.54%. Avalanche gained 3.22%, easing its drawdown to –31.79%, while Cardano added 2.45%, bringing its 2025 return closer to breakeven at –3.68%. Bitcoin maintained upward momentum, climbing 1.92% for an 18.32% gain this year, and Solana’s 1.85% rise lifted it to 6.88% YTD. While Ether dipped 2.07%, it still boasts a strong 29.01% performance, and Chainlink’s modest 2.63% pullback leaves it with double-digit gains at 10.19%. The week’s action suggests a healthy rotation of capital, with the assets that led in previous weeks pulling back.
Sector Analysis
The DACS landscape turned more uneven, with leadership shifting sharply across categories. In Finance, Trading saw fireworks from Loopring (+20.81%), vaulting well above the –2.16% sub-category average, while Curve (–8.89%) and Balancer (–6.57%) dragged the cohort. Borrowing & Lending stayed pressured, with Compound (–3.66%) and Spell (–6.55%) exhibiting weakness. Programmable Settlement fared worse, despite Solana’s gain (+2.23%), the sub-category averaged –4.30% as HBAR (–7.01%), Algorand (–9.60%), and Tezos (–10.49%) exhibited continued weakness. Non-Programmable Settlement also slipped, with Litecoin (–1.54%) exhibiting relative strength as XRP (–5.06%) and Stellar (–9.70%) weighed on the sub-category. Infrastructure stood out as Polygon surged 14.21%, easily eclipsing a –2.15% average, while Arbitrum (–8.56%) marked sharp underperformance. In Culture, LPT (+11.79%) and BONK (+6.60%) staged impressive rallies, while PRIME (–12.30%) and SUPER (–8.00%) lagged.
CF Staking Series
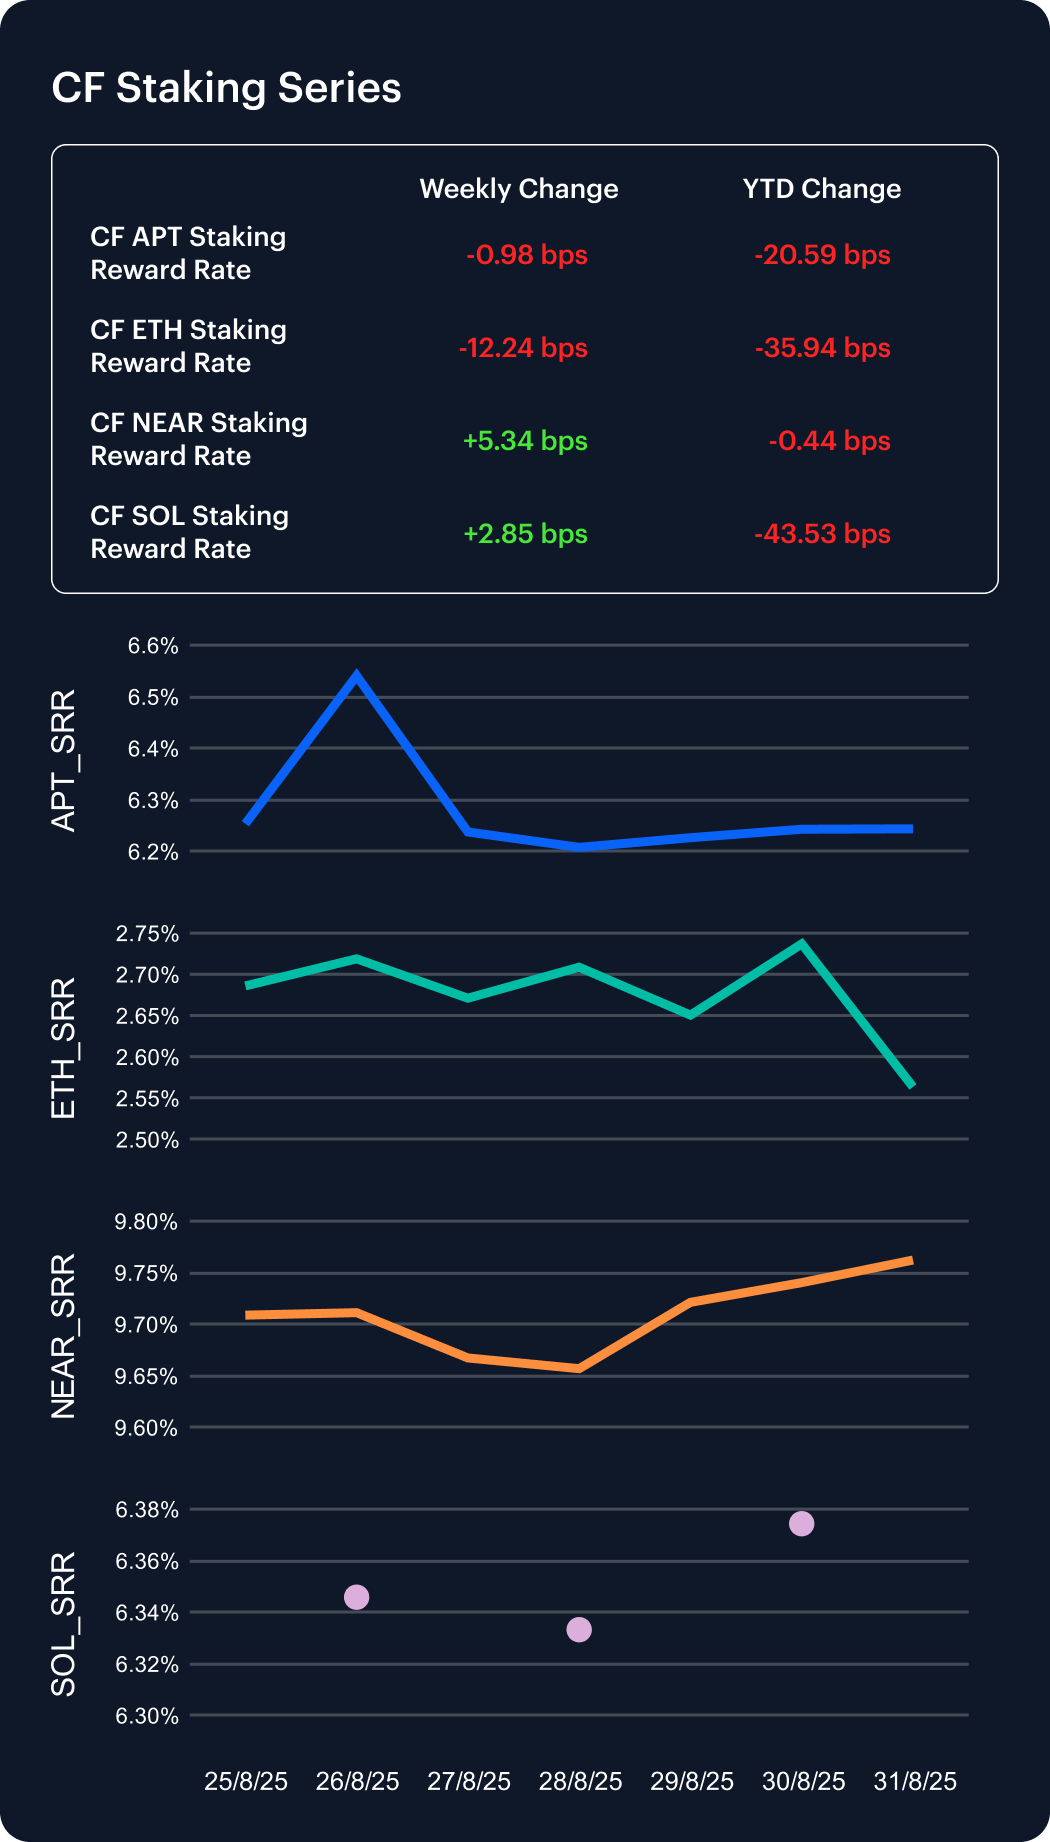
Validator economics showed mixed signals this week, with dispersion across majors underscoring the challenge of sustaining yields in 2025. NEAR continued to distinguish itself, with its annualized reward rate rising 10.61 bps to 9.88%, leaving it the only network in positive territory YTD at +5.40 bps (+0.55%). Aptos also posted gains, adding 3.11 bps to reach 6.27%, though cumulative losses of 18.64 bps (–2.89%) keep it underwater. Ethereum edged higher by 0.63 bps to 2.67%, yet remains the weakest performer overall with a 33.14 bps decline (–11.34%) YTD. Solana was the notable laggard, sliding 11.37 bps to 6.24% and extending its 57.04 bps erosion (–8.38%).
Market Cap Index Performance
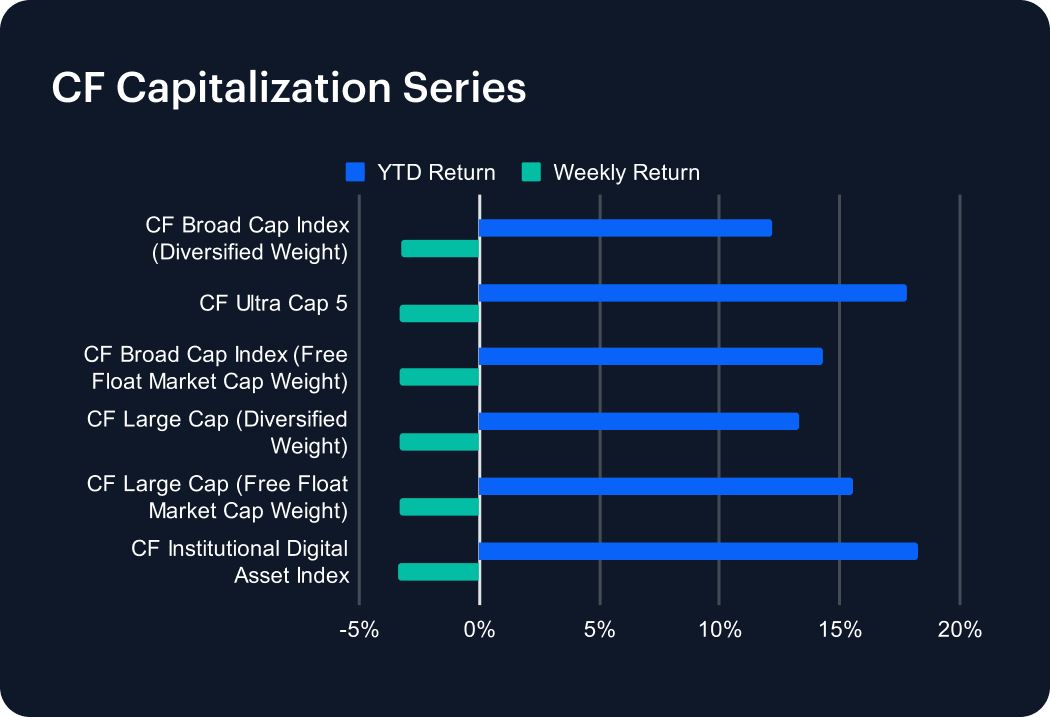
The CF Capitalization Series extended its positive trajectory last week, indicative of strength across the market. The CF Broad Cap (Diversified Weight) advanced 1.43%, pushing its YTD gain to 12.86%, while the CF Large Cap (Diversified Weight) rose 1.35%, underscoring steady leadership with a 13.95% return YTD. Free-float measures continued to outperform, with the CF Broad Cap Index climbing 1.54% to 15.98% YTD and the CF Large Cap (Free Float) adding 1.50% to secure a commanding 17.30% gain. Among flagships, the CF Ultra Cap 5 gained 1.47%, extending its rally to 19.56%. The CF Institutional Digital Asset Index also strengthened, rising 1.20% and retaining its position as top performer with a 19.96% return, signaling that Bitcoin and Ether have remained the leaders in 2025.
Classification Series Analysis
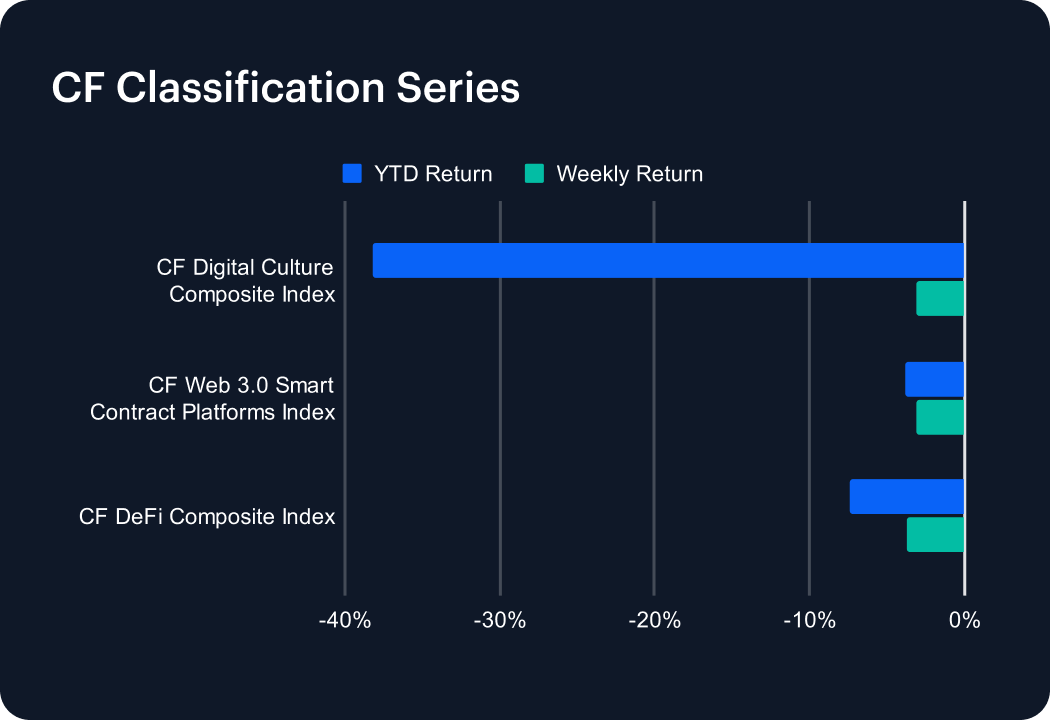
The CF Classification Series showed signs of stabilization last week, with gains across risk-sensitive segments offset by persistent weakness in DeFi. The CF Digital Culture Composite Index rebounded 3.28%, narrowing its YTD decline to –37.27%. Despite the advance, high-beta tokens continue to face headwinds. The CF Web 3.0 Smart Contract Platforms Index also rose, gaining 1.36% to reduce its 2025 loss to –3.88%. In contrast, the CF DeFi Composite Index slipped 0.26%, modestly extending its YTD decline to –9.73%. The dispersion underscores uneven conviction across speculative digital asset themes.
Volatility Analysis
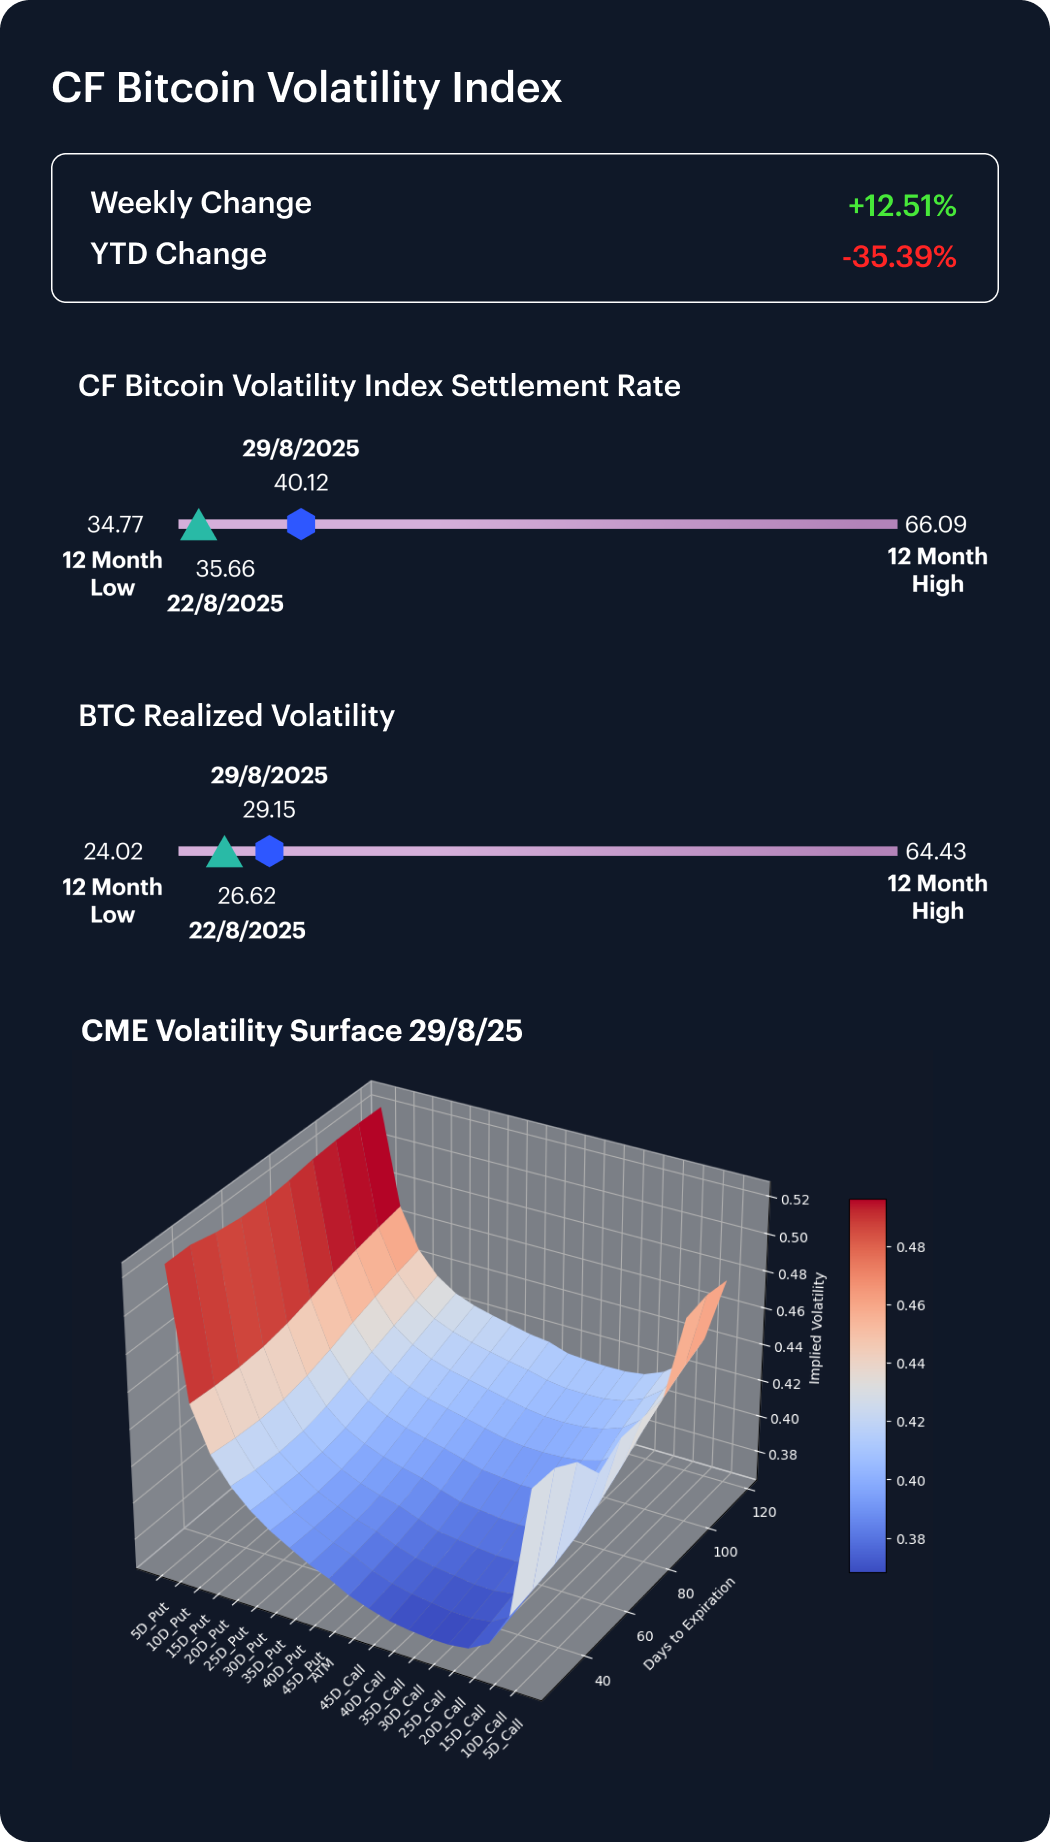
The CF Bitcoin Volatility Index Settlement Rate (BVXS) eased 5.58% last week, slipping from 40.12 to 37.88, and now sits 39.0% below its January level while holding above the 12-month low of 34.77. Realized volatility moderated alongside, dipping from 29.15 to 28.42, though it remains well off this year’s trough of 24.02. Skew stayed negative, reflecting persistent demand for downside protection, with implied volatility on out-of-the-money puts continuing to rise across maturities. Convexity remains elevated, leaving short-dated implied volatility (IV) softer while longer-dated tenors see higher levels of IV. The overall setup suggests market participants are largely engaged in downside hedging rather than speculative call buying.
Interest Rate Analysis
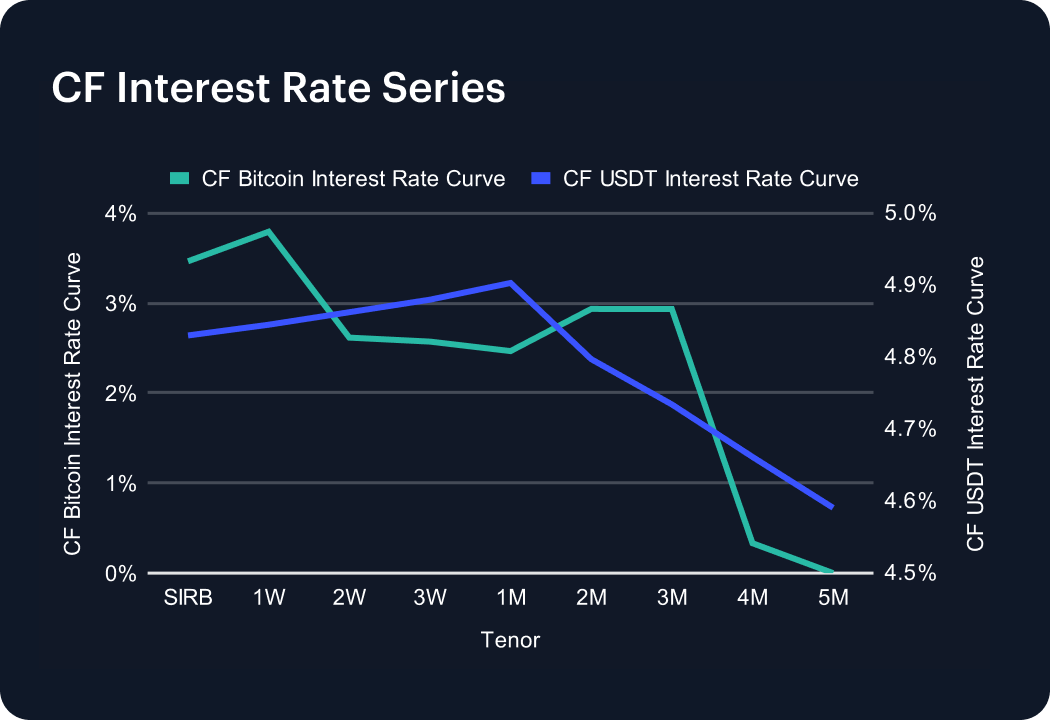
USDT funding remained resilient, with the curve holding between 4.87% and 4.90% across the front end before easing to 4.55% at five months. While below the highs seen earlier this year, the modestly downward-sloping structure reflects steady demand for stablecoin liquidity across the curve. The slight premium at the short end signals appetite for immediate USDT access, while softer levels further out suggest expectations of gradual easing. By contrast, Bitcoin funding weakened, slipping from 3.53% at one week to near zero beyond four months, underscoring the differentiated role of stablecoins as leverage collateral relative to BTC.
The information contained within is for educational and informational purposes ONLY. It is not intended nor should it be considered an invitation or inducement to buy or sell any of the underlying instruments cited including but not limited to cryptoassets, financial instruments or any instruments that reference any index provided by CF Benchmarks Ltd. This communication is not intended to persuade or incite you to buy or sell security or securities noted within. Any commentary provided is the opinion of the author and should not be considered a personalised recommendation. Please contact your financial adviser or professional before making an investment decision.
Note: Some of the underlying instruments cited within this material may be restricted to certain customer categories in certain jurisdictions.
Changes to the Token Market Price Benchmarks Series - Market Prices – 21 July 2026
The Administrator has confirmed changes to the Token Market Price Family for the period 14 July 2026 to 21 July 2026.

CF Benchmarks
Softer CPI Reprices July Hike Risk & Lifts Digital Assets
Digital assets extended their recovery over the past week as cooler US inflation prints repriced Fed expectations; the bid was broad across the large cap indices, growth factor leadership returned, stablecoin funding repriced lower, and stress stayed isolated in names hit by token-specific news.
Mark Pilipczuk
Notice of the Demising of CF Dai-Dollar Settlement Price and Spot Rate
The Administrator announces that it will demise the CF Dai-Dollar Settlement Price (DAIUSD_RR) and CF Dai-Dollar Spot Rate (DAIUSD_RTI) which are members of the CF Digital Asset Index Family.
CF Benchmarks
By clicking Accept, you consent to CF Benchmarks's use of cookies.
Visit Cookie Settings to learn how CF Benchmarks uses cookies and to adjust your preferences.