
Oct 20, 2025
Weekly Index Highlights, October 20, 2025
Market Performance Update
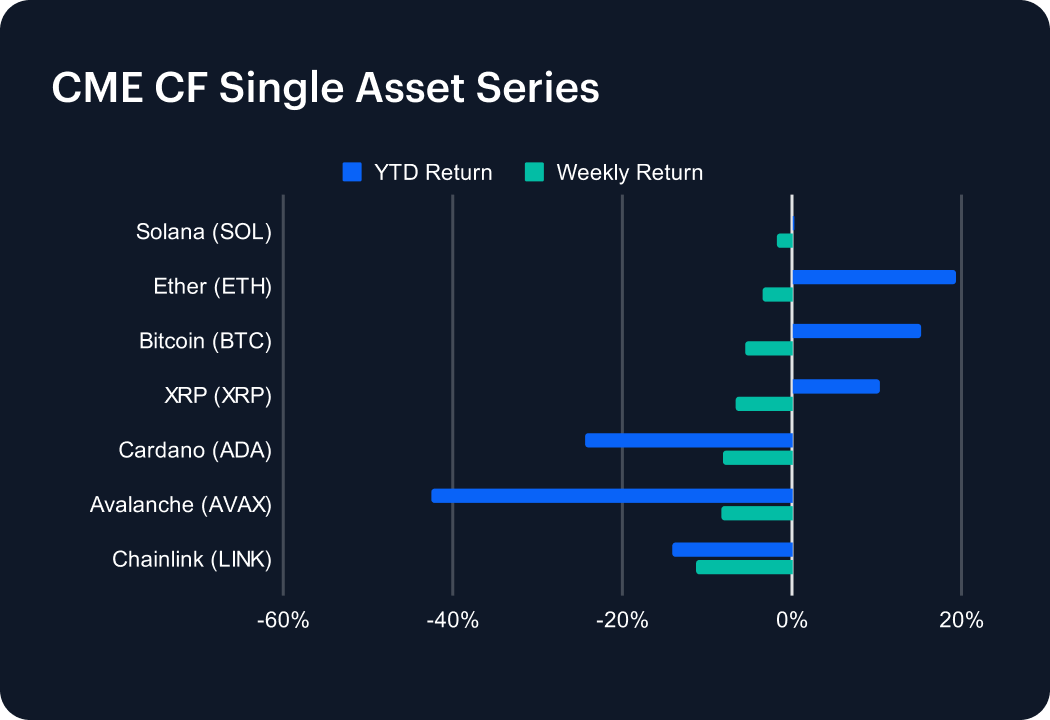
Mega caps posted another definitive week of significant losses, as early-October momentum unwound anew. Bitcoin relapsed −5.59%, Ether reversed −3.39%, and Solana lost −1.83 %. Lower-tier majors compounded the overall impression of collapse across the CME CF Single Asset view of high-profile, high-capitalization tokens: XRP slid −6.62%, Cardano (ADA) −8.16%, Avalanche (AVAX) −8.34%, and Chainlink (LINK) fell hard, −11.24%. Nevertheless, the tone still qualifies as corrective rather than disorderly, with breadth fading perceptibly, amid a rotation back toward relative defensives. Year-to-date performance remains positive for BTC (+15.23%) and ETH (+19.39%) but negative across the remainder of the cohort.

Sector Analysis
Through the CF Digital Asset Classification Structure (CF DACS) lens, sector performance was sharply negative week-on-week, with only isolated pockets of strength. In Finance, Borrowing & Lending posted a lone material gain via COMP +4.83%, while Derivatives led declines (SNX −36.03%). Trading also fell, e.g., UNI −6.43%, 1INCH −9.64%; alongside Stablecoin Issuance & Management (MKR −5.04%). In Services, the Computing Segment was hit hard (FET −26.32%, HNT −12.55%, RENDER −9.16%). Similar weakness followed across the following Segments: Oracles (LINK −11.24%), Interoperability (ZRO −12.67%, QNT −8.39%), and Scaling (STRK −13.41%, OP −8.05%). In Settlement, the worst-hit General Purpose Smart Contract Platforms tokens were: APT −14.00%, NEAR −10.28%, and ICP −11.03%. For Culture, both Gaming and Meme Coins lagged most: e.g., IMX −8.88%, SUPER −10.43%; and RARI −15.97%. Dispersion was wide, but the profile remained orderly, consistent with de-risking rather than disorder.
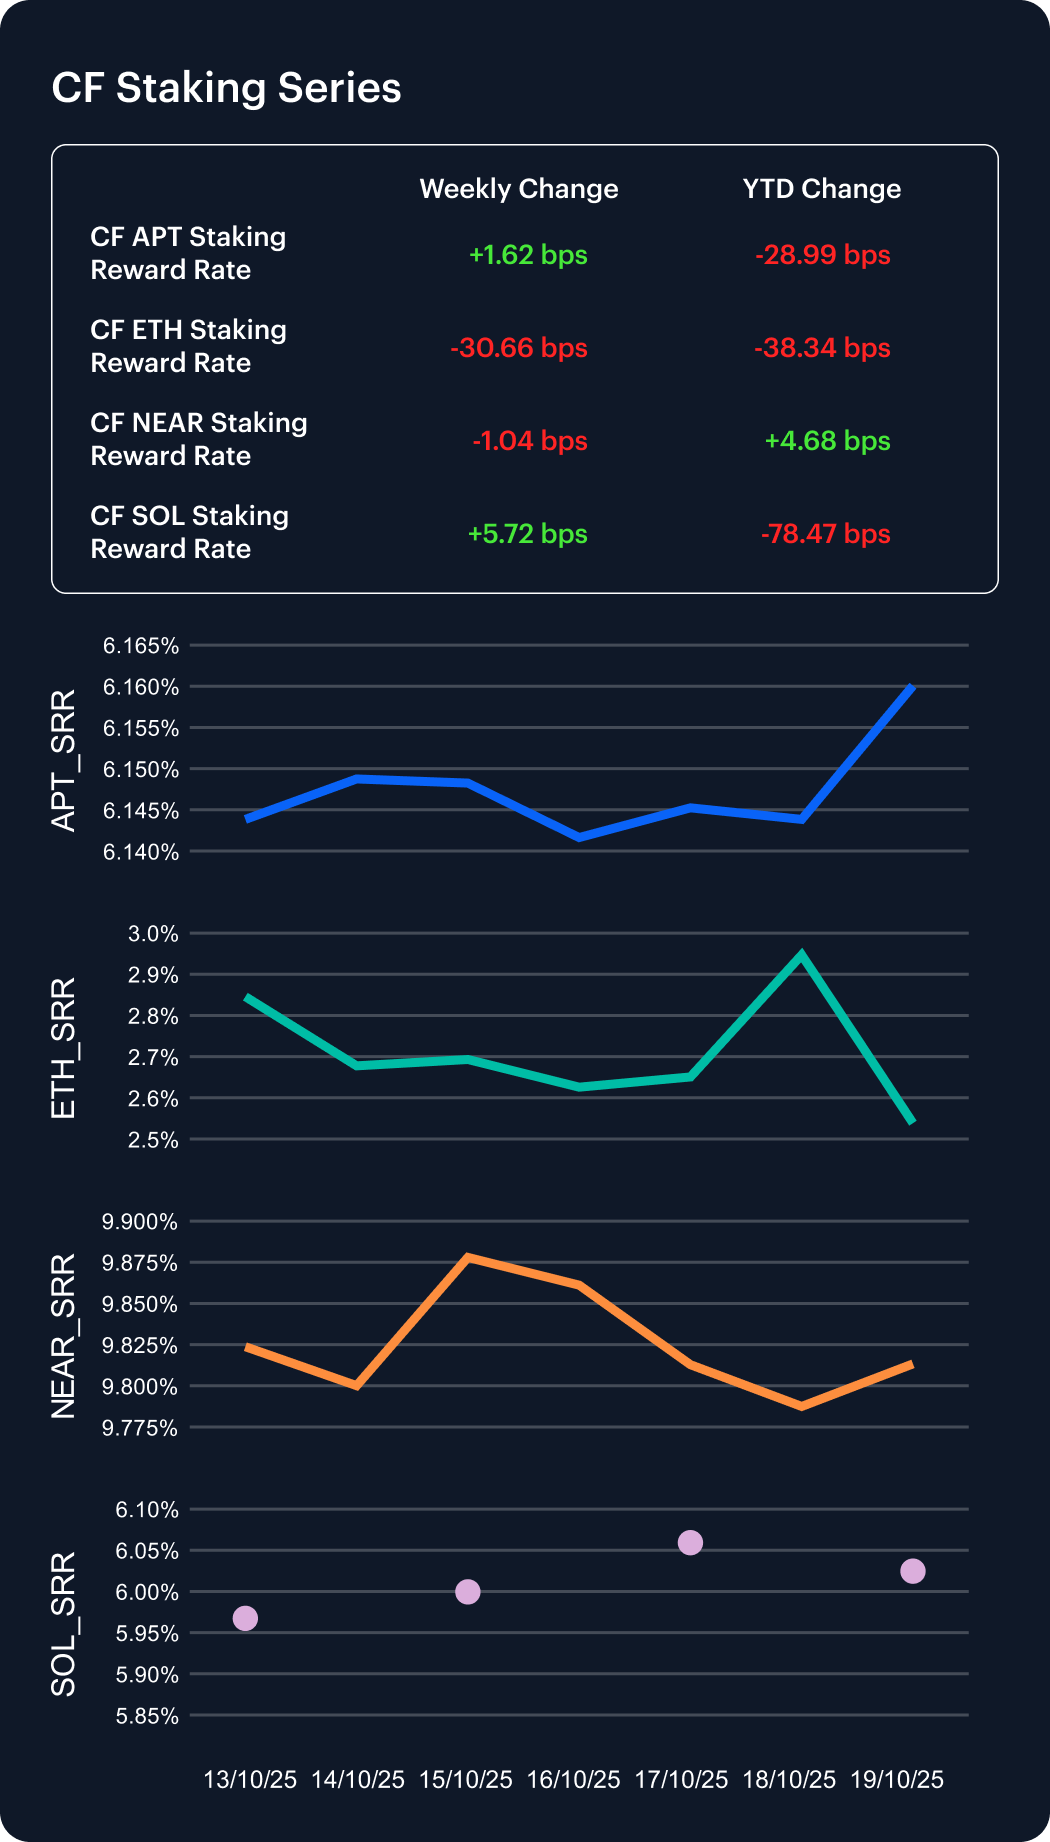
CF Staking Series
Staking indices diverged week-on-week. APT edged higher, +0.26% (+1.62 bps reward-rate), and SOL staking too, +0.96% (+5.72 bps), while NEAR staking weakened: −0.11% (−1.04 bps) and ETH staking exhibited the strongest chill with a −10.77% decline (−30.66 bps). Moves seem to reflect index-level staking carry and reward-rate shifts, rather than spot returns. The net picture is mixed, with ETH showing the clearest weekly compression in carry.
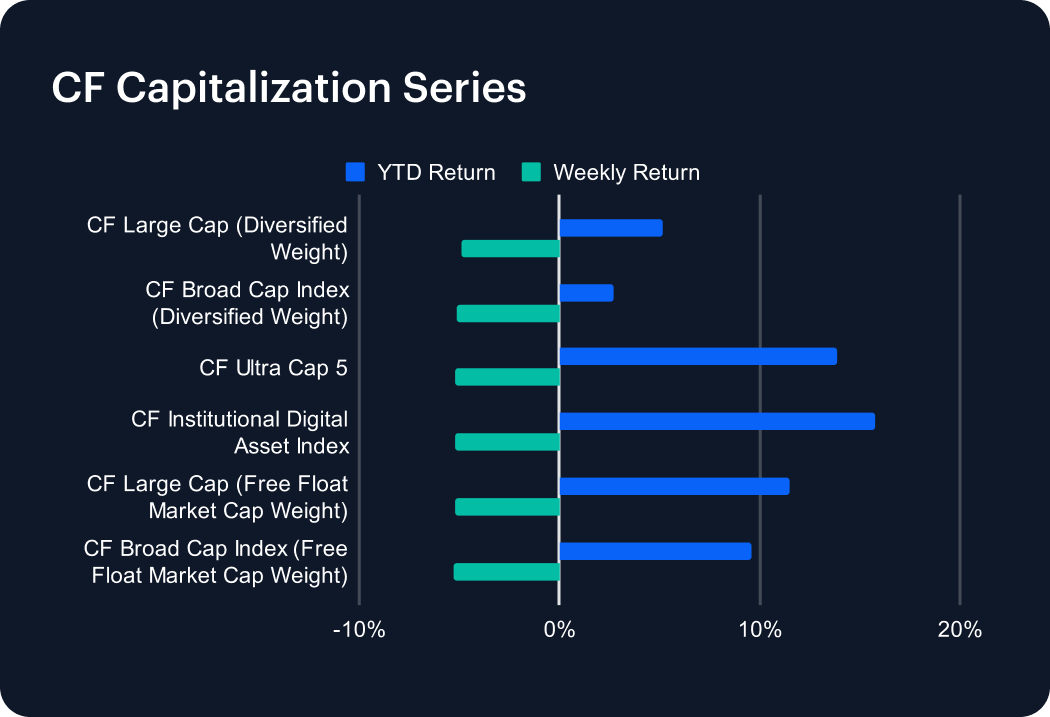
Market Cap Index Performance
Week-on-week falls across size tiers were synchronous with banner returns across the space. CF Broad Cap Index (Diversified Weight) slid −5.16%, CF Large Cap (Diversified Weight) −4.92%, CF Ultra Cap 5 −5.22%, and CF Institutional Digital Asset Index −5.23%. The free-float variants declines were as follows: CF Broad Cap Index (Free Float Market Cap Weight) −5.31%, and CF Large Cap (Free Float Market Cap Weight) −5.23%.
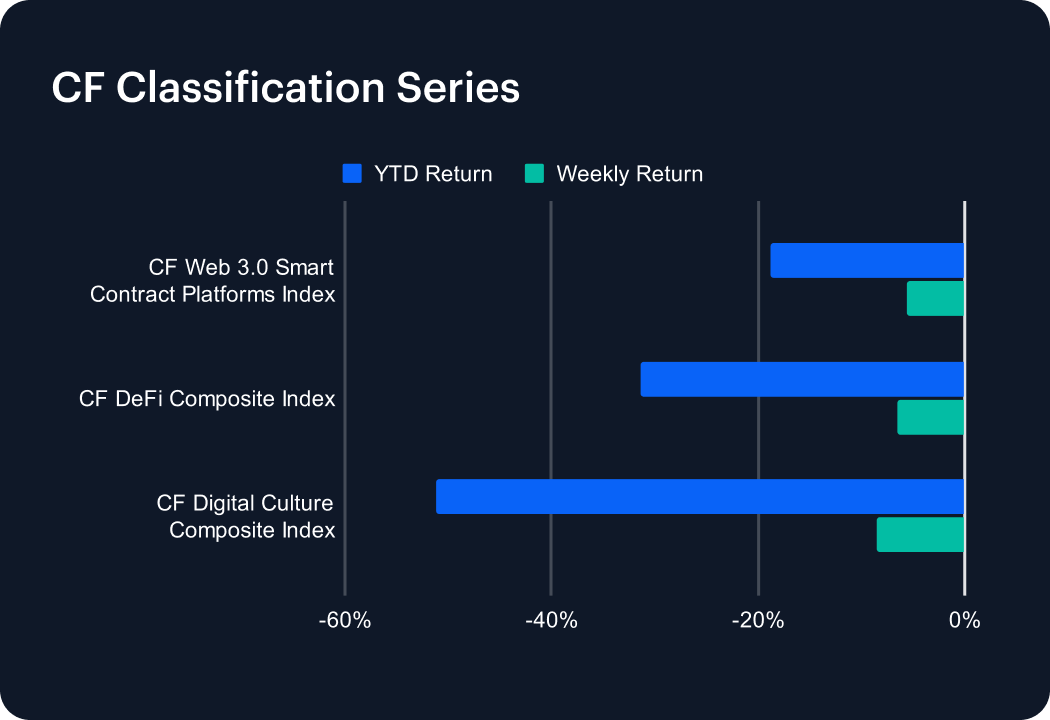
Classification Series Analysis
Thematics weakened in-kind. CF Web 3.0 Smart Contract Platforms Index was down −5.56%, CF DeFi Composite Index −6.47%, and, reflecting a relatively deeper loss of favor in this group, the CF Digital Culture Composite Index lost −8.47%. This mirrors prior de-risking phases in which utility-weighted sectors hold up better than attention-driven themes. Year-to-date losses deepened marginally, leaving classification indices trailing capitalization composites.
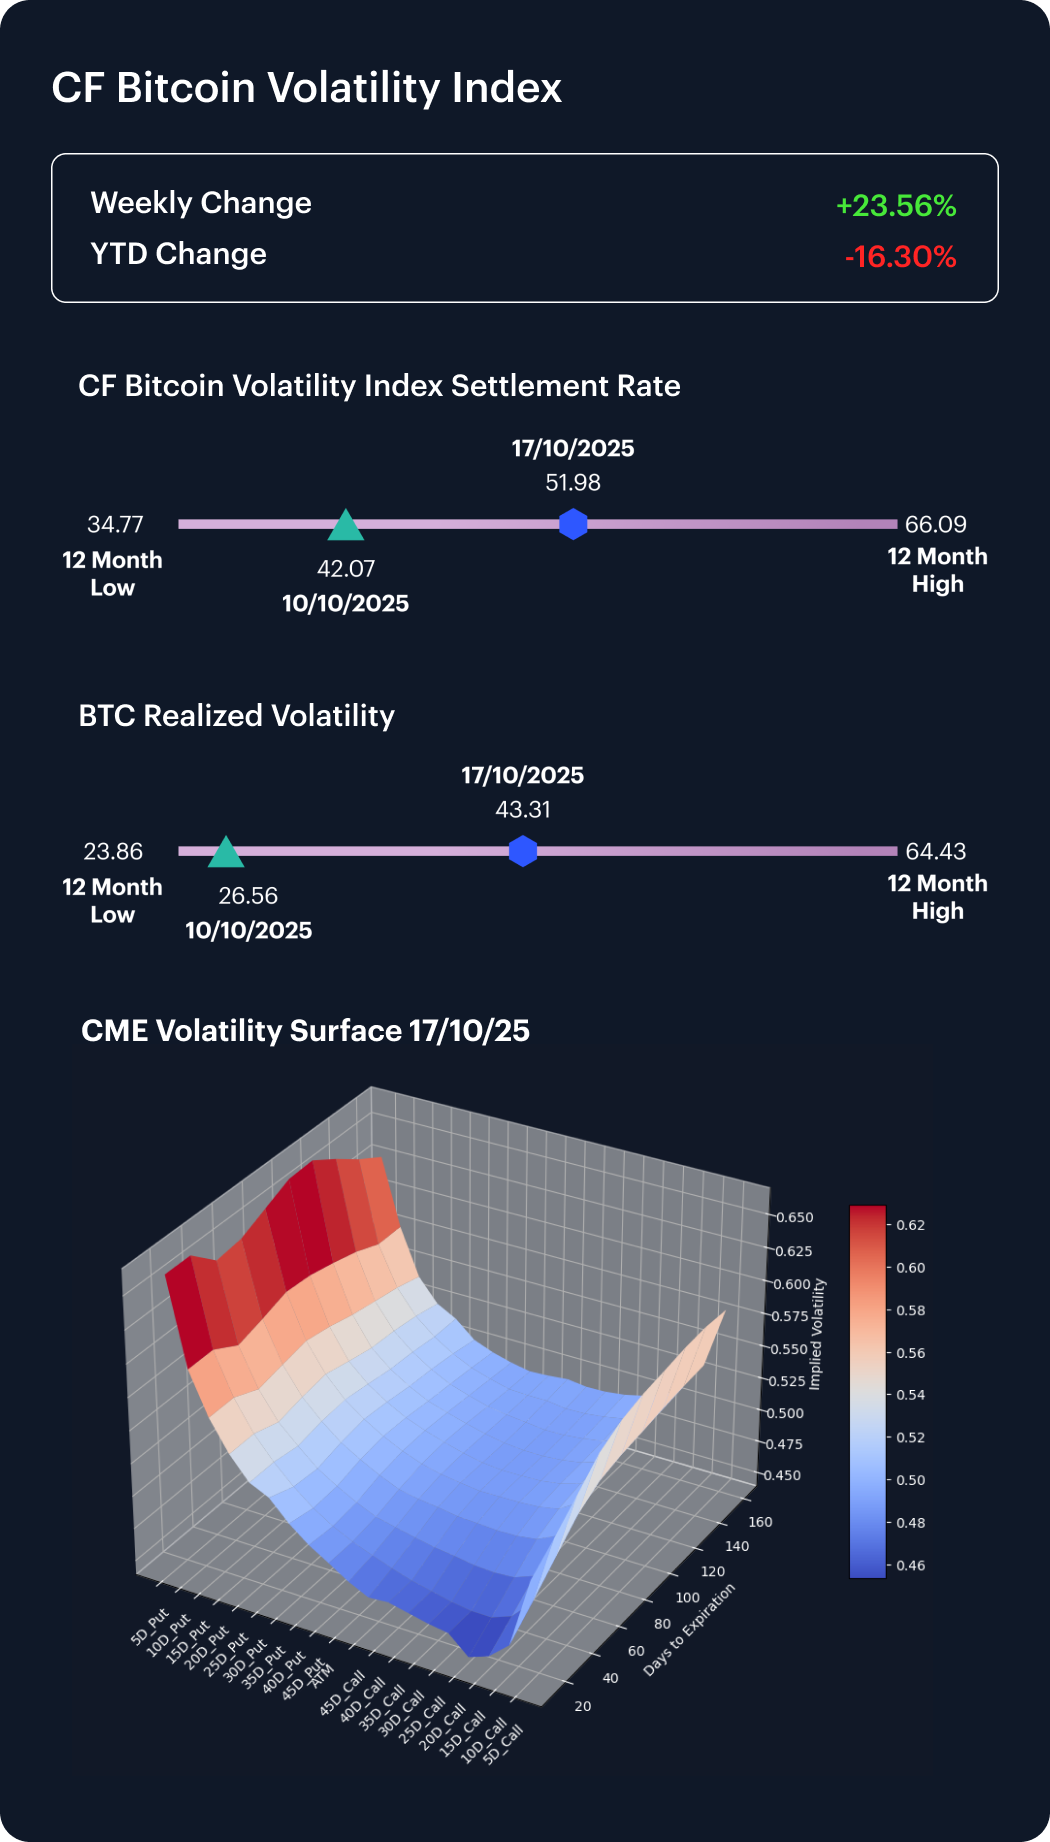
Volatility Analysis
Bitcoin implied and realized volatility both jumped, with realized advancing at the fastest pace for weeks: rising from 26.56 to 43.31 (+16.75 pts). BVX rose from 42.07 to 51.98 (+9.91 pts). With realized rising more than implied, the implied–realized gap narrowed from ~15.5 points to ~8.7 points, indicating follow-through in underlying returns rather than a pure hedging bid. Levels sit well above recent lows. 12-month lows: BVX, 34.77; realized, 23.86; though they’re still below 12-month highs: BVX, 66.09; realized, 64.43. This leaves the surface firm but orderly.
Interest Rate Analysis
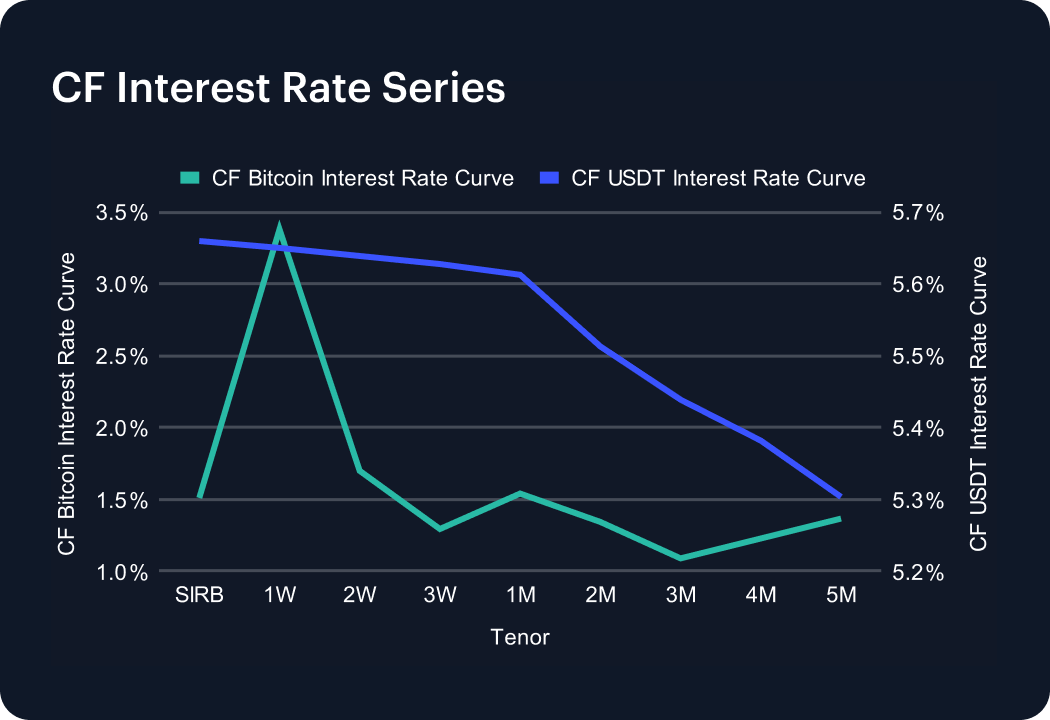
Week-on-week, both curves fell across the strip. Bitcoin’s short-term SIRB printed at 1.51% (from 3.07%, −1.56 pp), while 1-Month moved to 1.54% from 3.54%, −2.00 pp. On the USDT side, 1-Week eased to 5.65% from 6.86%, −1.21 pp; and 1-Month to 5.61% from 6.92%, −1.31 pp. Bitcoin’s term structure thereby remains shallow with pronounced front-end compression versus the prior week; USDT’s slopes modestly downward from 1W through 5M. The read-through is steady BTC funding at the very front, with softer term premia beyond 1W, while USDT carry is gradually lower across the curve.
The information contained within is for educational and informational purposes ONLY. It is not intended nor should it be considered an invitation or inducement to buy or sell any of the underlying instruments cited including but not limited to cryptoassets, financial instruments or any instruments that reference any index provided by CF Benchmarks Ltd. This communication is not intended to persuade or incite you to buy or sell security or securities noted within. Any commentary provided is the opinion of the author and should not be considered a personalised recommendation. Please contact your financial adviser or professional before making an investment decision.
Note: Some of the underlying instruments cited within this material may be restricted to certain customer categories in certain jurisdictions.
Changes to the Token Market Price Benchmarks Series - Market Prices – 21 July 2026
The Administrator has confirmed changes to the Token Market Price Family for the period 14 July 2026 to 21 July 2026.

CF Benchmarks
Softer CPI Reprices July Hike Risk & Lifts Digital Assets
Digital assets extended their recovery over the past week as cooler US inflation prints repriced Fed expectations; the bid was broad across the large cap indices, growth factor leadership returned, stablecoin funding repriced lower, and stress stayed isolated in names hit by token-specific news.
Mark Pilipczuk
Notice of the Demising of CF Dai-Dollar Settlement Price and Spot Rate
The Administrator announces that it will demise the CF Dai-Dollar Settlement Price (DAIUSD_RR) and CF Dai-Dollar Spot Rate (DAIUSD_RTI) which are members of the CF Digital Asset Index Family.
CF Benchmarks
By clicking Accept, you consent to CF Benchmarks's use of cookies.
Visit Cookie Settings to learn how CF Benchmarks uses cookies and to adjust your preferences.