
Nov 04, 2024
Weekly Index Highlights, November 4, 2024
Get a comprehensive recap of how our leading reference rates and indices performed for the week of October 28 to November 3, 2024. Whether you’re tracking market trends or looking to make data-driven decisions, our insights have you covered.
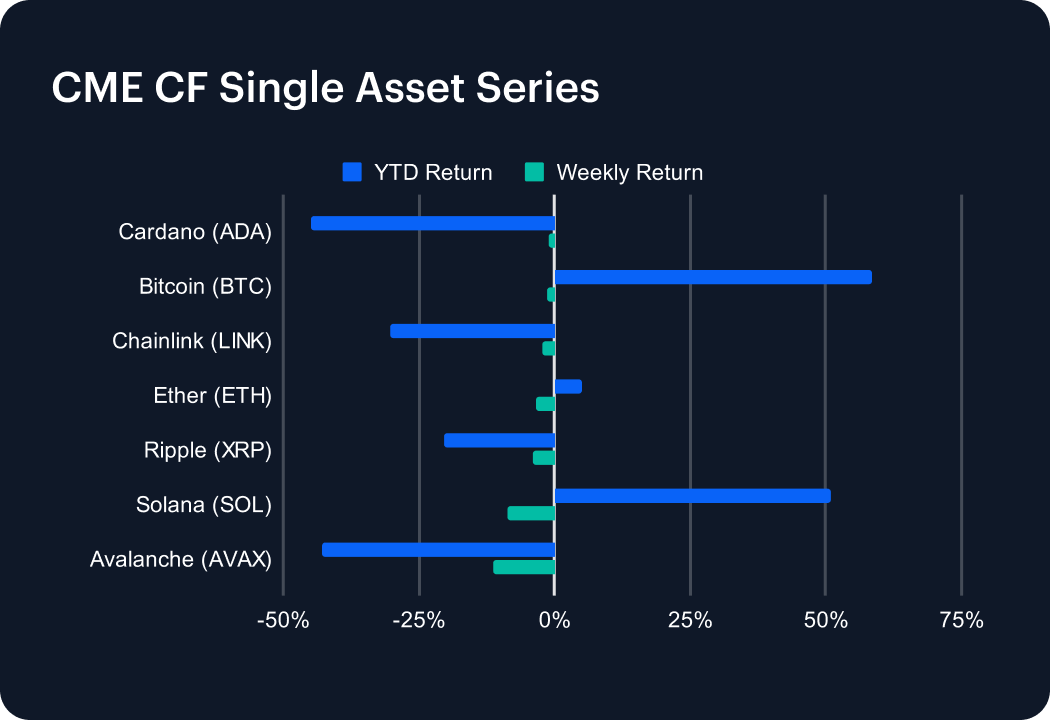
Markets largely remained on a cautious footing into the final few days ahead of the U.S presidential election. Optimism that had helped drive Bitcoin close to a fresh record high in the prior week turned more measured, in step with a moderation of betting market odds and polling data favouring former President Donald Trump. All CME CF Single Asset Series indices retreated, though Avalanche (AVAX) and Solana (SOL), which markedly outperformed recently, fell the most over the week; losing -8.81% and -11.30% respectively.
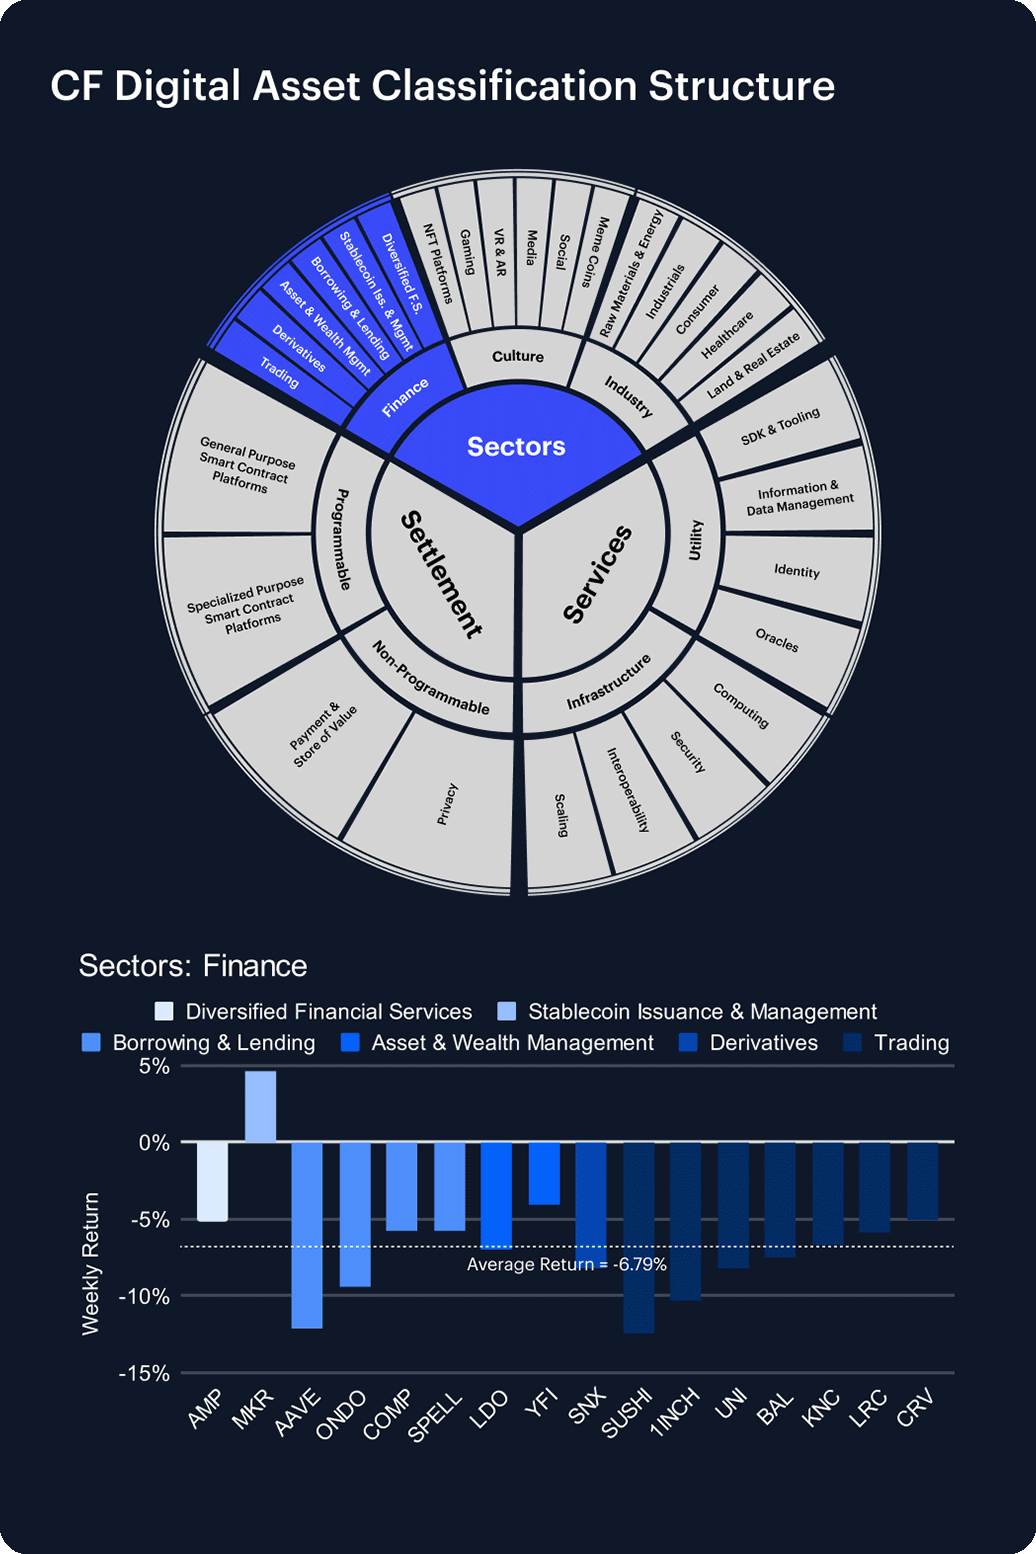
Evaporating risk appetite was also evident across CF DACS sub-categories, with a few exceptions. That said, the +15.86% weekly advance of Biconomy (BICO) comes with the proviso of its sub-$200 million market capitalization. BICO focuses on gas cost reduction and simplifying transactions, placing it in the SDK & Tooling segment of CF DACS’s Utility sub-category; which dropped -2.98% on average. More substantially, SUI, token of the eponymous layer-1 platform, added + 9.75%, following the launch of a private placement for the forthcoming Grayscale SUI Trust. Meanwhile, the +4.59% added by MKR softened the DeFi sub-category’s slide to an average of -6.79%.
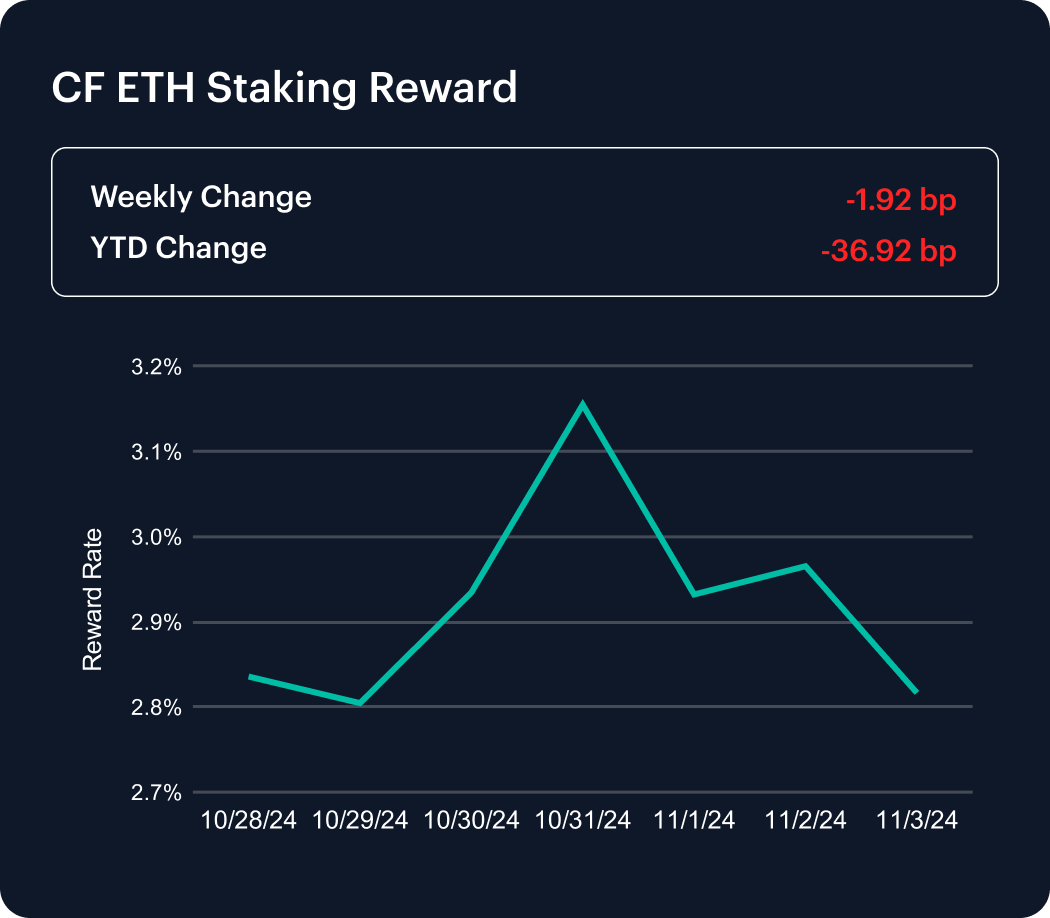
A more tentative week for ETH staking rewards saw the CF ETH Staking Reward Rate change tick back by just 1.92 basis points (bp), equating to -0.68%; its second lower weekly change in 5 weeks.
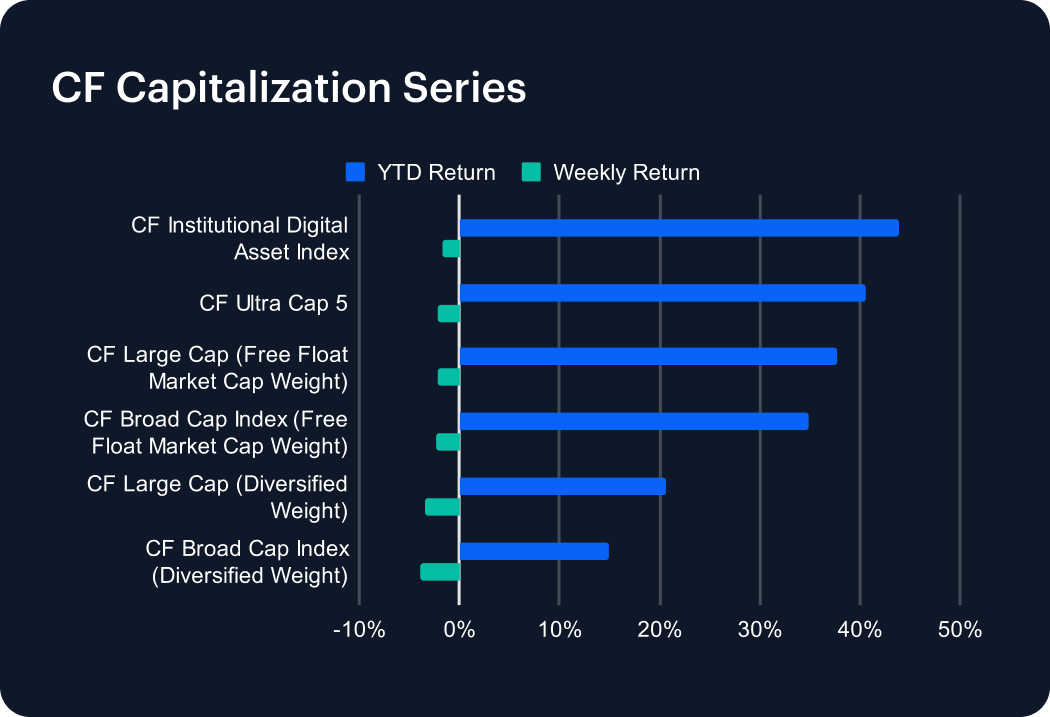
CF Capitalization Series indices all edged back somewhat, in line with the broad market uncertainty. Once again, the key tentative differential tends to indicate the relative resilience of the mega caps, with the CF Institutional Digital Asset Index falling -1.68% for the week, and the CF Ultra Cap 5 losing -2.09%. Meanwhile, the CF Large Cap (Diversified Weight) gauge dipped -3.48%, and the CF Broad Cap Index (Diversified Weight) dropped by -3.87%.
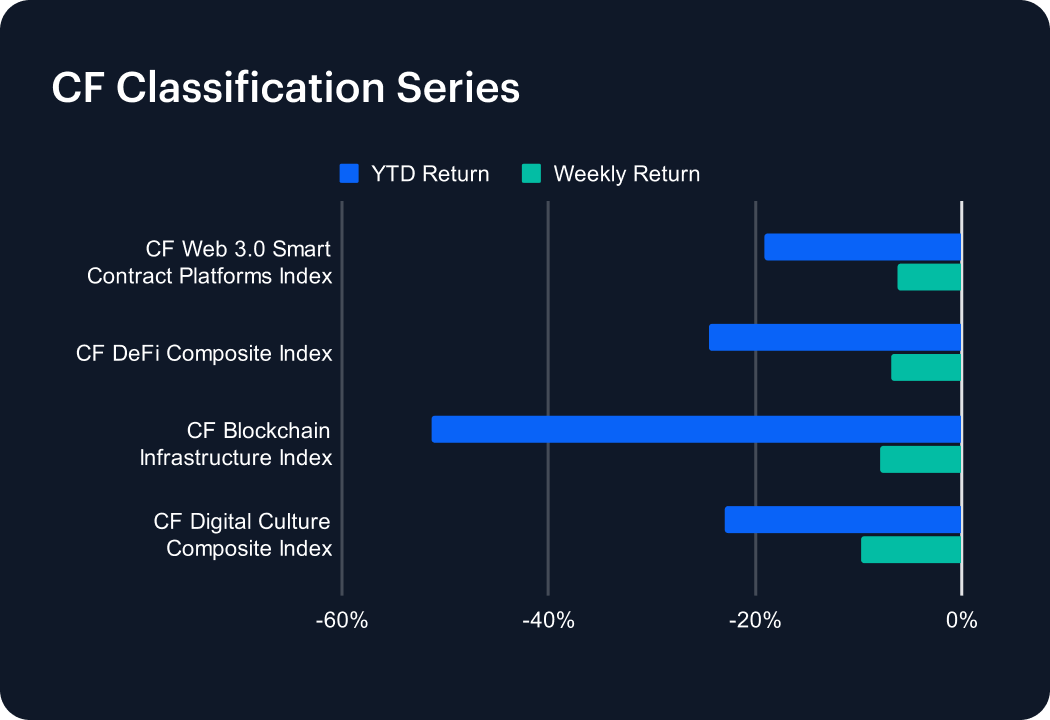
The 9.75% weekly rise of SUI, spotlighted in the CF DACS section, enabled a nominal relative outperformance of the CF Web 3.0 Smart Contract Platforms Index, which slid -6.29%. A similar scenario for the CF DeFi Composite Index, which lost a weekly -6.86%; somewhat offset by the +4.59% rise of MKR. By contrast, the CF Digital Culture Composite Index ended the week down -9.77%, and the CF Blockchain Infrastructure Index decreased -7.85%.
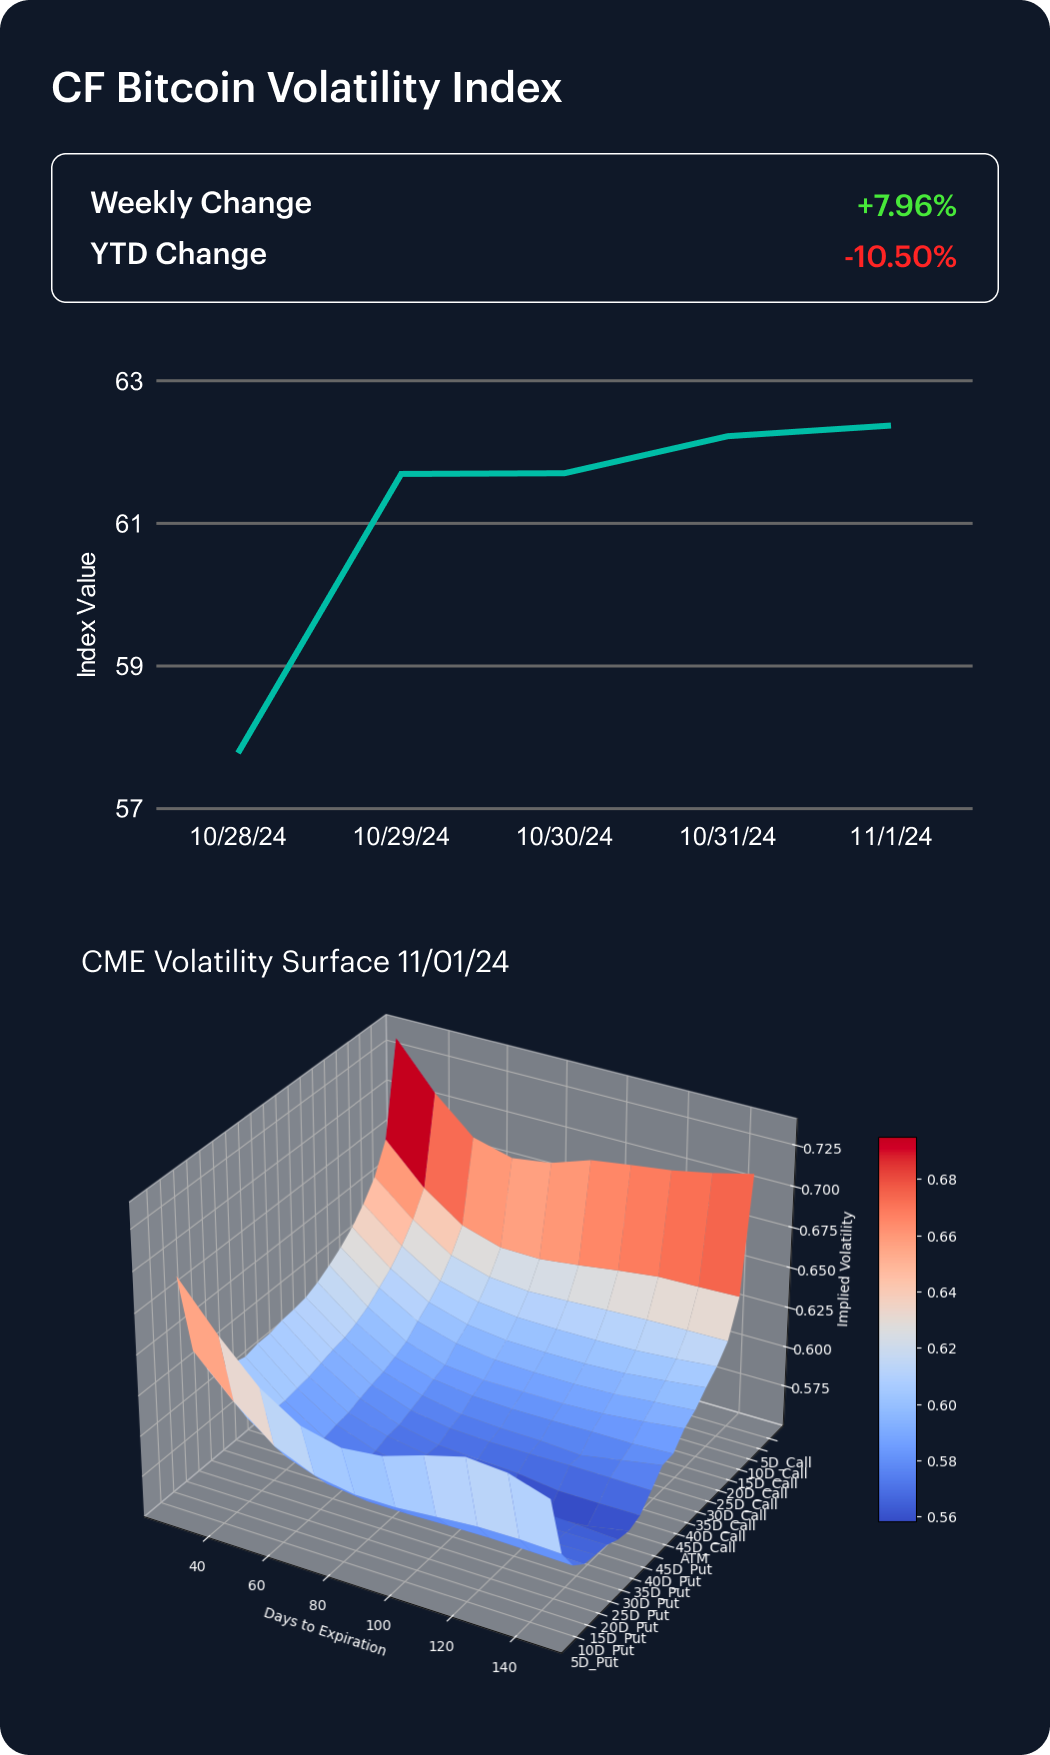
BVXS confirms implied volatility in the institutionally focused CME Bitcoin options market is on the rise heading into the U.S. election. The weekly change in the index was a definitive +7.96%, leaving the YTD change to stand at -10.50%.
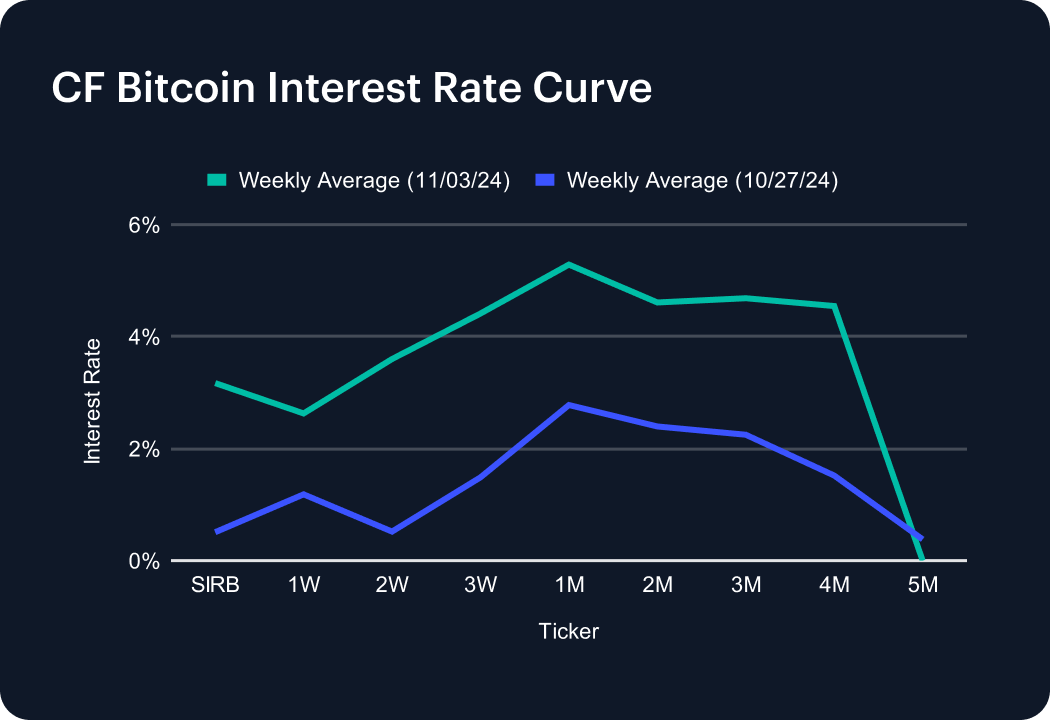
Moderate changes in the term structure imply most activity was again focused on the middle of the curve, though the session rate did rise to approximately 3.2 basis points from the around half a basis point print of the week before. Standout median tenor moves included the 3 basis point rise of the 3-week tenor to about 4.4 basis points, and an approximate two and a half basis point 1-month tenor uptick to about 5 basis points, currently the highest reading in the curve. Note that the 5-month tenor was extinguished entirely over the week to a zero reading.
The information contained within is for educational and informational purposes ONLY. It is not intended nor should it be considered an invitation or inducement to buy or sell any of the underlying instruments cited including but not limited to cryptoassets, financial instruments or any instruments that reference any index provided by CF Benchmarks Ltd. This communication is not intended to persuade or incite you to buy or sell security or securities noted within. Any commentary provided is the opinion of the author and should not be considered a personalised recommendation. Please contact your financial adviser or professional before making an investment decision.
Note: Some of the underlying instruments cited within this material may be restricted to certain customer categories in certain jurisdictions.
Factor Friday - July 24, 2026
Beta's four-week grind higher stalled this week as style leadership rotated again: Momentum took the top spot, last week's leader Value fell to the bottom, and Growth stayed July's weakest factor. Size remains the only style factor positive on the year; beta, not style selection, is setting returns.

Mark Pilipczuk
Changes to the Token Market Price Benchmarks Series - Market Prices – 21 July 2026
The Administrator has confirmed changes to the Token Market Price Family for the period 14 July 2026 to 21 July 2026.
CF Benchmarks
Softer CPI Reprices July Hike Risk & Lifts Digital Assets
Digital assets extended their recovery over the past week as cooler US inflation prints repriced Fed expectations; the bid was broad across the large cap indices, growth factor leadership returned, stablecoin funding repriced lower, and stress stayed isolated in names hit by token-specific news.
Mark Pilipczuk
By clicking Accept, you consent to CF Benchmarks's use of cookies.
Visit Cookie Settings to learn how CF Benchmarks uses cookies and to adjust your preferences.