
May 08, 2026
Factor Friday - May 8, 2026
Size Dominates as the Market Rally Extends into May
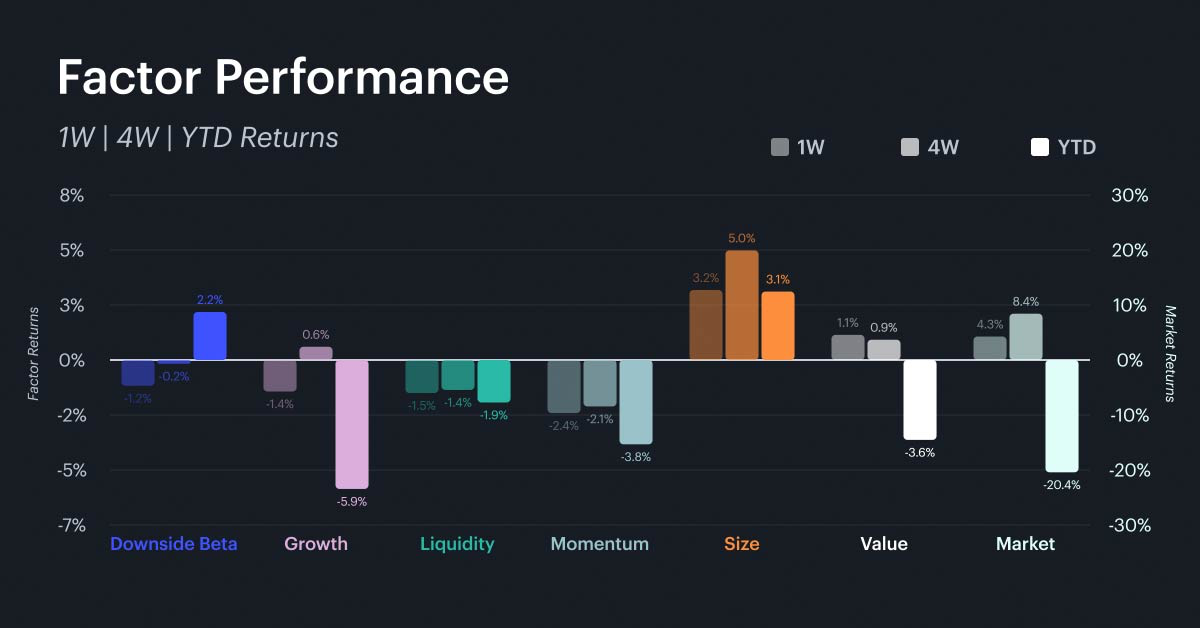
The market gained 4.3% on the week, pushing the year-to-date loss to -20.4% as the rally that began in mid-April carries into May. Size was the standout factor at +3.2% on the week and +5.0% over four weeks, cementing its position as the strongest factor of the spring. Value posted its best week in over a month at +1.1%, a notable turn after spending most of 2026 in negative territory at -3.6% year to date. On the other side, momentum continued to struggle at -2.4% weekly and -3.8% year to date, while liquidity (-1.5%) and growth (-1.4%) also declined. Downside beta gave back -1.2%, a shift from its defensive posture earlier in the year. The week's factor profile suggests the market is rewarding fundamentally cheaper, small-cap assets while punishing trend-followers and high-growth names.
Rolling Factor Rankings and Rotation
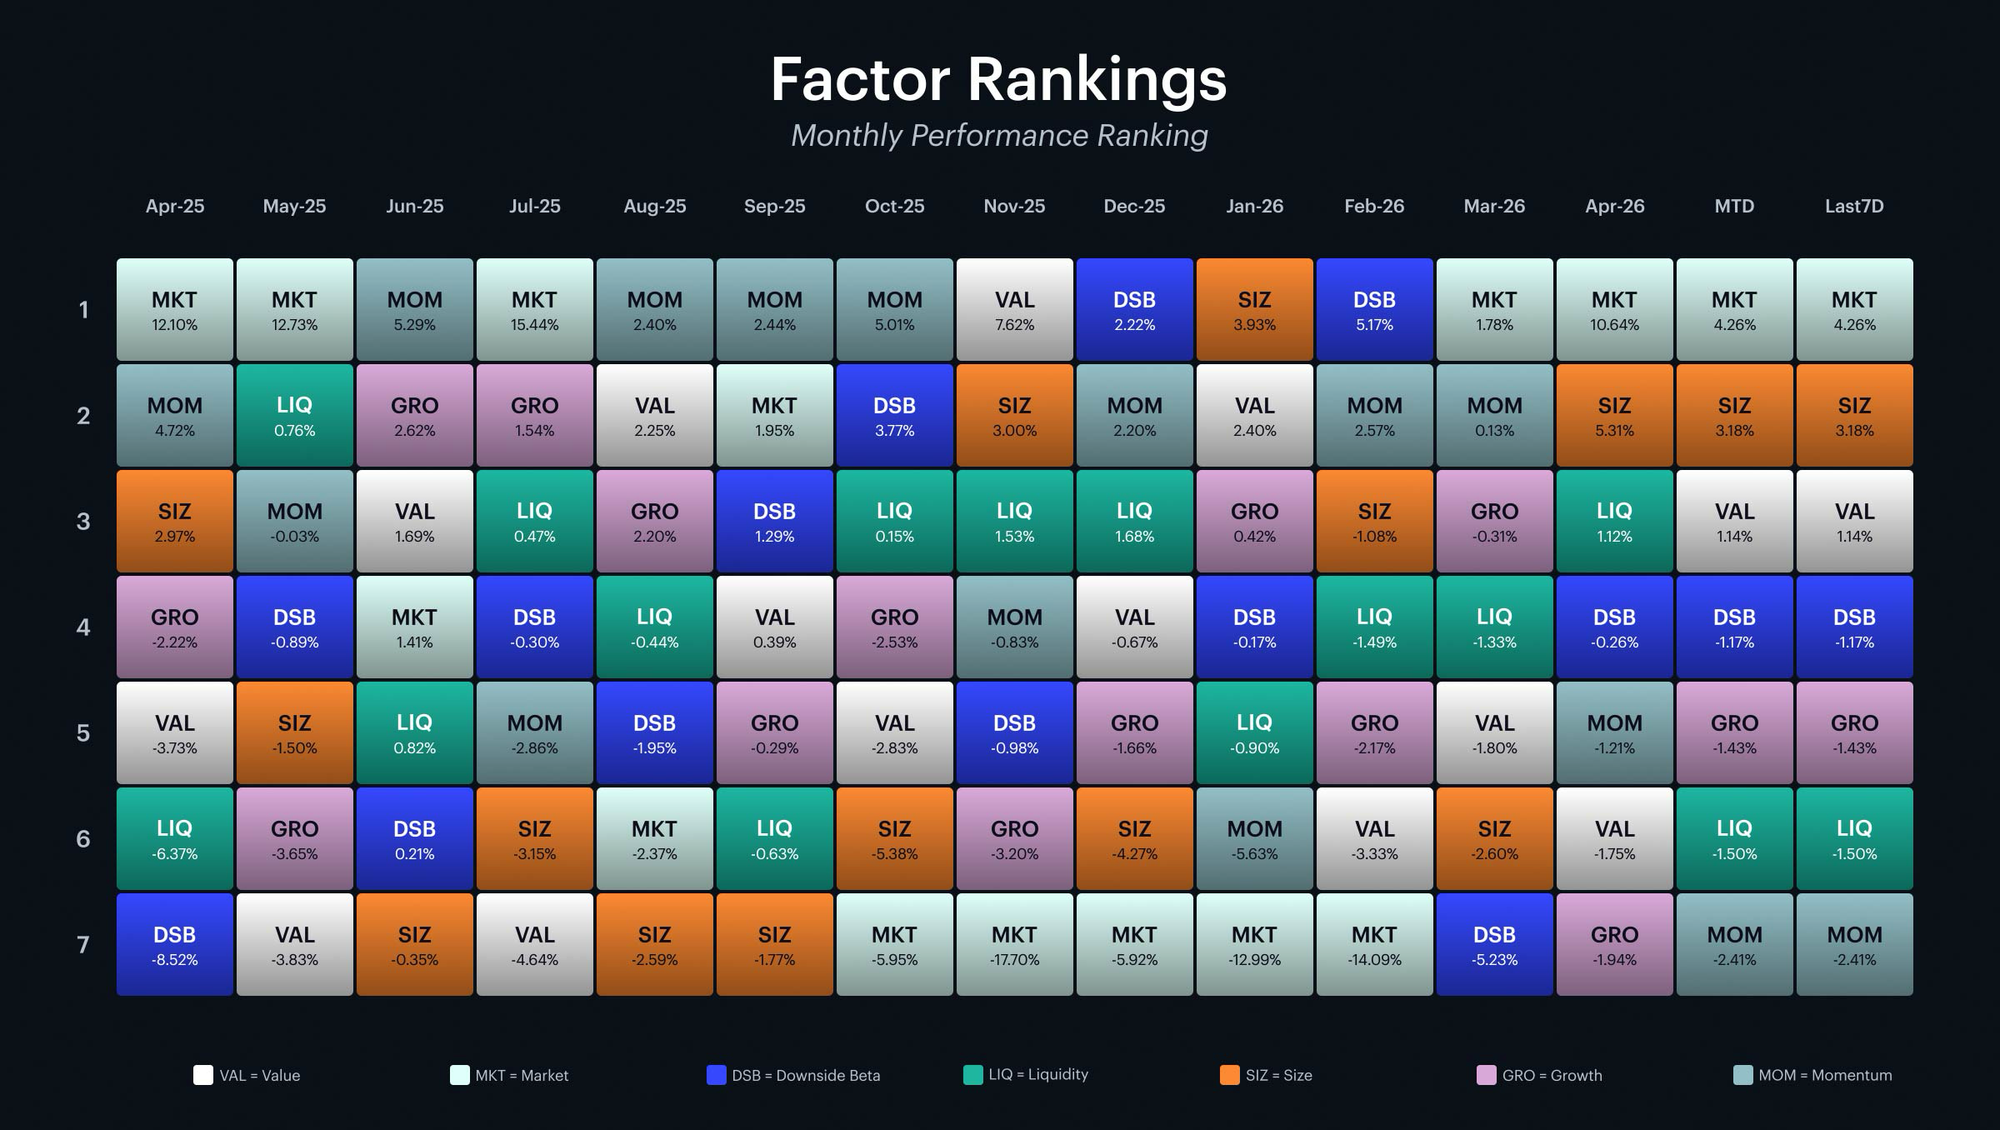
The quilt chart reveals a clear hierarchy this week. The market leads at +4.3%, followed by size at +3.2% and value at +1.1% - the only three factors in positive territory. Downside beta (-1.2%), growth (-1.4%), liquidity (-1.5%), and momentum (-2.4%) all posted losses. The month-to-date view is still early in May, mirroring the weekly numbers. Looking at the broader rotation, size has now ranked in the top three for three consecutive weeks, building on the +5.3% it posted in April. Value's move from fifth place last week to third this week is the most significant shift in the rankings. Last week, growth led the weekly table at +2.5% in a dramatic reversal; this week it has fallen back to fifth at -1.4%, suggesting that snap-back was short-lived rather than a sustained regime change. For investors, the persistence of the size factor and value's emergence as a co-leader warrant attention, while momentum's ongoing weakness at -3.8% year to date signals that trend-following strategies remain out of favor.
Market and Key Factor Betas
Market Beta
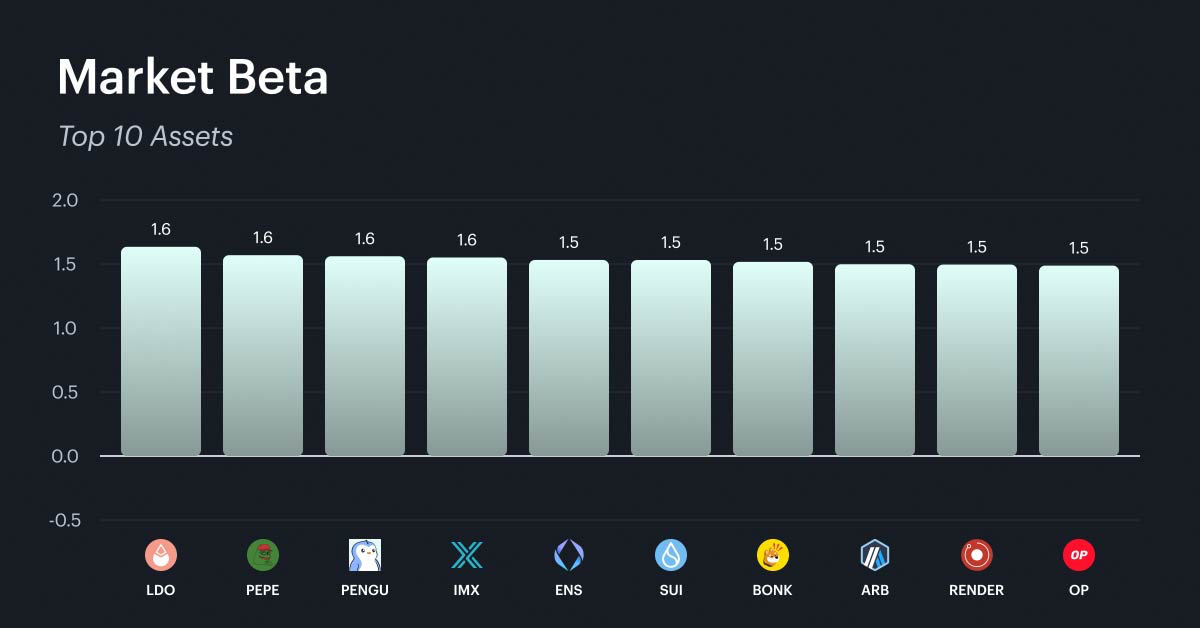
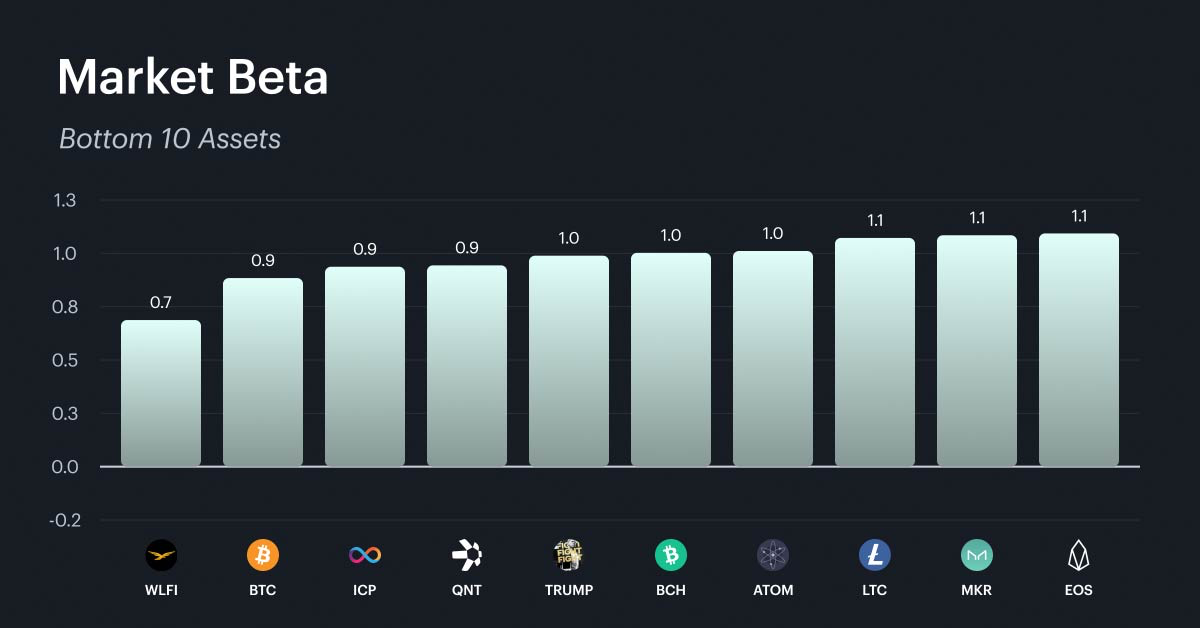
The market beta distribution is largely unchanged from prior weeks. The high-beta cohort continues to be populated by mid-cap DeFi protocols, meme tokens, layer-2 scaling solutions, and gaming infrastructure, with betas clustering between 1.5 and 1.6. The low-beta group remains anchored by large-cap, high-liquidity assets. With the market up 4.3% on the week, high-beta names amplified that move while the low-beta cohort dampened it, creating a spread that reinforces the size factor's dominance.
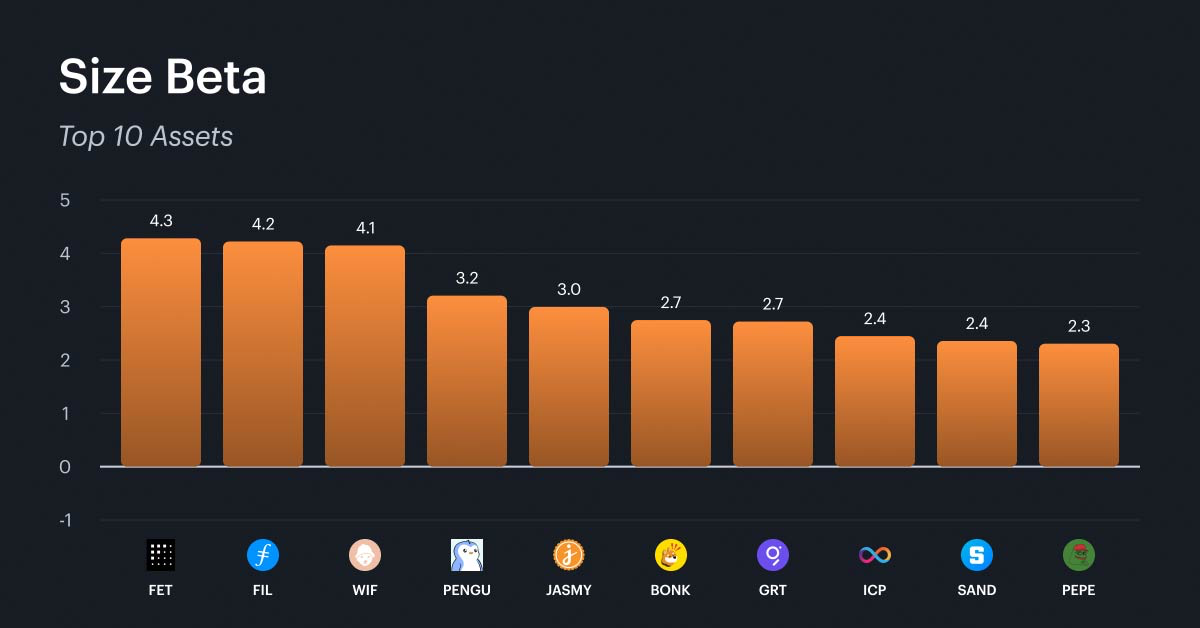
Size
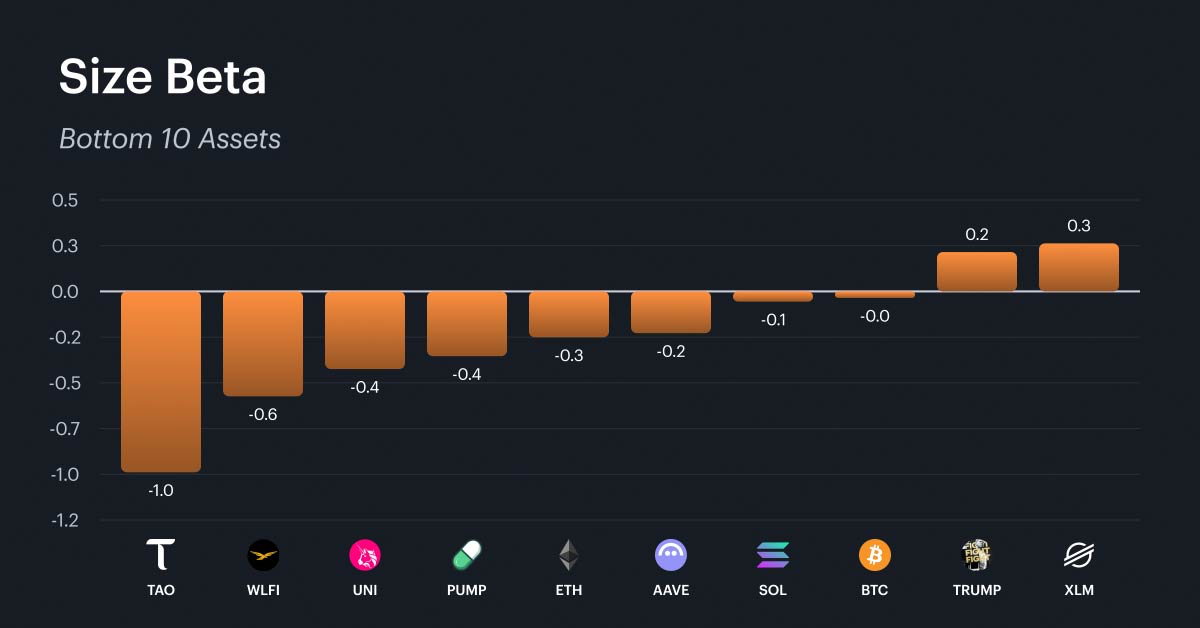
Size continues to be the dominant factor story of 2026's second quarter. At +3.2% on the week and +5.0% over four weeks, it is the clear leader among non-market factors. The top size-beta cohort remains remarkably stable week over week, populated by meme coins, AI and data infrastructure tokens, and gaming-adjacent assets - names that carry smaller market capitalizations and thinner liquidity profiles. The bottom of the size beta is equally stable, anchored by large-cap DeFi blue chips, established layer-1 networks, and mega-caps like BTC and ETH. The consistency of this composition across multiple weeks reinforces that the size factor is capturing a durable rotation into smaller names rather than a one-off. For investors, the sustained nature of this trade - now three consecutive strong weeks - suggests that capital is flowing down the market cap spectrum with conviction, a pattern that typically reflects increasing risk appetite among market participants.
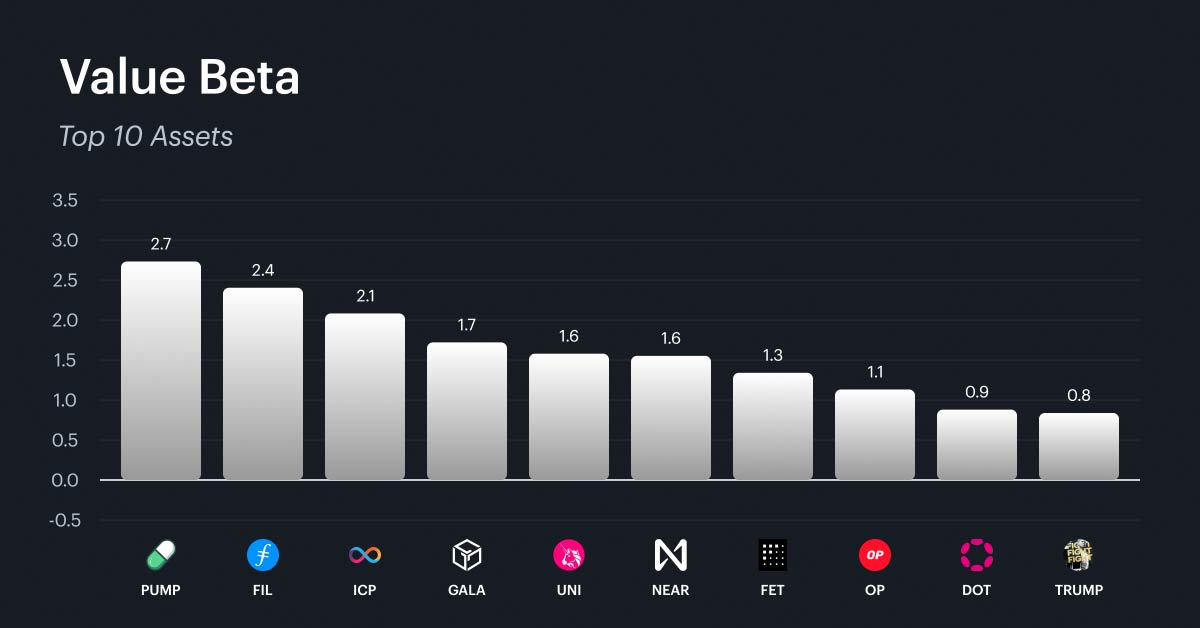
Value
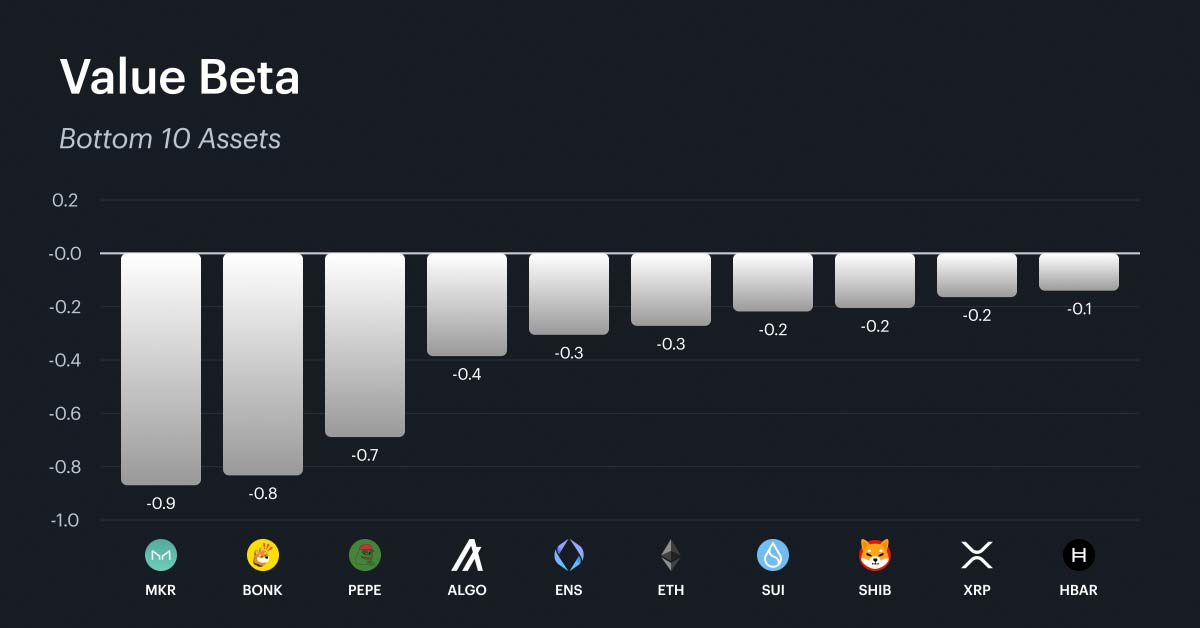
Value's +1.1% weekly return is its best showing in several weeks and marks a potential inflection point for a factor that has been among the worst performers year to date at -3.6%. The composition of the value beta has been stable, with the high value-beta group concentrated in exchange and launchpad tokens, data storage and infrastructure protocols, governance tokens, gaming, and established DeFi platforms. On the negative side, the bottom of the value beta is populated by DeFi governance tokens, meme coins, and large-cap layer-1 networks. One notable change this week is the exit of VET from the bottom 10 and the entry of HBAR, suggesting a modest reshuffling among mid-cap assets at the negative end of the value spectrum.
The value factor's performance this week cannot be separated from the aftermath of the Kelp DAO exploit in mid-April. The $292 million hack triggered roughly $6.6 billion in TVL outflows from Aave alone and an estimated $13 billion in broader DeFi TVL losses over 48 hours. Aave, which sits in the bottom half of the size beta rankings, absorbed approximately $196 million in bad debt tied to the stolen rsETH collateral. While Aave has since liquidated the exploiter's positions and a coordinated $300 million recovery effort is underway with backing from major ecosystem participants, TVL has only partially recovered from its pre-incident level of $26 billion. For investors, the value factor betas will be worth monitoring over the coming weeks.
What Factors are Driving Markets
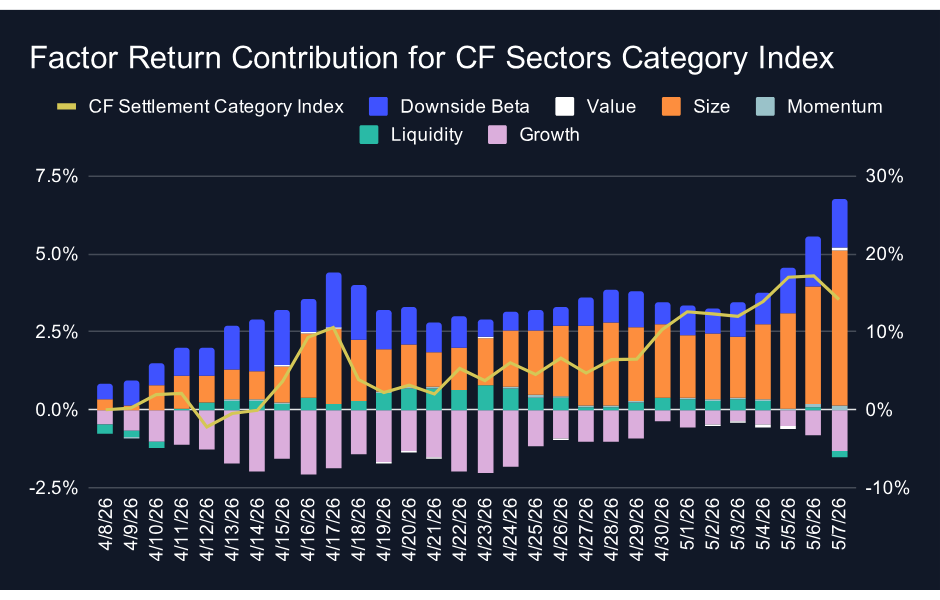
The Sectors category index returned +14.1% over the trailing 30 days, while cumulative factor contributions totaled +5.2%. The gap of approximately 9.0 percentage points is wider than last week's 5.3pp spread, indicating that an increasing portion of Sectors returns is coming from sources outside the factor model. Size remains the dominant contributor at +5.0%, while growth continues to be the largest drag at -1.3%. Downside beta added +1.5%, its strongest contribution across the three categories.
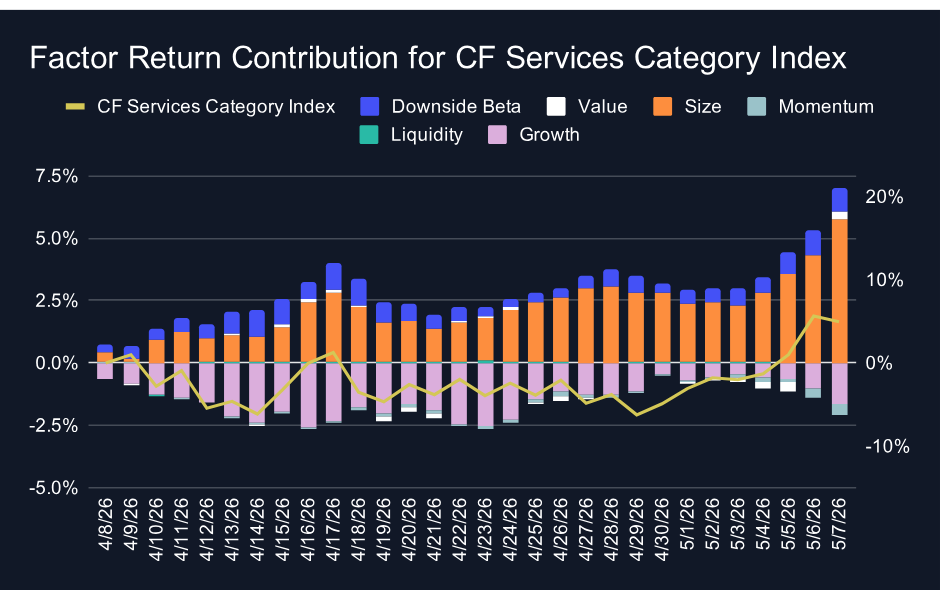
The Services category presents a near-perfect alignment between factors and the index this week. Cumulative factor contributions came in at +4.9%, while the index returned +5.0% over the trailing 30 days - a gap of essentially zero. This is a meaningful change from last week, when factors exceeded the index by 5.9 percentage points against a negative index return. The convergence suggests that the drivers of Services returns have normalized and are now well-explained by the factor model. Size again led at +5.8%, the strongest single-factor contribution across all three categories. Growth remained a headwind at -1.6%, while momentum dragged -0.4%.
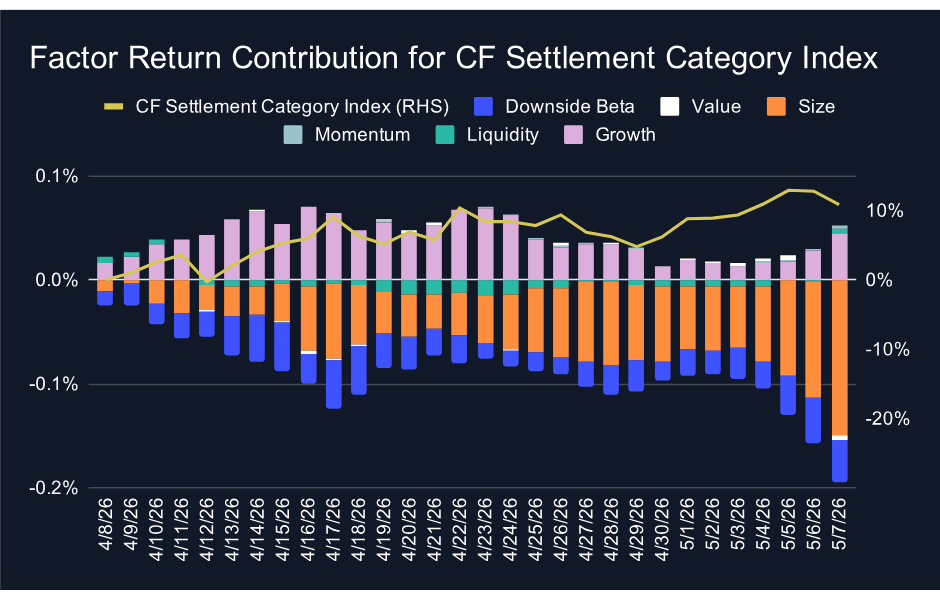
The Settlement category continues to show the widest disconnect between factors and index performance. The index returned +10.8% over the trailing 30 days, while factor contributions were flat at -0.1%. The 11.0 percentage point gap is the largest across the three categories and has widened from last week's 10.1pp. This persistent and growing disconnect reinforces that Settlement returns are driven almost entirely by idiosyncratic or market-level forces - particularly the price action of dominant assets in the category - rather than systematic factor exposure.
Appendix: CF Factor Methodology
Market Factor
The market factor captures the broad, systematic risk that permeates the digital asset ecosystem. It reflects aggregate influences such as macroeconomic conditions, investor sentiment, and overall market volatility. As such, this factor is defined by the daily returns of the CF Broad Cap (Free Float Market Cap Weight) Index, offering a comprehensive and capitalization-weighted representation of the asset class.
Size Factor
The size factor captures the return differential associated with asset scale, reflecting the hypothesis that smaller-cap digital assets tend to outperform their larger-cap counterparts. This effect is understood to compensate for elevated operational and financial risks while exploiting potential market inefficiencies. In this framework, the size factor is defined by each asset’s fully diluted market capitalization. The value is sign-inverted so that higher z-scores are assigned to smaller assets and vice-versa.
Value Factor
The value factor reflects a protocol’s ability to generate economic output relative to its capital base and market valuation, combining measures of both efficiency and user engagement. It is constructed as the average z-score of two key ratios: transaction fees relative to total value locked (Fees/TVL) and daily active users relative to market capitalization (DAU/MCap). This composite metric captures how productively a protocol utilizes its resources while also serving as a proxy for user-driven demand. A higher combined score indicates efficient resource utilization and strong user engagement.
Momentum Factor
The momentum factor captures short-term price persistence by identifying assets that have recently exhibited strong performance. It is computed as the average z-score of two metrics: the 2 weeks cumulative performance and the 2 weeks risk-adjusted cumulative performance. This approach aligns with established findings in traditional financial literature and demonstrates empirical relevance in digital assets, where price trends tend to exhibit momentum over short horizons.
Growth Factor
The growth factor captures the expansion of a protocol’s network activity and user adoption. In the context of digital assets, it reflects metrics such as fee generation and user engagement, which serve as indicators of increased platform utilization and operational scale. The factor is defined as the average z-score of 30-day fee growth and 30-day weekly active user growth, thereby identifying assets exhibiting consistent and measurable increases in underlying network usage.
Downside Beta
The downside beta factor captures an asset’s sensitivity to adverse market conditions by isolating its behavior during periods of negative market returns. Empirical evidence shows that assets with lower downside beta tend to outperform their higher-beta counterparts over the long-term, due to their reduced participation in market drawdowns and more stable return profiles during periods of elevated volatility. As such, it is estimated through a regression of the asset’s daily returns over the most recent four-week period against market returns observed exclusively during negative sessions. The resulting value is sign-inverted to ensure that assets with lower downside exposure are assigned higher z-scores.
Liquidity Factor
The liquidity factor captures the ease with which a digital asset can be traded without significantly impacting its price. Empirical evidence shows that illiquid assets tend to command a higher risk premium than their more liquid counterparts, serving as compensation for trading friction and price volatility. To quantify this, the factor is measured using token turnover, defined as trading volume as a percentage of circulating supply. The value is sign-inverted such that higher z-scores are assigned to less liquid assets.
For further detail, view the CF Factors Methodology Document, the CF Factor Data Suite, and Our paper “A Factor Model for Digital Assets” in Springer Nature’s Mathematical Research for Blockchain Economy
The information contained within is for educational and informational purposes ONLY. It is not intended nor should it be considered an invitation or inducement to buy or sell any of the underlying instruments cited including but not limited to cryptoassets, financial instruments or any instruments that reference any index provided by CF Benchmarks Ltd. This communication is not intended to persuade or incite you to buy or sell security or securities noted within. Any commentary provided is the opinion of the author and should not be considered a personalised recommendation. Please contact your financial adviser or professional before making an investment decision.
Note: Some of the underlying instruments cited within this material may be restricted to certain customer categories in certain jurisdictions.
Changes to the Token Market Price Benchmarks Series - Market Prices – 21 July 2026
The Administrator has confirmed changes to the Token Market Price Family for the period 14 July 2026 to 21 July 2026.

CF Benchmarks
Softer CPI Reprices July Hike Risk & Lifts Digital Assets
Digital assets extended their recovery over the past week as cooler US inflation prints repriced Fed expectations; the bid was broad across the large cap indices, growth factor leadership returned, stablecoin funding repriced lower, and stress stayed isolated in names hit by token-specific news.
Mark Pilipczuk
Notice of the Demising of CF Dai-Dollar Settlement Price and Spot Rate
The Administrator announces that it will demise the CF Dai-Dollar Settlement Price (DAIUSD_RR) and CF Dai-Dollar Spot Rate (DAIUSD_RTI) which are members of the CF Digital Asset Index Family.
CF Benchmarks
By clicking Accept, you consent to CF Benchmarks's use of cookies.
Visit Cookie Settings to learn how CF Benchmarks uses cookies and to adjust your preferences.