
Nov 17, 2025
Weekly Index Highlights, November 17, 2025
Market Performance Update
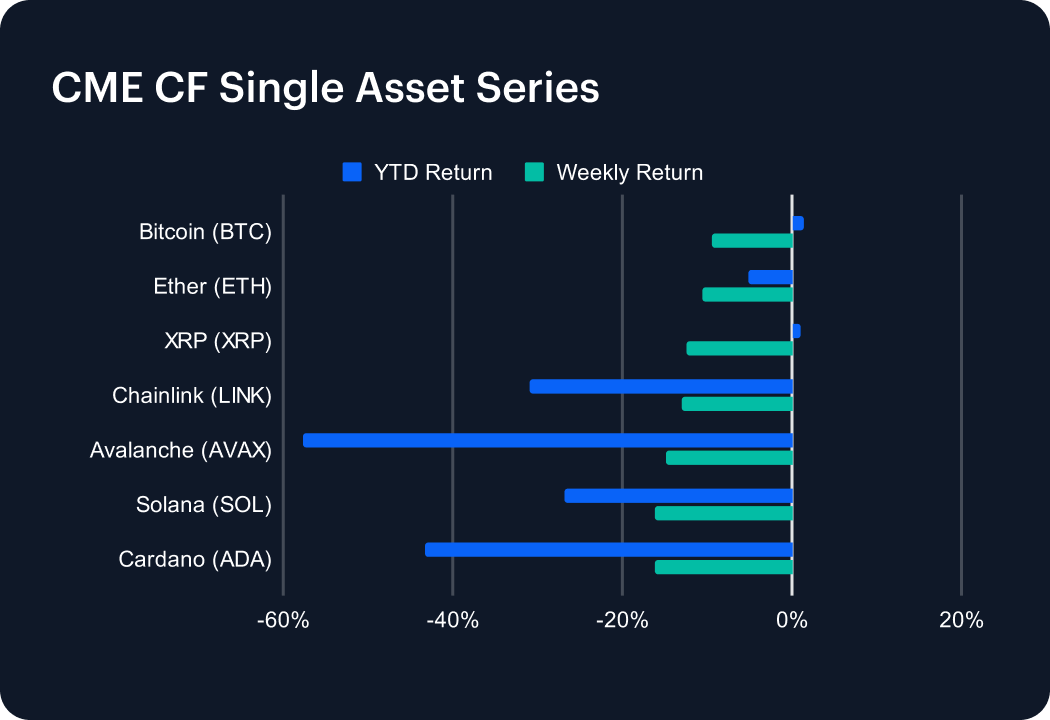
Digital asset market volatility continued into November’s second week, with mega caps breaching closely watched price levels, particularly Bitcoin, which broke below the ‘psychological’ $100k marker, while the Ethereum market complex appeared to undergo an even deeper reset in positioning and leverage. BTC ended the most recent week -9.4%, while ETH lost 10.6%, mirroring a softer tone across layer 1s. Solana (SOL) and Avalanche (AVAX) relatively underperformed, down −16.1% and −14.9% respectively, as higher-beta exposures absorbed further deleveraging. Cardano (ADA) −16.2%, Chainlink (LINK) −13.0%, and XRP, −12.5%, also posted notable declines, rounding out a uniform risk-off profile across large caps. The pattern looks more like mechanical de-risking than structural rotation, with volumes moderating and open interest resetting after October’s sharp rally. Despite the drawdown, liquidity depth remained orderly and spreads contained, underscoring a controlled consolidation phase rather than renewed liquidation pressure. Year-to-date leadership remains anchored on Bitcoin and Ether, with both still commanding primacy in terms of institutional flow.
Sector Analysis
Sector performance through the CF Digital Asset Classification Structure (CF DACS) lens showed mild dispersion week-on-week, with moves clustered in the mid-single-digit range. The key Finance and Infrastructure Sub-Categories escaped with relatively contained average declines of -10.71% and -11.12% week-on-week, while Culture and Utility sectors lagged modestly, down -13.85% and -14.29% a piece. The breadth of declines narrowed compared with the prior week’s broad risk-off, indicating some stabilization within high-beta Sub-Categories and Segments. Leadership within Finance remained tethered to liquidity-oriented names, while Culture and Utility reflected softer engagement metrics. Overall, rotation was selective rather than directional, consistent with a measured de-risking phase, with capital remaining positioned around liquidity depth and transactional utility.
CF Staking Series
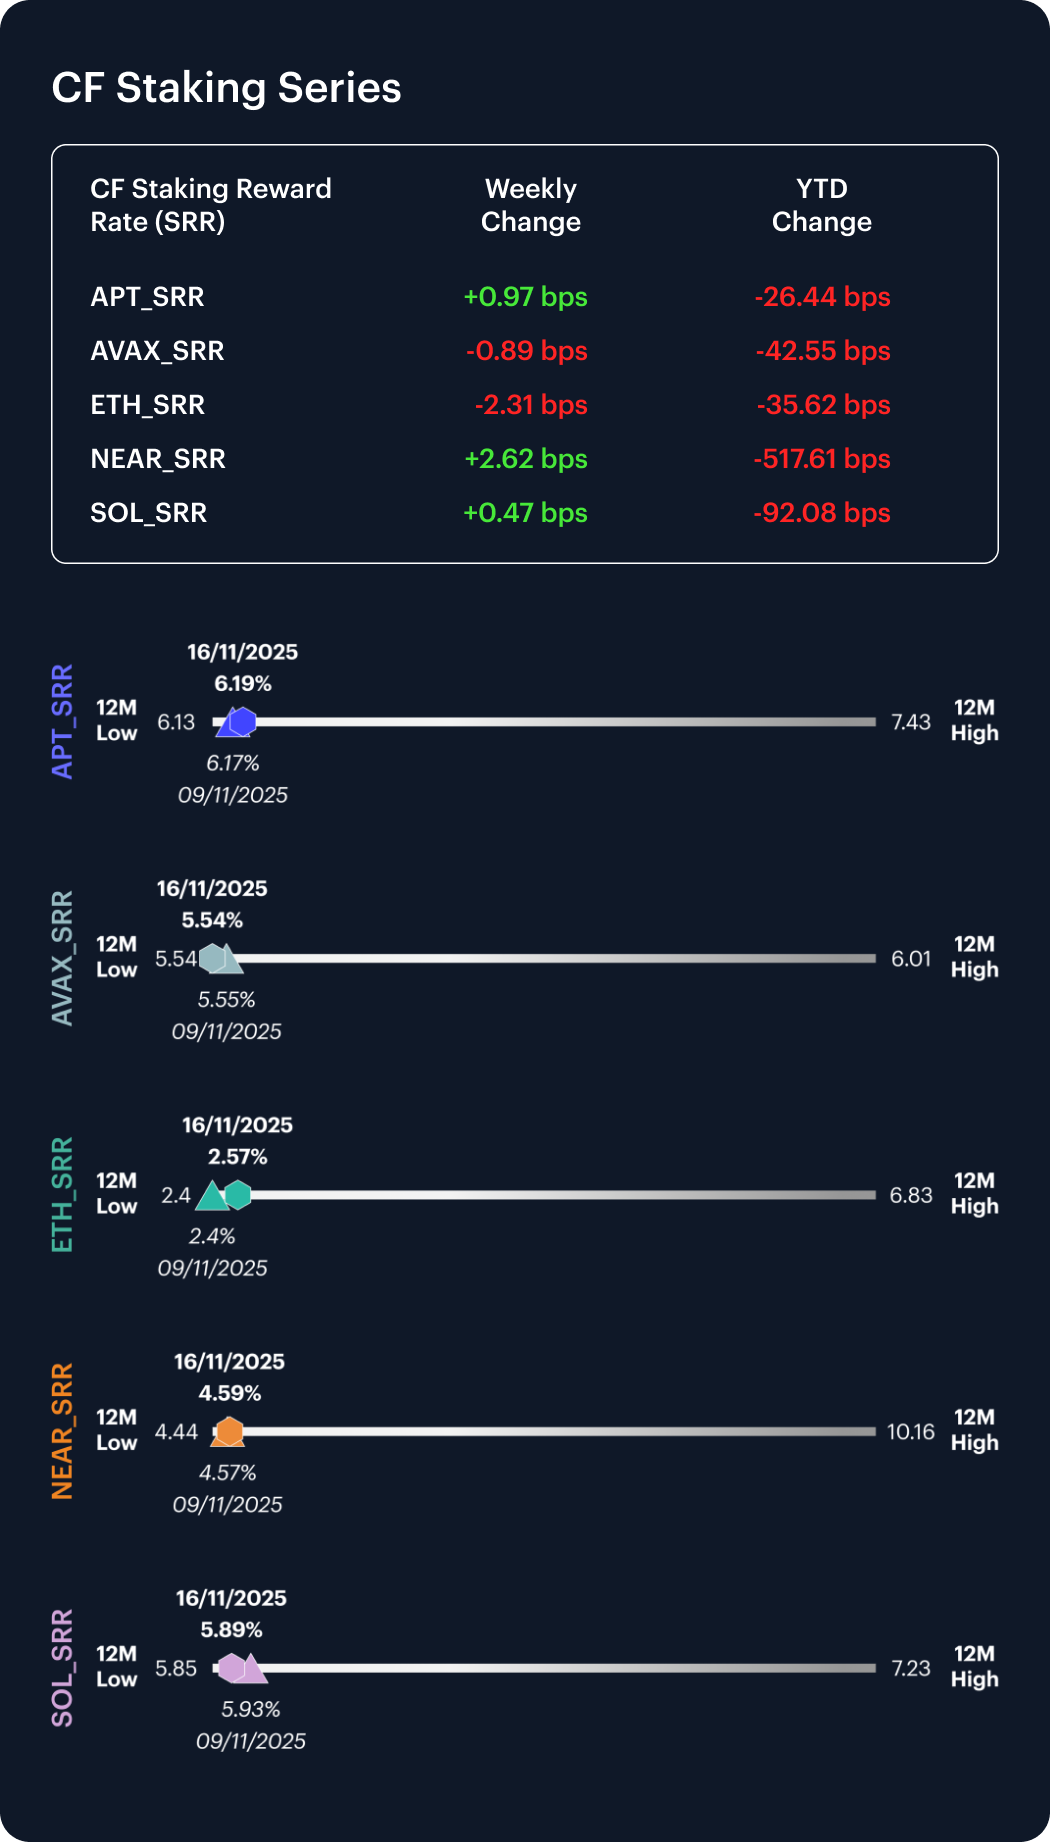
Within the CF Staking indices, performance diverged but carry moved only incrementally. Weekly staking returns printed APT +0.08%, AVAX -0.08%, ETH -6.76%, NEAR +2.79%, and SOL -0.31%. Reward-rate changes for the week were thereby correspondingly firm in the negative for ETH on a relative basis, -17.40 bps, minor for SOL, -1.85 bps, positive for NEAR +12.39 bps, slight for APT +0.48 bps, and slightly negative for AVAX -0.42 bps. Net-net, the carry profile remains broadly intact, with token-level beta and at least the impression of idiosyncratic catalysts driving most of the dispersion over the last week.
Market Cap Index Performance
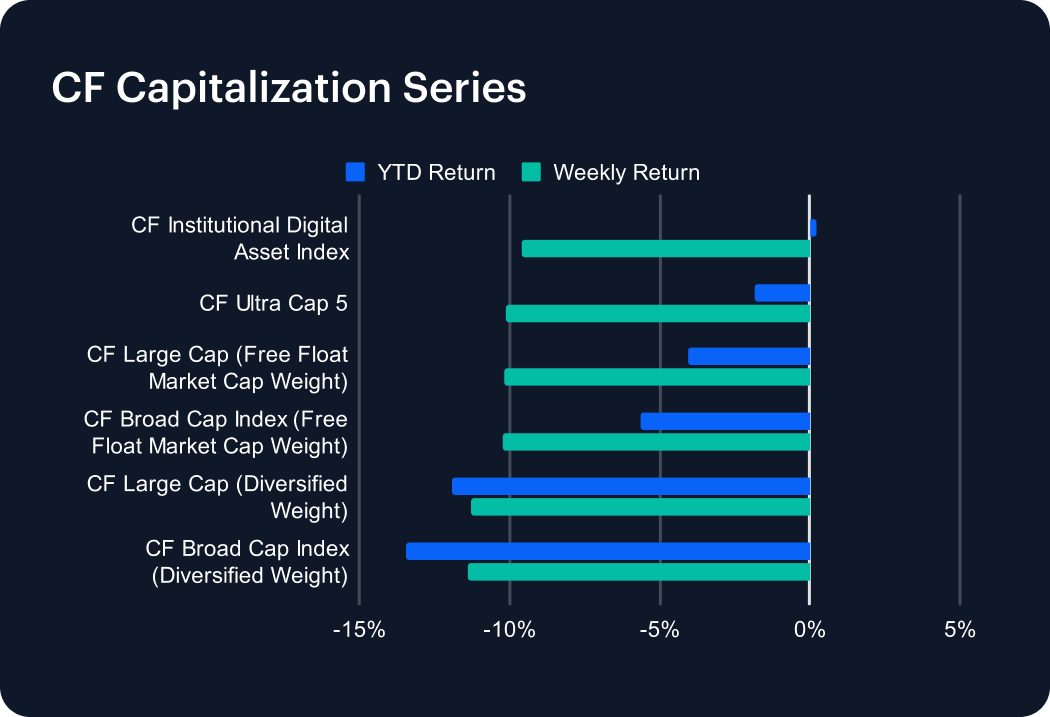
Capitalization-tier composites tracked the same directional bias but with smaller amplitude. The CF Ultra Cap 5 declined −10.11% week-on-week, and the CF Institutional Digital Asset Index approximately matching that magnitude. Both were, relatively, the most resilient among the CF family, indicating persistent large-cap quality premia. Broad- and Large-Cap Diversified indices were likewise weaker, but largely in line with the market, providing some credence to the notion that recent price action represented systematic rather than idiosyncratic stress. The most recently completed week ended with capitalization curves intact — suggesting risk-off flows were cyclical, possibly tactical, and oughtn’t to be read as structural, for now.
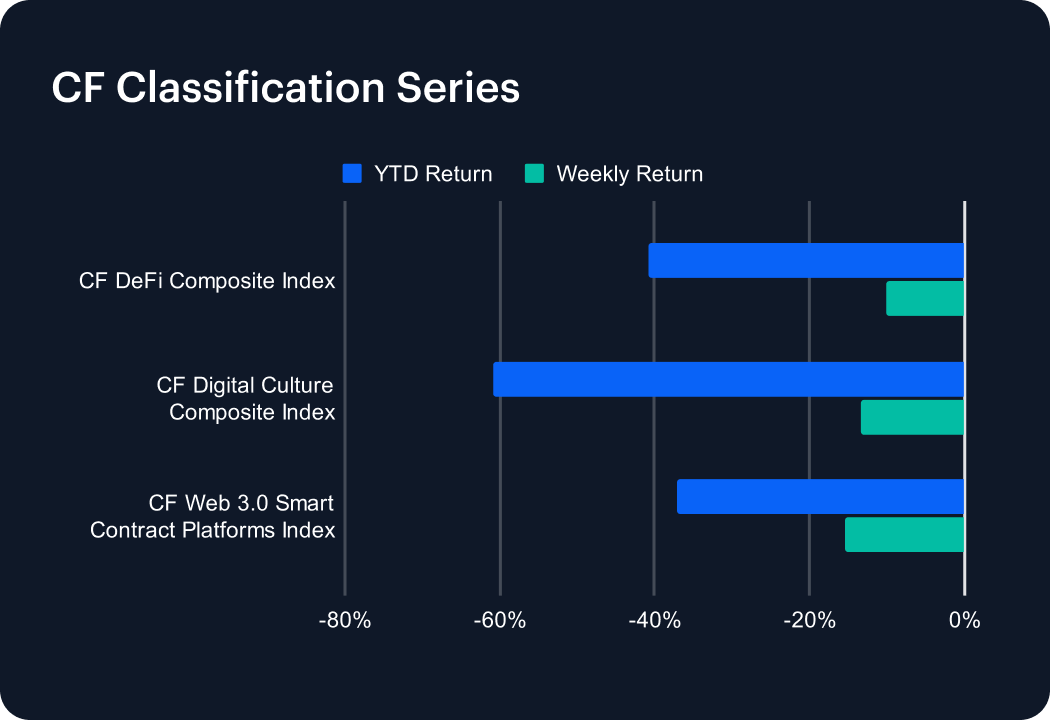
Classification Series Analysis
Classification indices weakened in parallel with broad-market retracement. The CF Web 3.0 Smart Contract Platforms Index fell −15.35% over the week, the CF DeFi Composite Index declined −10.06%, and the CF Digital Culture Composite Index dropped −13.41%. Losses were heaviest among smart contract platform and culture-linked tokens, while DeFi’s relatively light decline reflected a degree of defensiveness in yield-oriented protocols. The week’s profile confirmed that the early-November rally has fully retraced, with cross-theme performance now reflecting systemic beta exposure rather than theme-specific differentiation. Momentum and flows both suggest that investor appetite remains selective and liquidity-driven within the classification universe.
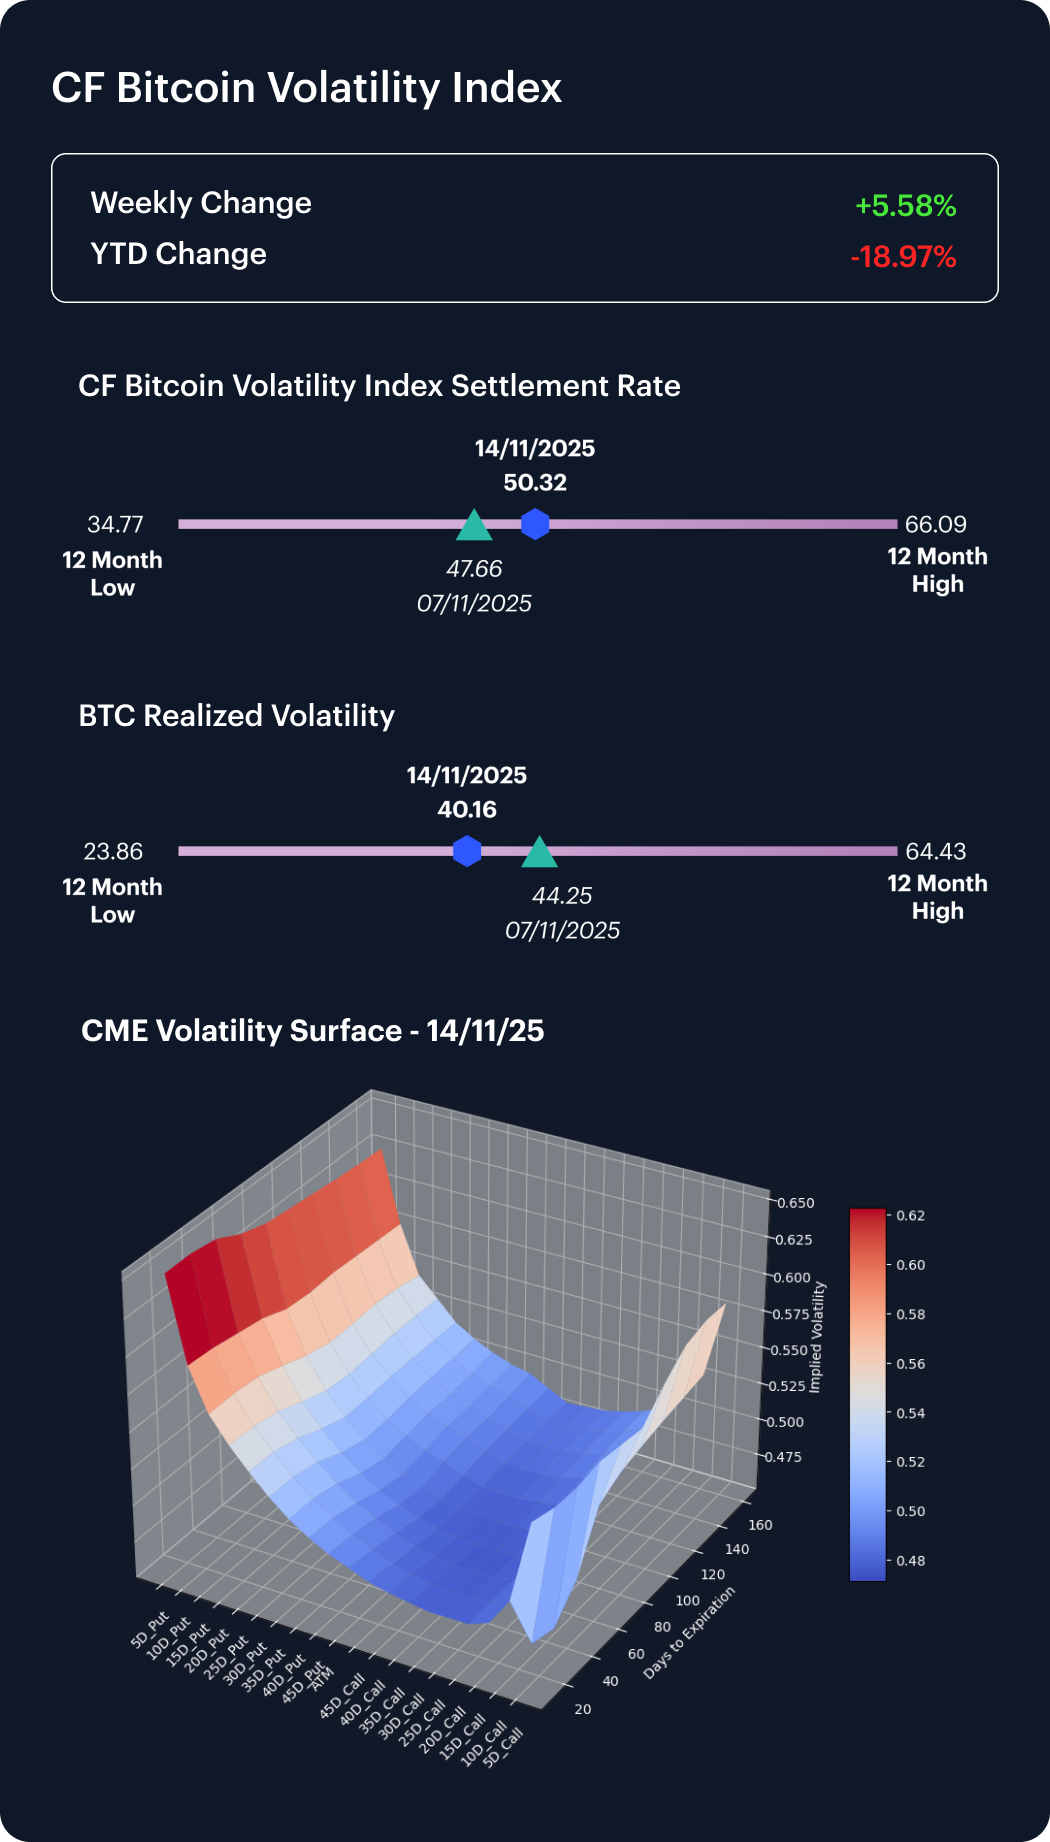
Volatility Analysis
Volatility measures firmed modestly though this was nuanced. The CF Bitcoin Volatility Index (BVX) climbed from 47.66 to 50.32 (+2.66 pts). Meanwhile, though realized volatility also rose through November 10th to November 14th, it declined across the complete week of November 7th-14th, ending at 40.16 from 44.25 before, compressing the implied–realized gap. The divergence signaled fading realized movement, but modest hedging interest, consistent with portfolio rebalancing rather than stress. Short-dated skew remained contained and vol. surfaces orderly. In aggregate, volatility metrics portrayed a market entering consolidation; with risk premia adjusting to realized calm rather than expanding into renewed tension. Derivatives volumes stayed near three-month averages, further confirming controlled positioning.
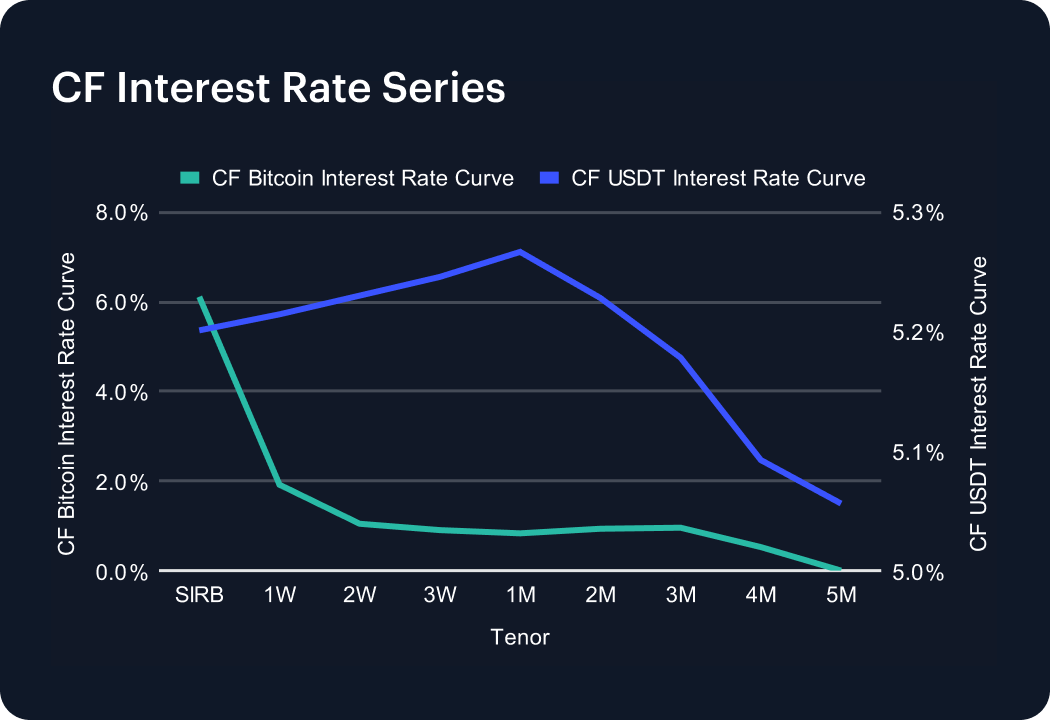
Interest Rate Analysis
Funding curves softened across both Bitcoin and USDT complexes. The CF Bitcoin Interest Rate Curve saw SIRB drop roughly −0.94 percentage points (pp) and 1-Month tenor ease −0.25 pp, while the CF USDT curve declined by −0.91 pp at 1-Week and it’s 1M rate drop −0.87 pp. The net result was a flattening bias across both curves, implying moderate carry compression and reduced front-end stress. This equilibrium is more suggestive of funding normalization rather than new dislocation, with liquidity conditions across major derivative venues remaining broadly balanced. Rate curves continue to indicate a benign funding environment into the new week, despite the prior week’s underlying risk-off tone.
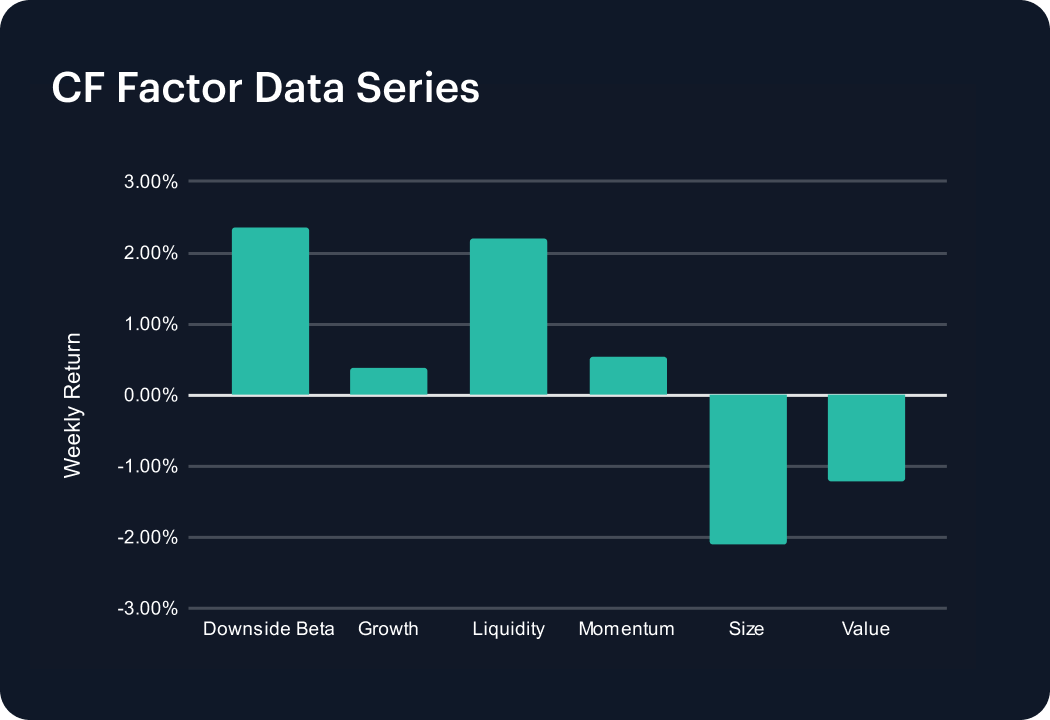
Factors Analysis
Factor returns pointed to de-risking. Downside Beta, +2.4%, and Liquidity, +2.2%, advanced, alongside smaller gains in Growth, +0.4%, and Momentum, +0.6%, while Size, −2.1%, and Value, −1.2%, lagged. The pattern may suggest a deterioration of higher-beta exposures overall, while caution emerged on valuation and scale factors. Dispersion across returns widened modestly, reflecting measured rotation rather than full risk deployment.
The information contained within is for educational and informational purposes ONLY. It is not intended nor should it be considered an invitation or inducement to buy or sell any of the underlying instruments cited including but not limited to cryptoassets, financial instruments or any instruments that reference any index provided by CF Benchmarks Ltd. This communication is not intended to persuade or incite you to buy or sell security or securities noted within. Any commentary provided is the opinion of the author and should not be considered a personalised recommendation. Please contact your financial adviser or professional before making an investment decision.
Note: Some of the underlying instruments cited within this material may be restricted to certain customer categories in certain jurisdictions.
Changes to the Token Market Price Benchmarks Series - Market Prices – 21 July 2026
The Administrator has confirmed changes to the Token Market Price Family for the period 14 July 2026 to 21 July 2026.

CF Benchmarks
Softer CPI Reprices July Hike Risk & Lifts Digital Assets
Digital assets extended their recovery over the past week as cooler US inflation prints repriced Fed expectations; the bid was broad across the large cap indices, growth factor leadership returned, stablecoin funding repriced lower, and stress stayed isolated in names hit by token-specific news.
Mark Pilipczuk
Notice of the Demising of CF Dai-Dollar Settlement Price and Spot Rate
The Administrator announces that it will demise the CF Dai-Dollar Settlement Price (DAIUSD_RR) and CF Dai-Dollar Spot Rate (DAIUSD_RTI) which are members of the CF Digital Asset Index Family.
CF Benchmarks
By clicking Accept, you consent to CF Benchmarks's use of cookies.
Visit Cookie Settings to learn how CF Benchmarks uses cookies and to adjust your preferences.