
May 27, 2025
Weekly Index Highlights, May 26, 2025
Market Performance Update
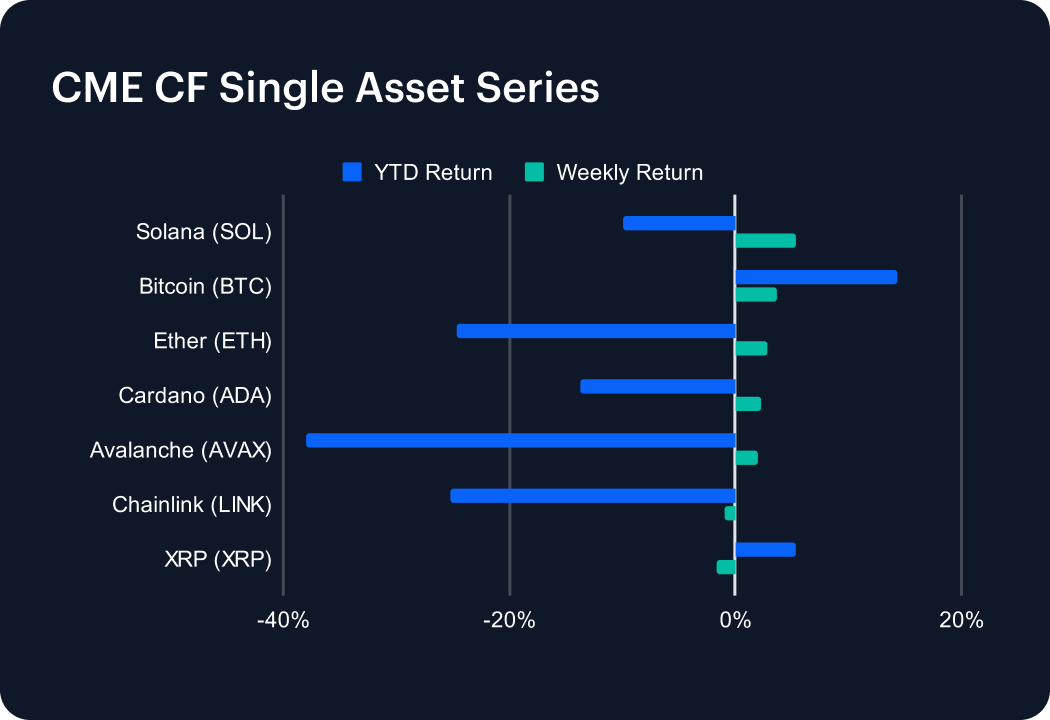
The digital asset market extended its rally last week, with several major tokens posting gains. Solana (SOL) led the charge, jumping 5.40% and trimming its year-to-date (YTD) loss to -9.93%. Bitcoin (BTC) continued to show strength, rising 3.62% to lift its YTD return to 14.38%, the highest among large-cap tokens. Ether (ETH) climbed 2.88%, though it remains down 24.70% for the year. Cardano (ADA) and Avalanche (AVAX) added 2.25% and 2.00%, respectively, offering relief amid deeper YTD declines. On the downside, Chainlink (LINK) slipped 1.01%, and XRP (XRP) dropped 1.64%, though XRP still holds a positive YTD return of 5.29%. The market’s mixed performance reflects cautious optimism as the macroeconomic environment continues to shift.
Sector Analysis
Key digital asset sub-categories showed a mixed performance last week, with pockets of strength emerging across segments. In Trading, CRV surged 13.55%, far outpacing the average in the trading segment, while UNI and BAL posted modest gains. AAVE led Borrowing & Lending with a strong 17.62% rally, contrasting with mild losses in SPELL and COMP. In Smart Contract Platforms, Solana (SOL) gained 5.40%, topping the segment, while Fantom (FTM) lagged with a steep 9.70% drop. Notably, Injective (INJ) jumped 9.18% among specialized platforms. In Gaming and Culture, SUPER edged higher by 2.17%, but PRIME tumbled 11.65%. Scaling tokens were broadly positive, led by OP (+4.06%), while BICO in SDK & Tooling sank 10.65%. Overall, strength was selective across the DACS sub-categories.
Staking Metrics
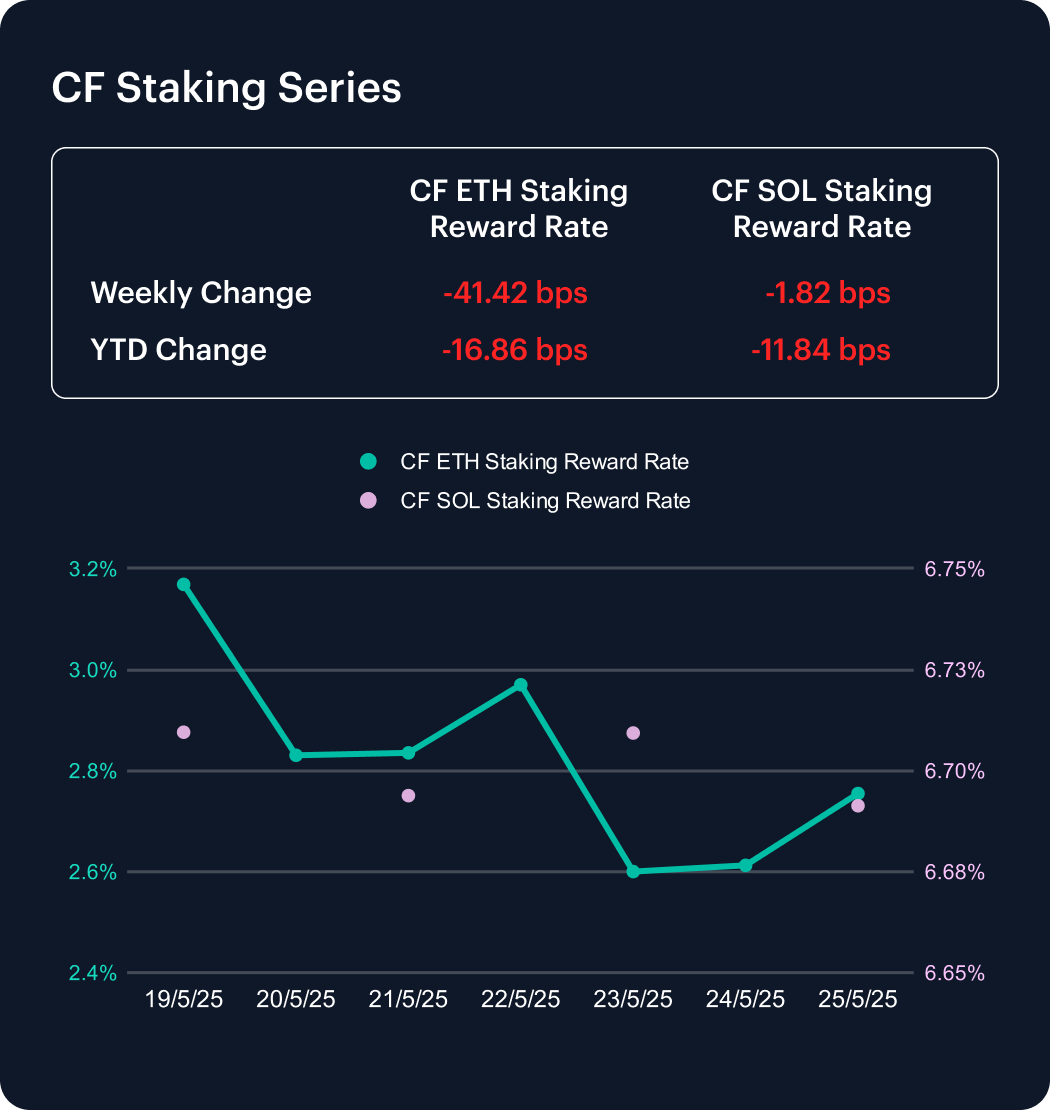
The CF Ether Staking Reward Rate Index (ETH_SRR) fell sharply last week, dropping 41.42 basis points to 2.75%—a 13.07% weekly decline. Year-to-date, the index has declined 16.86 bps from 2.92%, reflecting a 5.77% decrease and pointing to continued downward pressure on Ethereum staking yields.
The CF SOL Staking Reward Rate Index (SOL_SRR) showed greater stability, dipping just 1.82 bps to 6.69%, down 0.27% on the week. Solana’s YTD drop stands at 11.84 bps, or 1.74%. With Ethereum’s rewards compressing more sharply, the gap between major proof-of-stake yields continues to widen.
Market Cap Index Performance
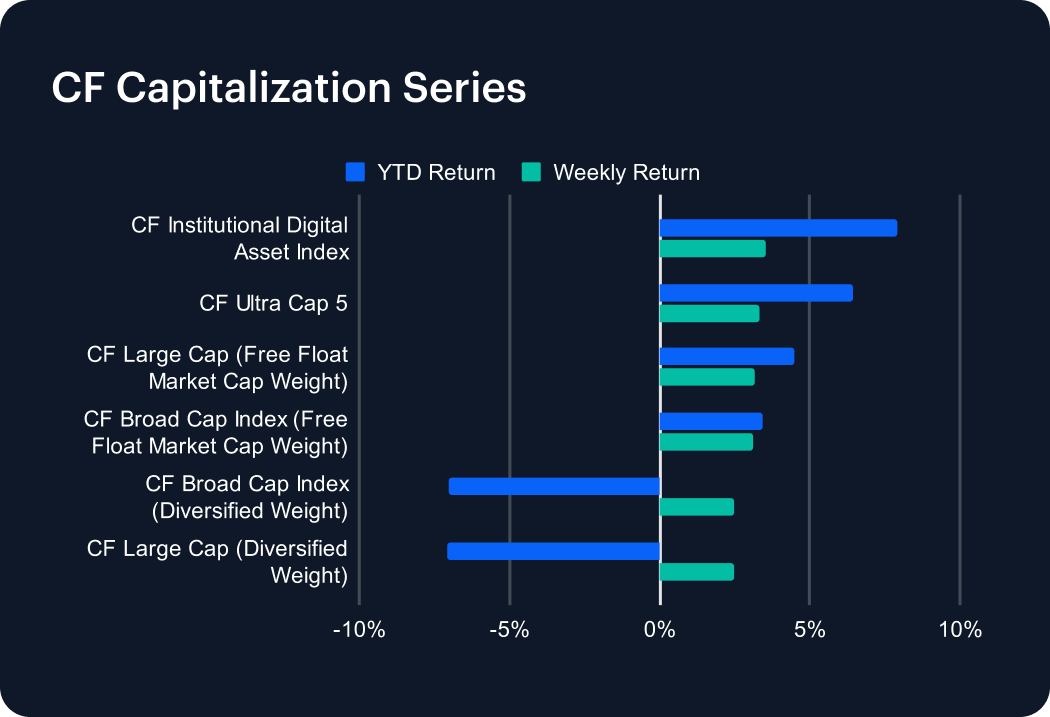
The CF Capitalization Series advanced broadly last week, with gains across both free-float and diversified-weighted indices. The CF Institutional Digital Asset Index led with a strong 3.53% weekly gain, lifting its year-to-date (YTD) return to 7.89%. The CF Ultra Cap 5 followed closely, rising 3.30% for a 6.43% YTD return. Free-float market cap-weighted benchmarks also posted solid gains—CF Large Cap and CF Broad Cap Index climbed 3.14% and 3.13%, respectively, boosting YTD returns to 4.48% and 3.45%. Diversified-weighted indices also rebounded as the CF Broad Cap and CF Large Cap rose 2.50% and 2.48%, though YTD returns remain negative at -7.04% and -7.09%. The outperformance by the CF Institutional Digital Asset Index highlights the strong investor appetite for Bitcoin in 2025.

Classification Series Analysis
The CF Classification Series Indices continued their rebound last week, with two of the three major thematic benchmarks posting gains. The CF DeFi Composite Index led the recovery, rising 5.58% and slightly trimming its year-to-date (YTD) loss to -30.93%. The CF Web 3.0 Smart Contract Platforms Index also advanced, adding 1.93%, though it remains down 22.55% YTD. In contrast, the CF Digital Culture Composite Index continued to struggle, slipping 1.32% to deepen its YTD decline to -43.00%—the weakest performer in the series. While the gains in DeFi and Web3 suggest tentative buying interest in high-beta assets, persistent losses in digital culture tokens reflect investor caution. Overall, sentiment remains fragile amid sector-specific headwinds.
Volatility
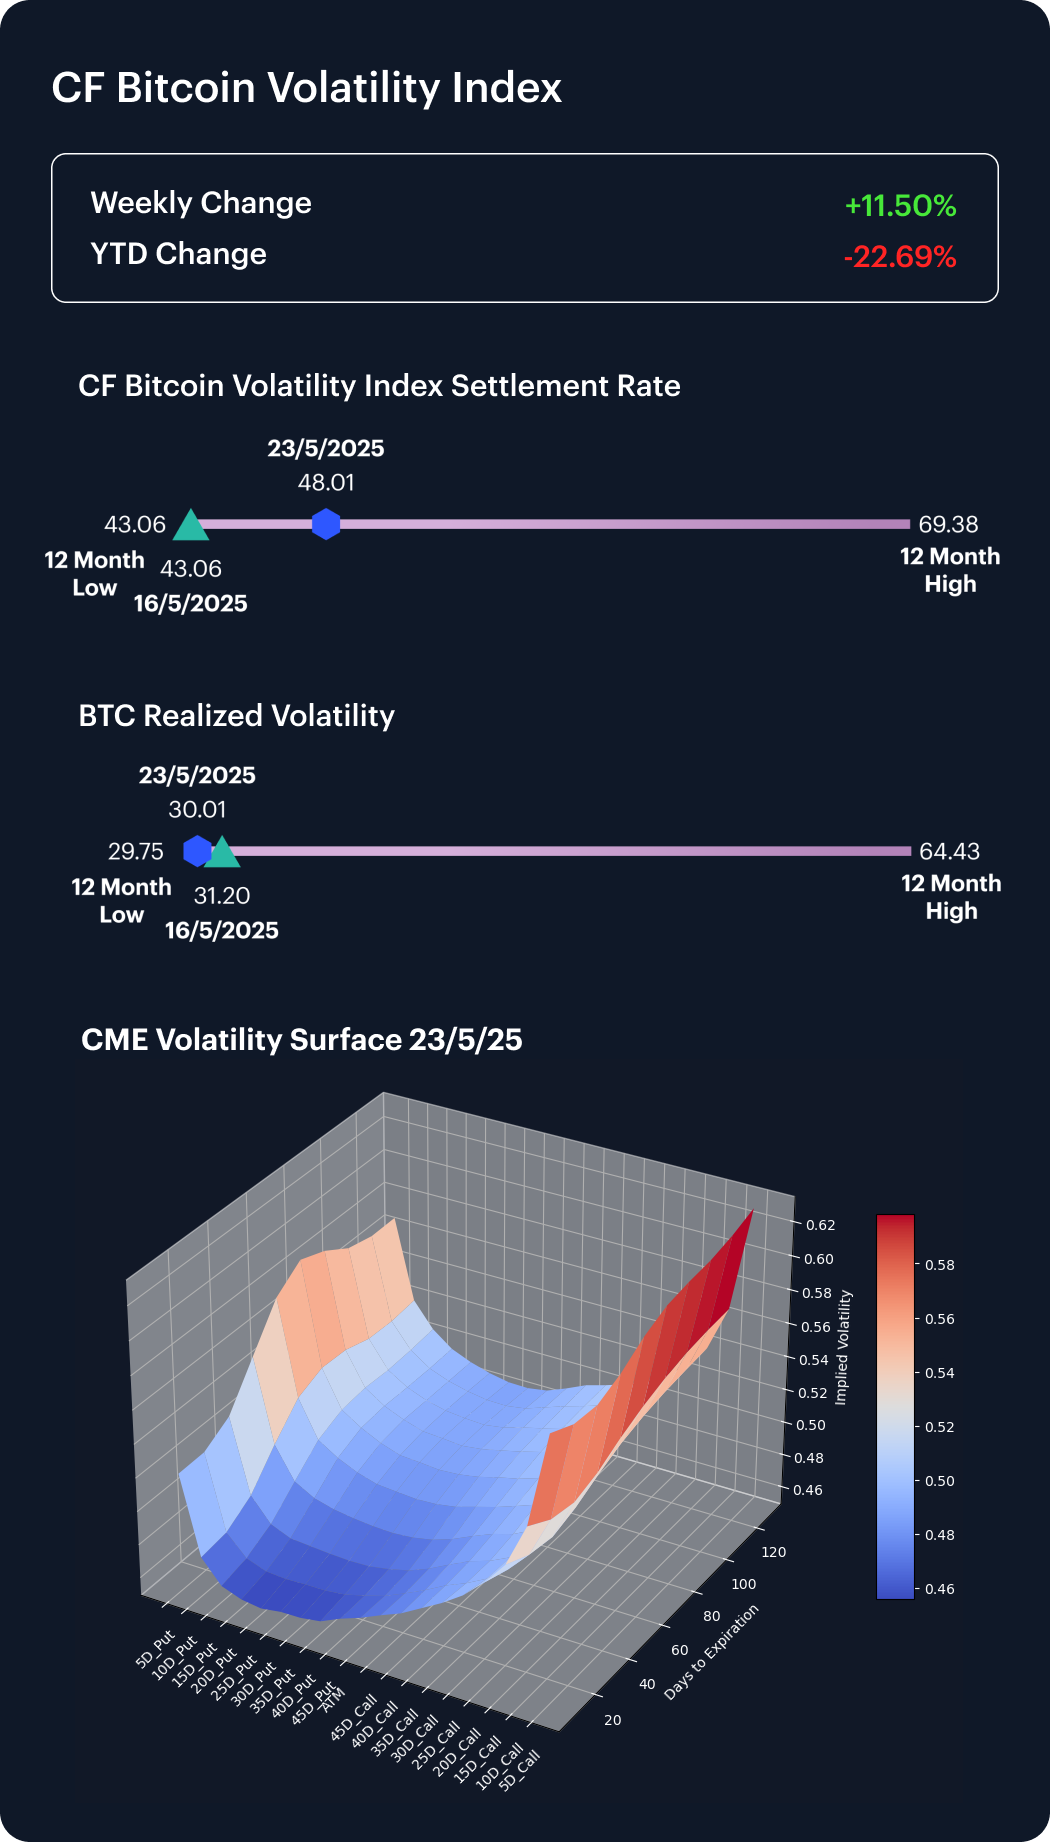
The CF Bitcoin Volatility Index Settlement Rate (BVXS) climbed sharply last week, rising 5.95 points to 48.01—a notable 11.50% increase that trims its year-to-date decline to 22.69%. The rebound in implied volatility suggests a renewed demand for hedging or directional exposure, likely tied to shifting expectations around macro or crypto-specific catalysts.
Realized volatility also edged lower, falling from 31.20 to 30.01, reinforcing the divergence between actual price movement and option pricing. CME Bitcoin Volatility Surface data continues to show a mild positive skew in 10 to 25 delta options. Elevated pricing in deep out-of-the-money calls—particularly long-dated 5-delta—implies that asymmetric upside bets remain popular, even as broader realized volatility remains suppressed.
Interest Rate Analysis
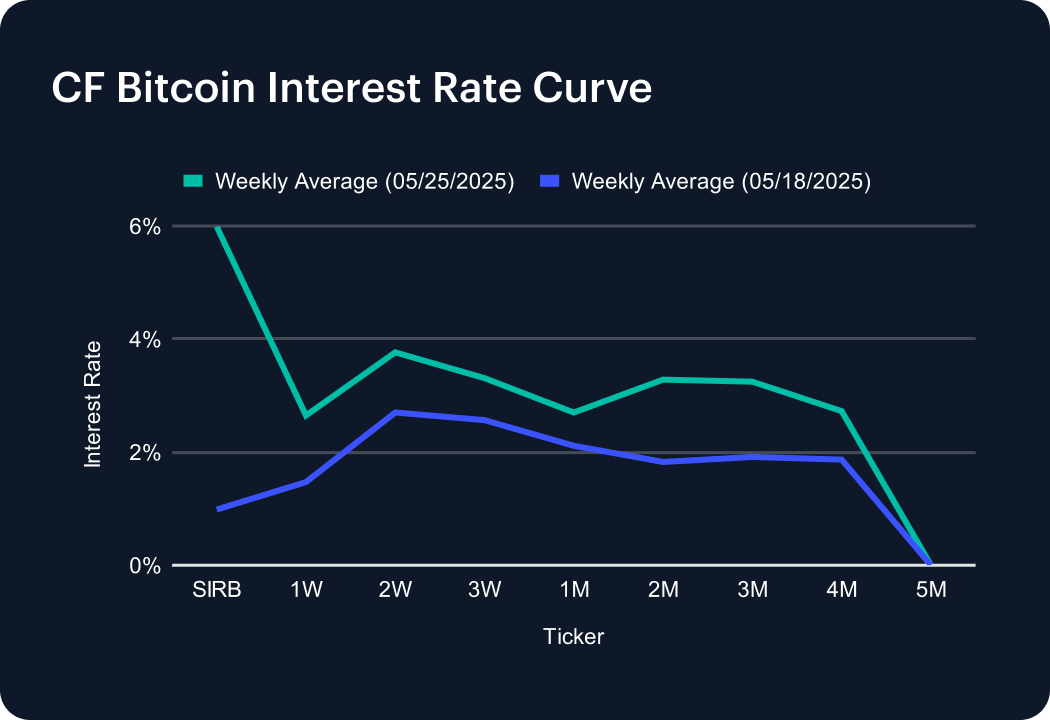
The CF Bitcoin Interest Rate Curve rose sharply last week, reversing the prior decline as funding costs climbed across nearly all tenors. The Short-Term Interest Rate Benchmark (SIRB) surged to 5.99% from 0.98%, indicating a renewed spike in near-term borrowing demand. The 1-week and 2-week rates increased to 2.65% and 3.77%, respectively, reflecting stronger appetite for short-duration leverage. Mid-curve tenors also moved higher, with the 1-month rate reaching 2.70%, and 2- to 4-month maturities rising steadily. The 5-month tenor remained flat at zero. The broad curve steepening suggests a return of speculative positioning and short-term risk-taking.
The information contained within is for educational and informational purposes ONLY. It is not intended nor should it be considered an invitation or inducement to buy or sell any of the underlying instruments cited including but not limited to cryptoassets, financial instruments or any instruments that reference any index provided by CF Benchmarks Ltd. This communication is not intended to persuade or incite you to buy or sell security or securities noted within. Any commentary provided is the opinion of the author and should not be considered a personalised recommendation. Please contact your financial adviser or professional before making an investment decision.
Note: Some of the underlying instruments cited within this material may be restricted to certain customer categories in certain jurisdictions.
Changes to the Token Market Price Benchmarks Series - Market Prices – 21 July 2026
The Administrator has confirmed changes to the Token Market Price Family for the period 14 July 2026 to 21 July 2026.

CF Benchmarks
Softer CPI Reprices July Hike Risk & Lifts Digital Assets
Digital assets extended their recovery over the past week as cooler US inflation prints repriced Fed expectations; the bid was broad across the large cap indices, growth factor leadership returned, stablecoin funding repriced lower, and stress stayed isolated in names hit by token-specific news.
Mark Pilipczuk
Notice of the Demising of CF Dai-Dollar Settlement Price and Spot Rate
The Administrator announces that it will demise the CF Dai-Dollar Settlement Price (DAIUSD_RR) and CF Dai-Dollar Spot Rate (DAIUSD_RTI) which are members of the CF Digital Asset Index Family.
CF Benchmarks
By clicking Accept, you consent to CF Benchmarks's use of cookies.
Visit Cookie Settings to learn how CF Benchmarks uses cookies and to adjust your preferences.