
Jun 10, 2025
Weekly Index Highlights, June 9, 2025
Market Performance Update
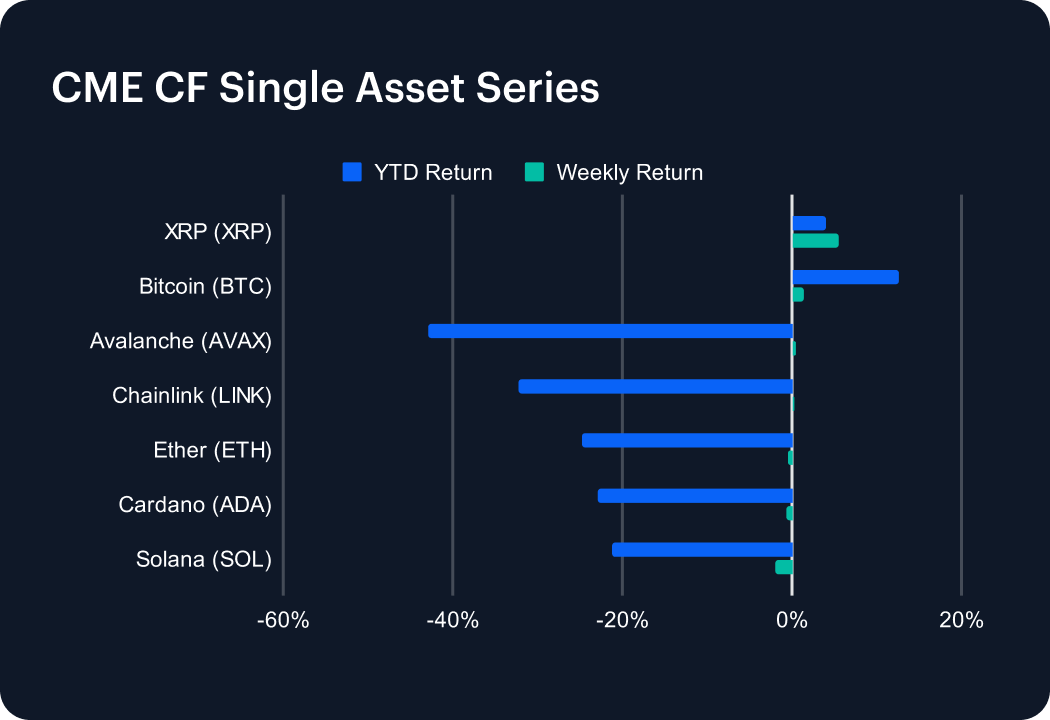
The digital asset market saw mixed performance last week, with gains in some major tokens. XRP (XRP) was the best performer among large-cap assets, climbing 5.46% and lifting its year-to-date (YTD) return to 3.93%. Bitcoin (BTC) posted a 1.45% gain, extending its YTD return to 12.58%, and maintaining its lead over other large-cap assets. Avalanche (AVAX) and Chainlink (LINK) edged up 0.41% and 0.22%, though their YTD losses remain steep at -42.90% and -32.19%, respectively. Ether (ETH) slipped 0.47%, holding near a -24.71% YTD return. Cardano (ADA) declined 0.66%, deepening its YTD loss to -22.91%. Solana (SOL) was the weakest major token, falling 2.01% and pushing its YTD return down to -21.25%. Market sentiment appears optimistic as institutional participation in digital asset markets picks up.

Sector Analysis
Digital asset sub-categories posted mixed results last week, with notable strength in select segments. In Borrowing & Lending, COMP led all gainers with a 16.82% surge, while ONDO held flat and SPELL slipped 2.06%. Trading assets broadly outperformed, with KNC (+5.52%), UNI (+1.28%), and BAL (+0.95%) leading gains, while CRV (-1.79%) and LRC (-4.66%) underperformed. Among Smart Contract Platforms, ICP rallied 11.43%, while EOS (-8.18%) and FTM (-6.11%) extended losses. In Specialized Platforms, Injective (INJ) jumped 13.19%, contrasting with a modest 0.95% drop in SEI. Culture & Gaming was mostly weak, with PRIME (-8.10%) and SUPER (-4.79%) dragging the segment, though APE gained 7.11%. Interoperability standout QNT rose 10.69%. Overall, dispersion widened across categories, with strength concentrated in lending and infrastructure-linked assets.
Staking Metrics
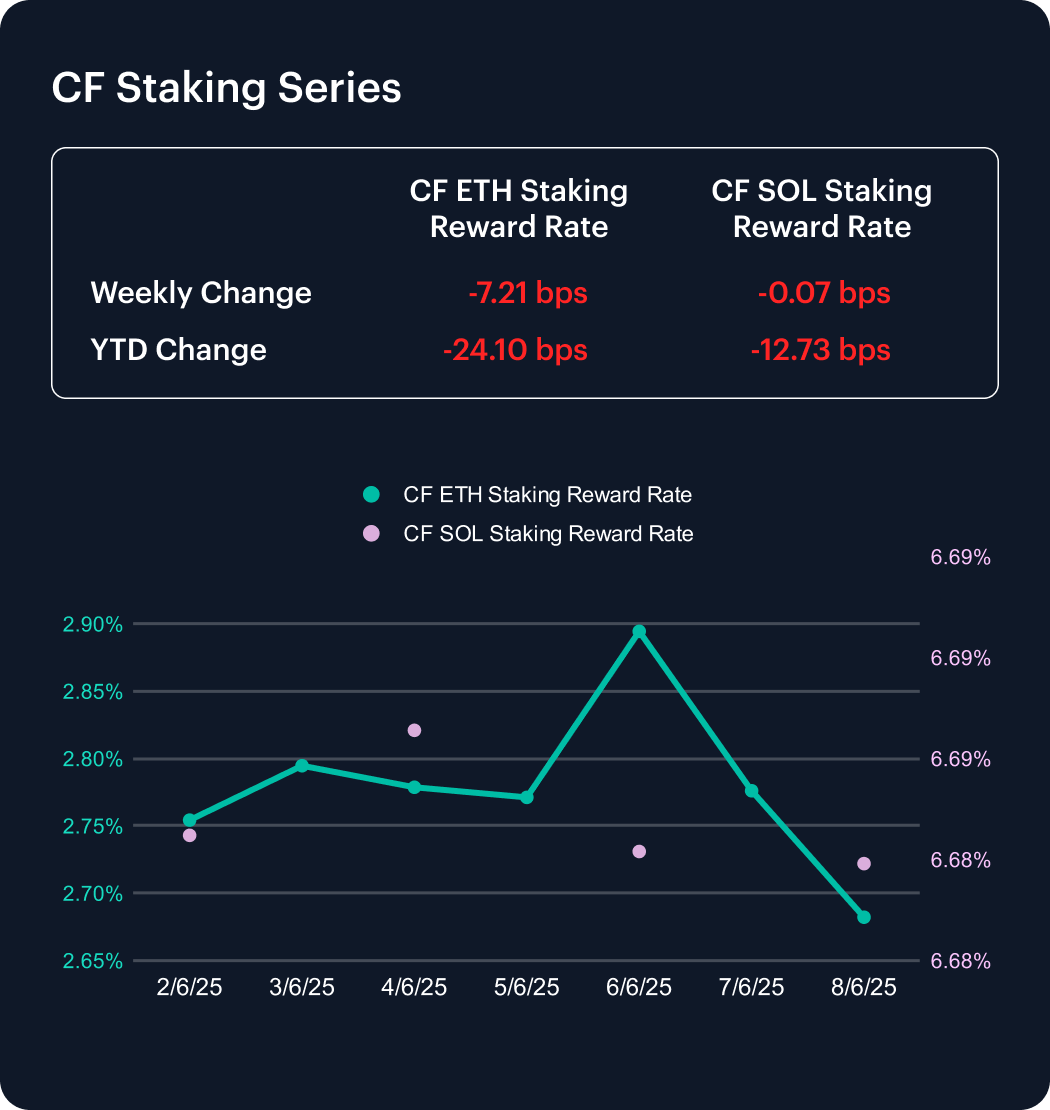
The CF Ether Staking Reward Rate Index (ETH_SRR) fell 7.21 basis points last week to 2.68%, marking a 2.62% decline. The index is now down 24.1 bps YTD from 2.92%, reflecting an 8.24% decrease and signaling persistent pressure on Ethereum staking yields.
Meanwhile, the CF SOL Staking Reward Rate Index (SOL_SRR) was essentially flat, dipping just 7 bps to 6.68%, a marginal 0.01% decline. Solana’s YTD decrease now totals 12.73 bps, or 1.87%. As Ethereum’s staking yields compress more sharply, the gap in reward rates between leading proof-of-stake networks continues to underscore divergent dynamics in staking economics.
Market Cap Index Performance
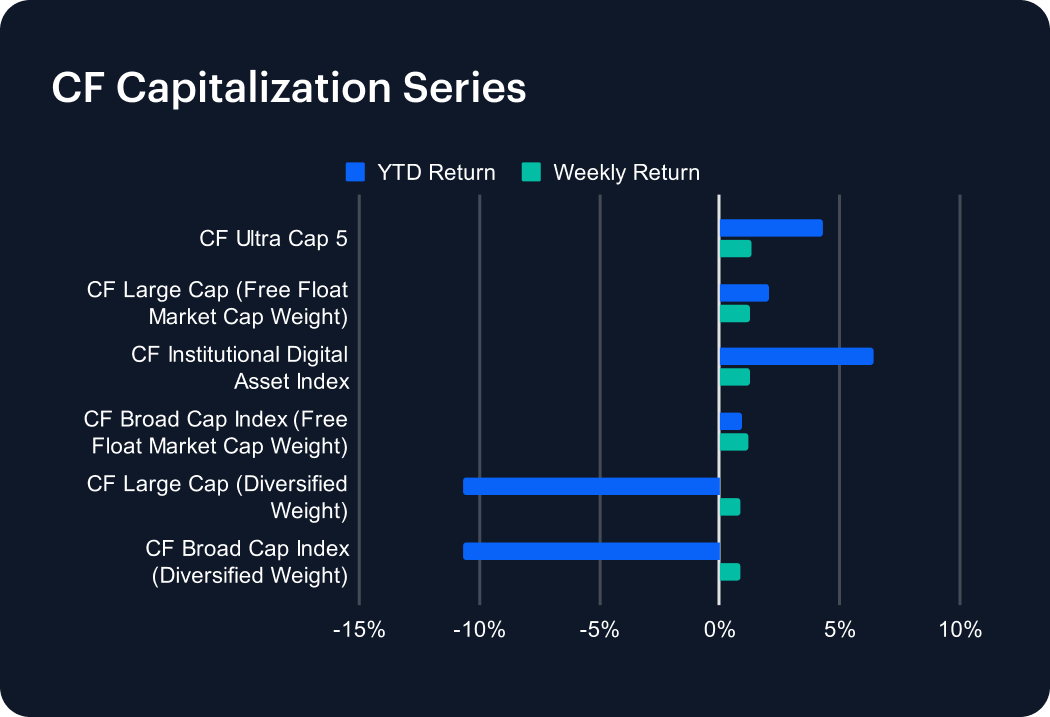
The CF Capitalization Series rallied across the board last week, with all major indices posting gains. The CF Ultra Cap 5 led the recovery, rising 1.31% and boosting its year-to-date (YTD) return to 4.32%. The CF Institutional Digital Asset Index and the CF Large Cap Free Float Index each climbed 1.23%, with the former now up 6.40% YTD. The CF Broad Cap Free Float Index followed closely, adding 1.20% for a YTD gain of 0.95%. Diversified-weighted indices underperformed again, albeit posting positive returns—CF Large Cap and CF Broad Cap rose 0.90% and 0.84%, respectively, though both remain down over 10% YTD. The rebound reflects improving sentiment, yet persistent drag from small-cap exposure continues to weigh on diversified benchmarks.
Classification Series Analysis
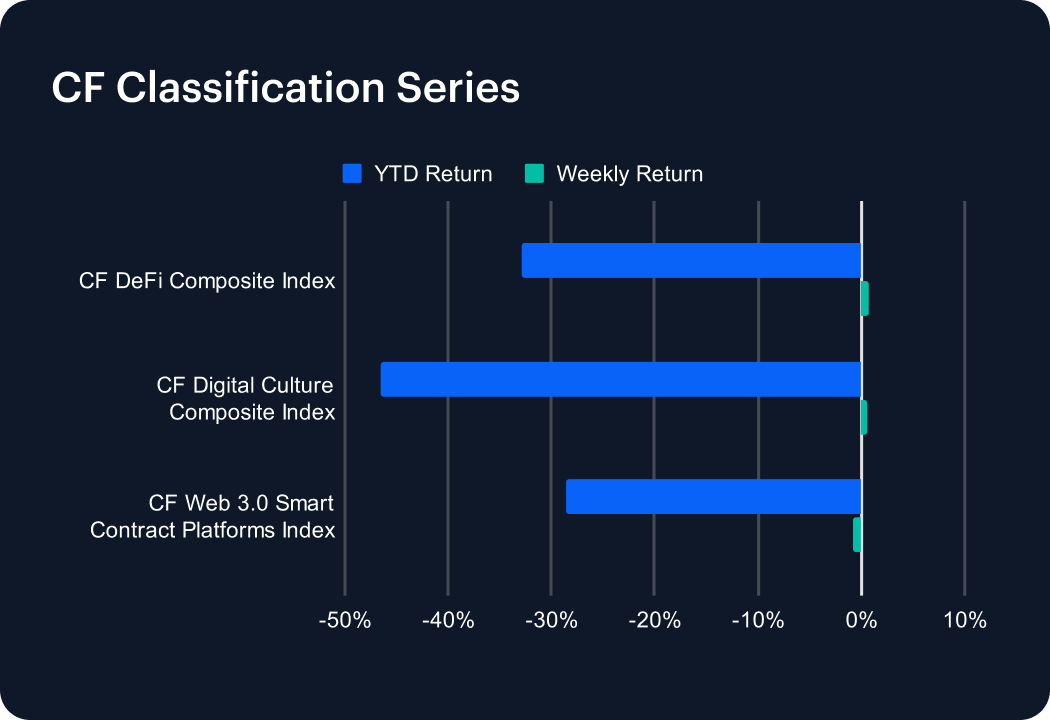
The CF Classification Series Indices underperformed broader market benchmarks last week. The CF Web 3.0 Smart Contract Platforms Index was the only decliner, slipping 0.82% and extending its year-to-date (YTD) loss to -28.58%. In contrast, the CF DeFi Composite Index posted a modest gain of 0.74%, slightly trimming its YTD decline to -32.90%. The CF Digital Culture Composite Index also edged up 0.58%, though it remains the weakest performer in 2025 with a cumulative drop of -46.57%. The data suggests a tentative stabilization across high-beta thematic segments, yet persistent negative returns highlight lingering risk aversion. Broader sentiment remains fragile as speculative assets struggle to regain sustained investor interest.
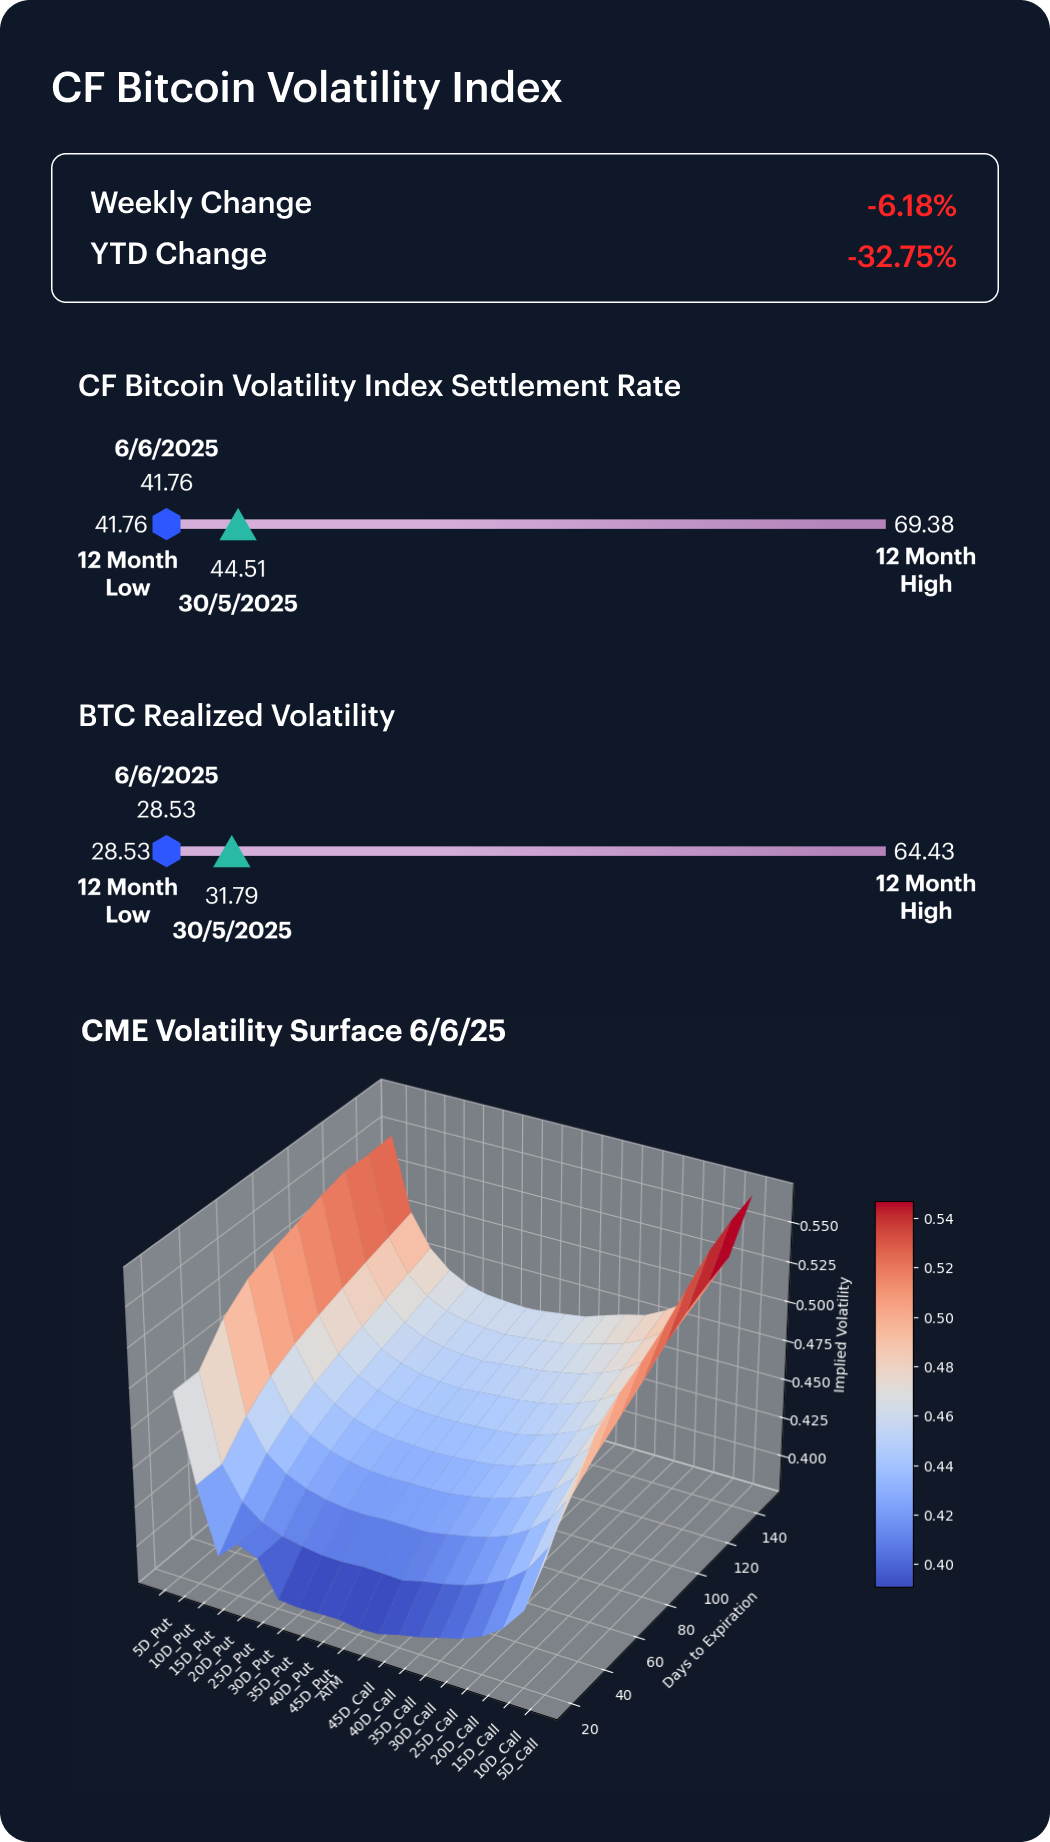
Volatility
The CF Bitcoin Volatility Index Settlement Rate (BVXS) fell 2.17 points last week to 41.76, a 6.18% decline that deepens its year-to-date drop to 32.75%. This marks a fresh 12-month low, reinforcing the downtrend in implied volatility amid quieter market conditions. Realized volatility also eased, slipping from 30.49 to 28.53, further tightening the vol gap.
Options market dynamics suggest a constructive tone, with a positive skew toward the call side observed at the 10-, 15-, 20-, and 25-delta levels—pointing to persistient interest in upside exposure. Meanwhile, the overall convexity of the volatility surface has decreased, indicating diminished pricing for extreme tail events. Despite subdued volatility, positioning hints that bullish sentiment remains in the market.
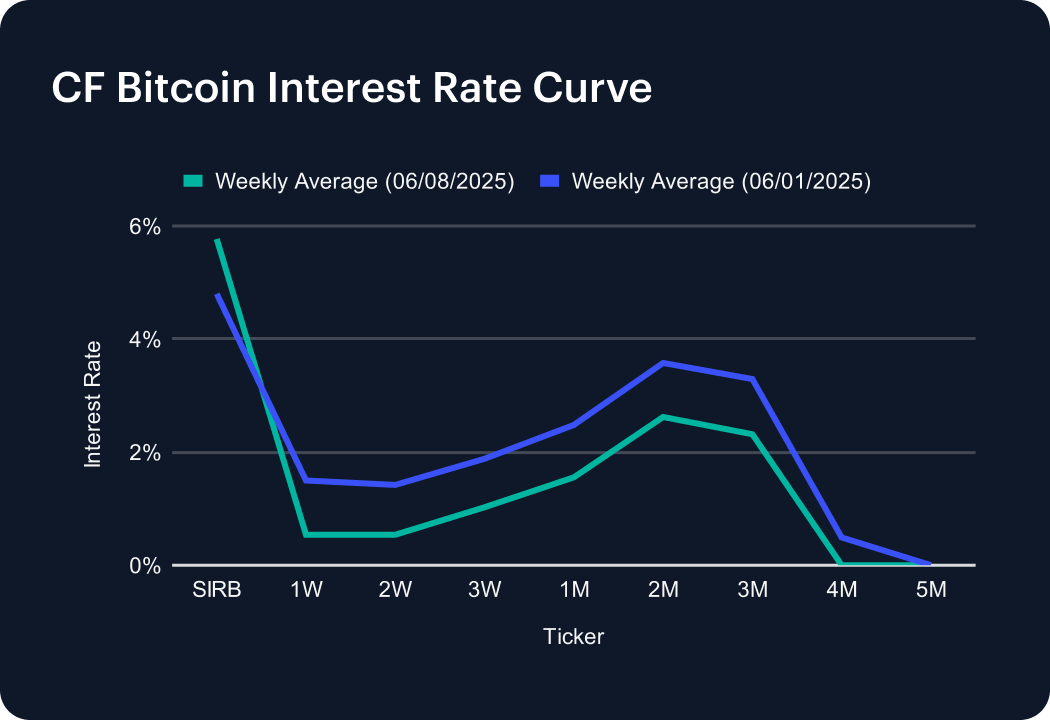
Interest Rate Analysis
The CF Bitcoin Interest Rate Curve steepened last week, reversing the prior flattening trend. The Short-Term Interest Rate Benchmark (SIRB) climbed to 5.77% from 4.80%, reflecting increased near-term borrowing demand. Despite this, short-dated tenors saw sharp declines: the 1-week and 2-week rates dropped to 0.54%, down from 1.50% and 1.42%, respectively. The 1-month average fell to 1.55%, while the 3-week and 2-month rates also eased to 1.02% and 2.62%. Notably, the 4-month rate dropped to 0.00%, indicating shrinking demand further out the curve. The mixed shifts suggest a reallocation of leverage toward short maturities as volatility declines.
The information contained within is for educational and informational purposes ONLY. It is not intended nor should it be considered an invitation or inducement to buy or sell any of the underlying instruments cited including but not limited to cryptoassets, financial instruments or any instruments that reference any index provided by CF Benchmarks Ltd. This communication is not intended to persuade or incite you to buy or sell security or securities noted within. Any commentary provided is the opinion of the author and should not be considered a personalised recommendation. Please contact your financial adviser or professional before making an investment decision.
Note: Some of the underlying instruments cited within this material may be restricted to certain customer categories in certain jurisdictions.
Changes to the Token Market Price Benchmarks Series - Market Prices – 21 July 2026
The Administrator has confirmed changes to the Token Market Price Family for the period 14 July 2026 to 21 July 2026.

CF Benchmarks
Softer CPI Reprices July Hike Risk & Lifts Digital Assets
Digital assets extended their recovery over the past week as cooler US inflation prints repriced Fed expectations; the bid was broad across the large cap indices, growth factor leadership returned, stablecoin funding repriced lower, and stress stayed isolated in names hit by token-specific news.
Mark Pilipczuk
Notice of the Demising of CF Dai-Dollar Settlement Price and Spot Rate
The Administrator announces that it will demise the CF Dai-Dollar Settlement Price (DAIUSD_RR) and CF Dai-Dollar Spot Rate (DAIUSD_RTI) which are members of the CF Digital Asset Index Family.
CF Benchmarks
By clicking Accept, you consent to CF Benchmarks's use of cookies.
Visit Cookie Settings to learn how CF Benchmarks uses cookies and to adjust your preferences.