
Jun 30, 2025
Weekly Index Highlights, June 30, 2025
Market Performance Update
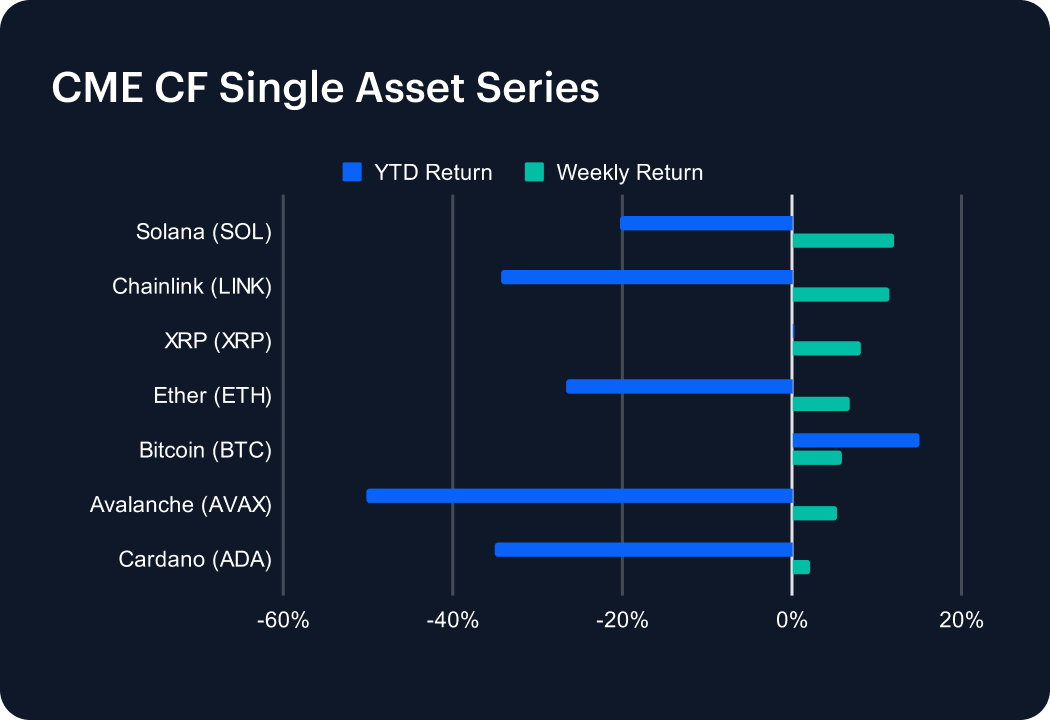
The digital-asset market staged a relief rally last week, with every major token in our basket finishing in the green. Solana (SOL) led the turnaround, jumping 11.98% and trimming its year-to-date (YTD) slide to -20.21%. Chainlink (LINK) followed closely, adding 11.53% but still down -34.21% YTD. Ripple’s XRP (XRP) advanced 8.08%, nudging its YTD performance back into positive territory at 0.21%. Ether (ETH) climbed 6.84%, narrowing its YTD deficit to -26.68%, while Bitcoin (BTC) gained 5.94%, extending its YTD return to 14.99%. Avalanche (AVAX) and Cardano (ADA) rose 5.41% and 2.21%, easing their YTD losses to -50.25% and -35.03%, respectively. Easing geopolitical anxieties and continued ETF inflows underpinned last week’s rebound.
Sector Analysis
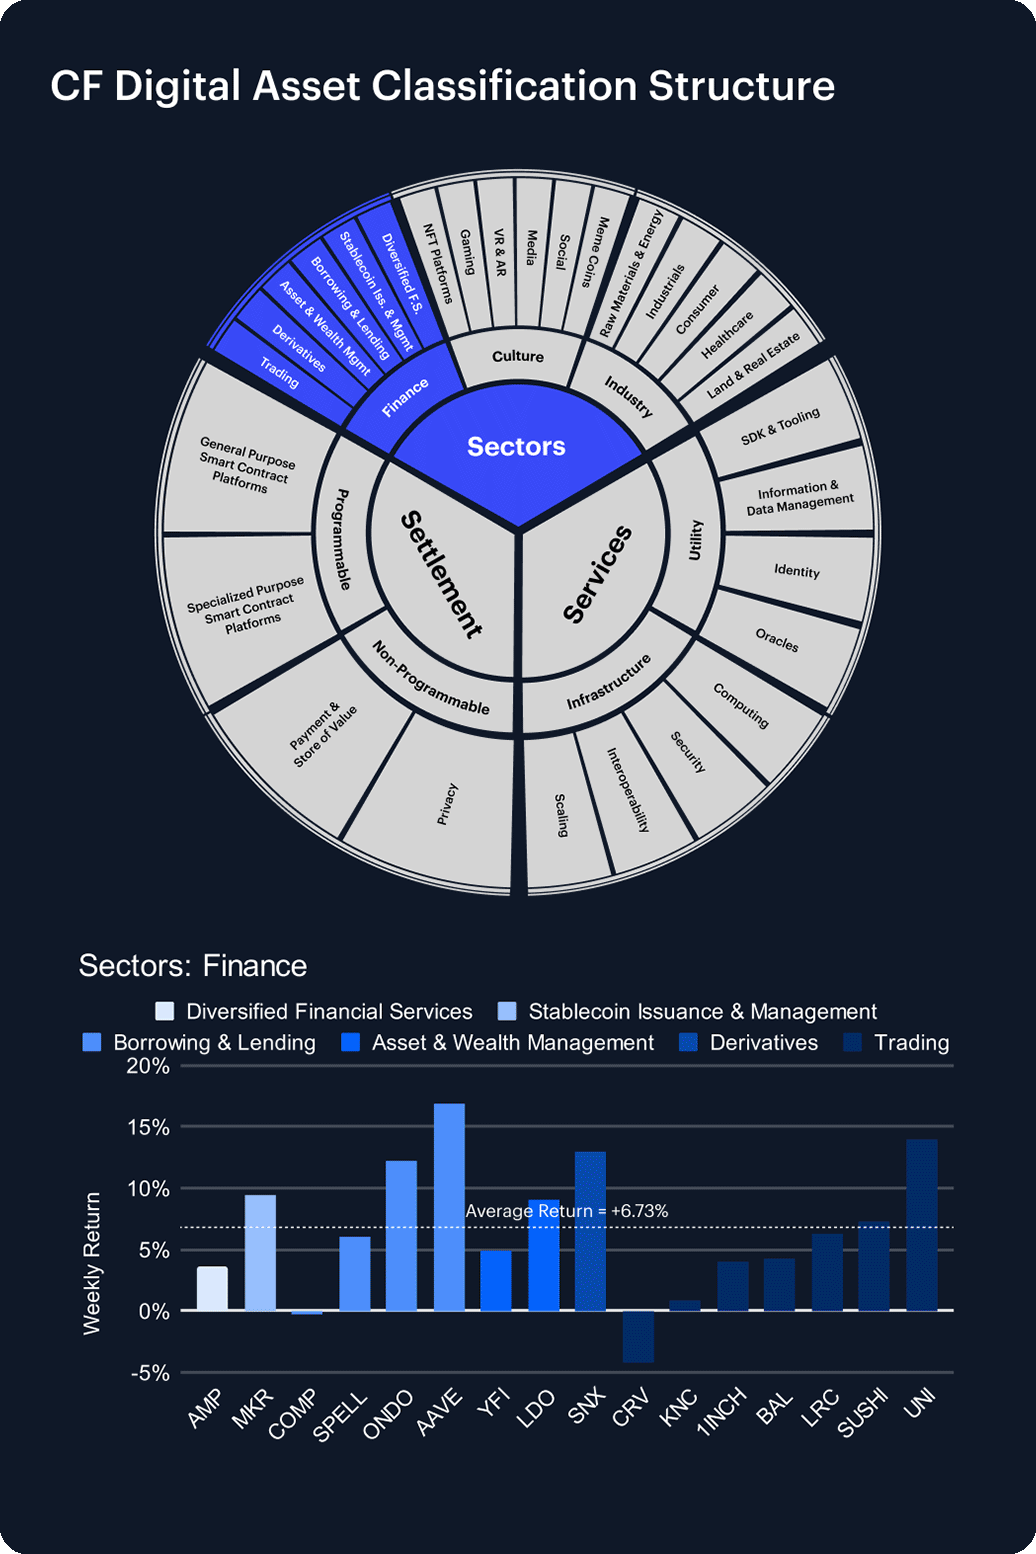
Digital assets rallied across every DACS segment last week, retracing some of the losses from the prior week. The standout winner was specialized smart-contract platform SEI, which skyrocketed 48.15%. Culture tokens also lit up the leaderboard: RARI surged 33.12%, while gaming names SUPER and PRIME jumped 24.88% and 22.03%, respectively. Within Finance, AAVE (+16.91%) and ONDO (+12.24%) paced a broad upswing, and derivatives token SNX added 12.97%. Infrastructure names were strong too, led by QNT (+18.97%) and STX (+14.84%). On the other side, only a handful of assets finished in the red, TIA (-0.40%), COMP (-0.24%), SAND (-0.04%) and CRV (-4.14%) lagged. Segment dispersion narrowed materially, skewing decisively to the upside.
Staking Metrics
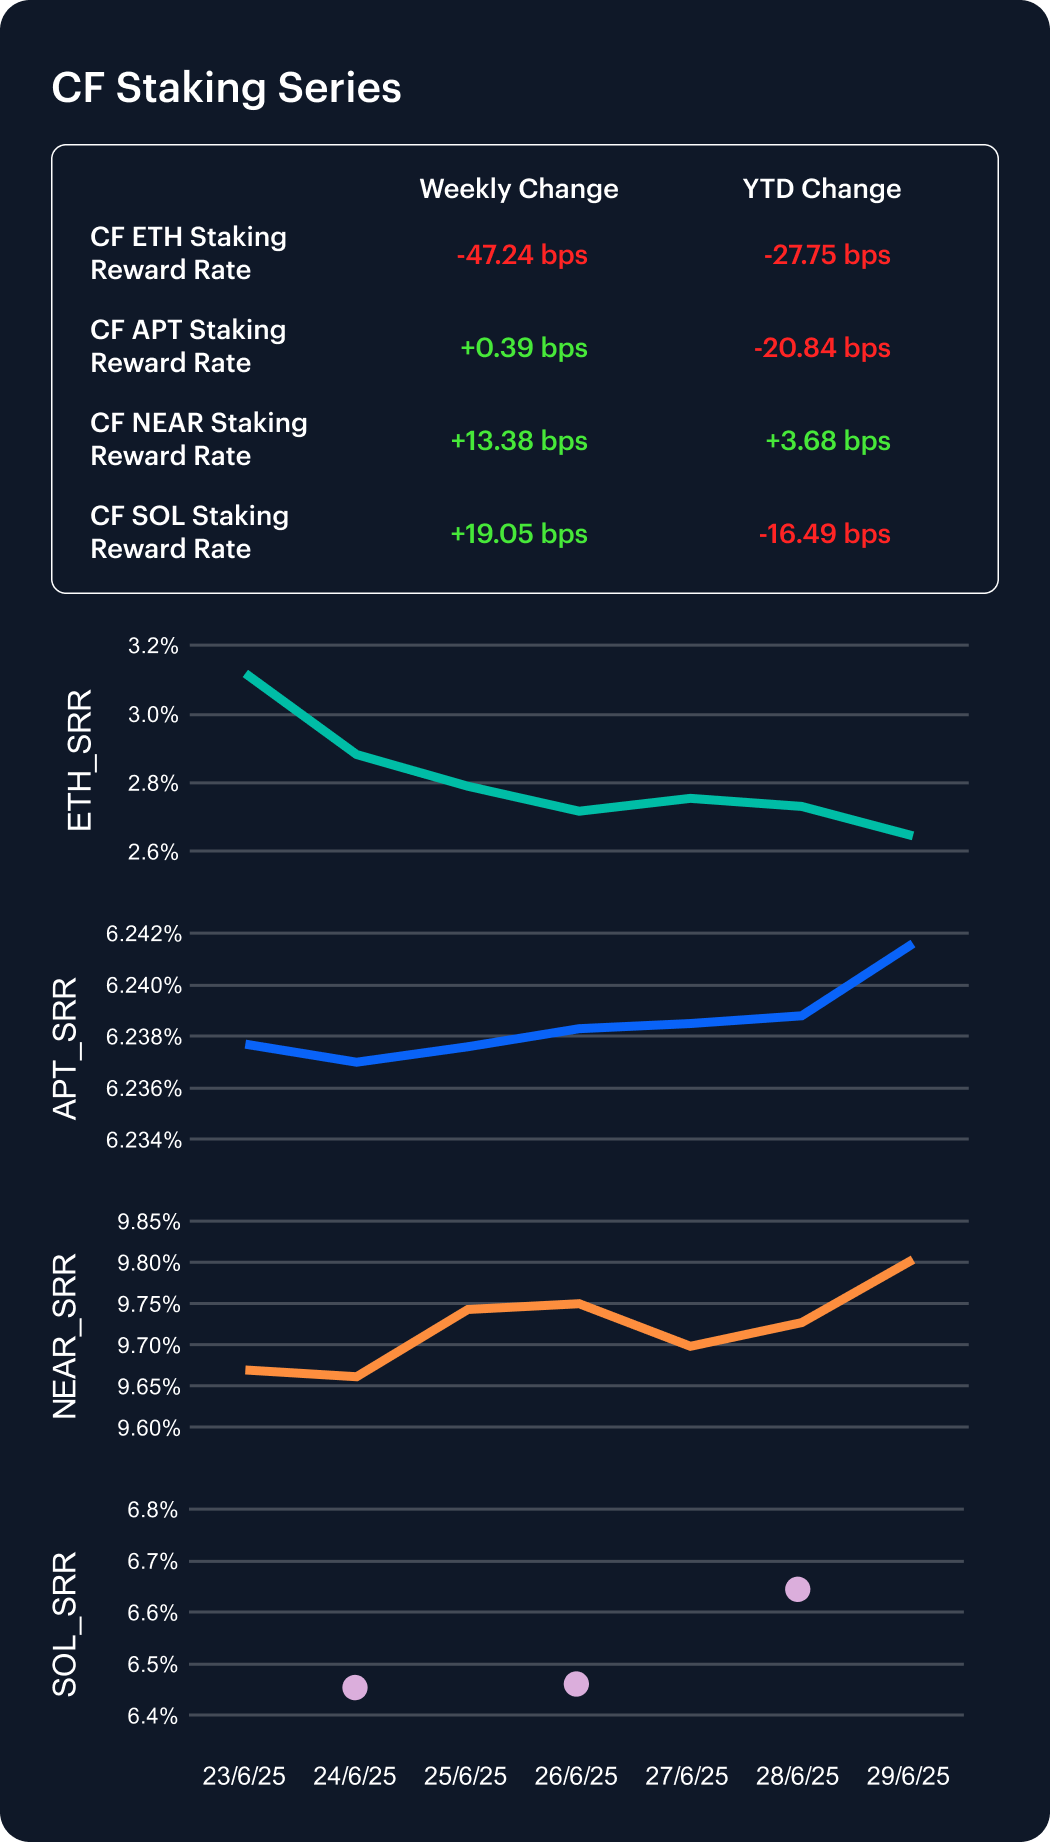
The CF Ether Staking Reward Rate Index (ETH_SRR) slumped 47 bps to 2.65% last week, a 15.2% drop that pushed its YTD decline to -9.5% and left it the clear laggard. At the other extreme, NEAR staking yields climbed 13 bps to 9.80%, extending a modest YTD gain (+0.4%) and seizing leadership of the reward curve. Solana’s SOL_SRR also firmed, adding 19 bps to 6.64% for a 3.0% weekly lift, though still 17 bps below its New-Year level. Aptos (APT_SRR) was essentially flat at 6.24%, inching up less than half a basis point and remaining 20 bps lower YTD. Diverging on-chain activity and supply inflation continues to separate proof-of-stake chains.
Market Cap Index Performance
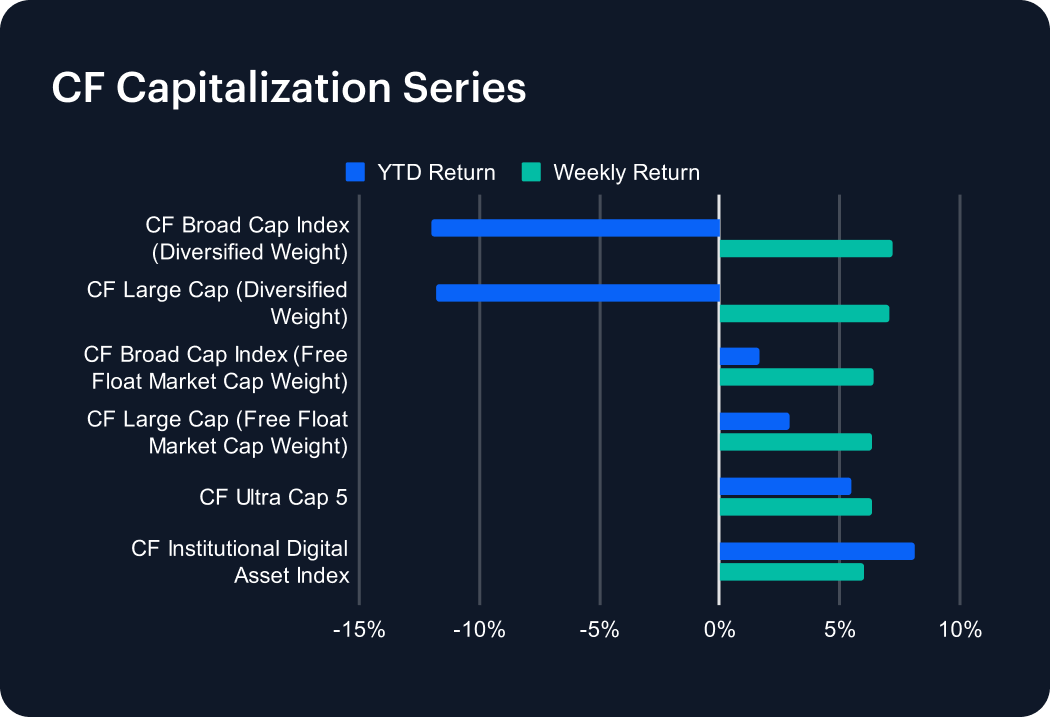
The CF Capitalization Series rebounded sharply last week, with every benchmark posting gains of roughly 6–7%. Diversified-weight gauges, which led the prior drawdown, staged the biggest bounce: the CF Broad Cap (Diversified) climbed 7.20%, trimming its YTD loss to –11.98%, while the CF Large Cap (Diversified) advanced 7.07% to –11.79% YTD. Free-float indices also participated, rising about 6.4% apiece; their earlier resilience means both now sit in positive territory for the year, led by the CF Large Cap (FF) at +2.90% YTD. The CF Ultra Cap 5 added 6.32%, extending its lead to +5.45% YTD, yet the best performer remains the CF Institutional Digital Asset Index, up 6.04% on the week and 8.09% year-to-date.
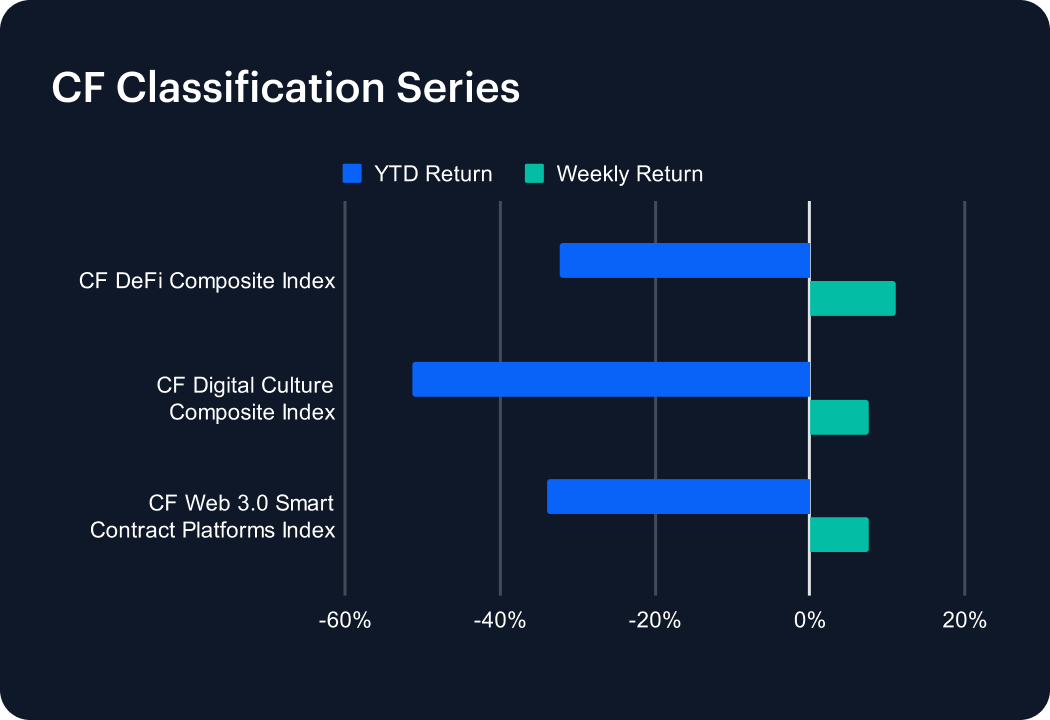
Classification Series Analysis
The CF Classification Series snapped back last week, with each thematic benchmark closing higher after the prior rout. DeFi led the charge: the CF DeFi Composite Index rallied 11.14%, trimming its year-to-date losses to -32.19%. Digital Culture followed with a 7.68% gain, although its YTD decline remains the deepest at -51.25%. The CF Web 3.0 Smart Contract Platforms Index added 7.62%, easing its annual slide to -33.86%. The broad-based rebound suggests risk appetite is cautiously returning to high-beta segments, yet steep double-digit YTD losses underscore how far valuations still sit below January levels.
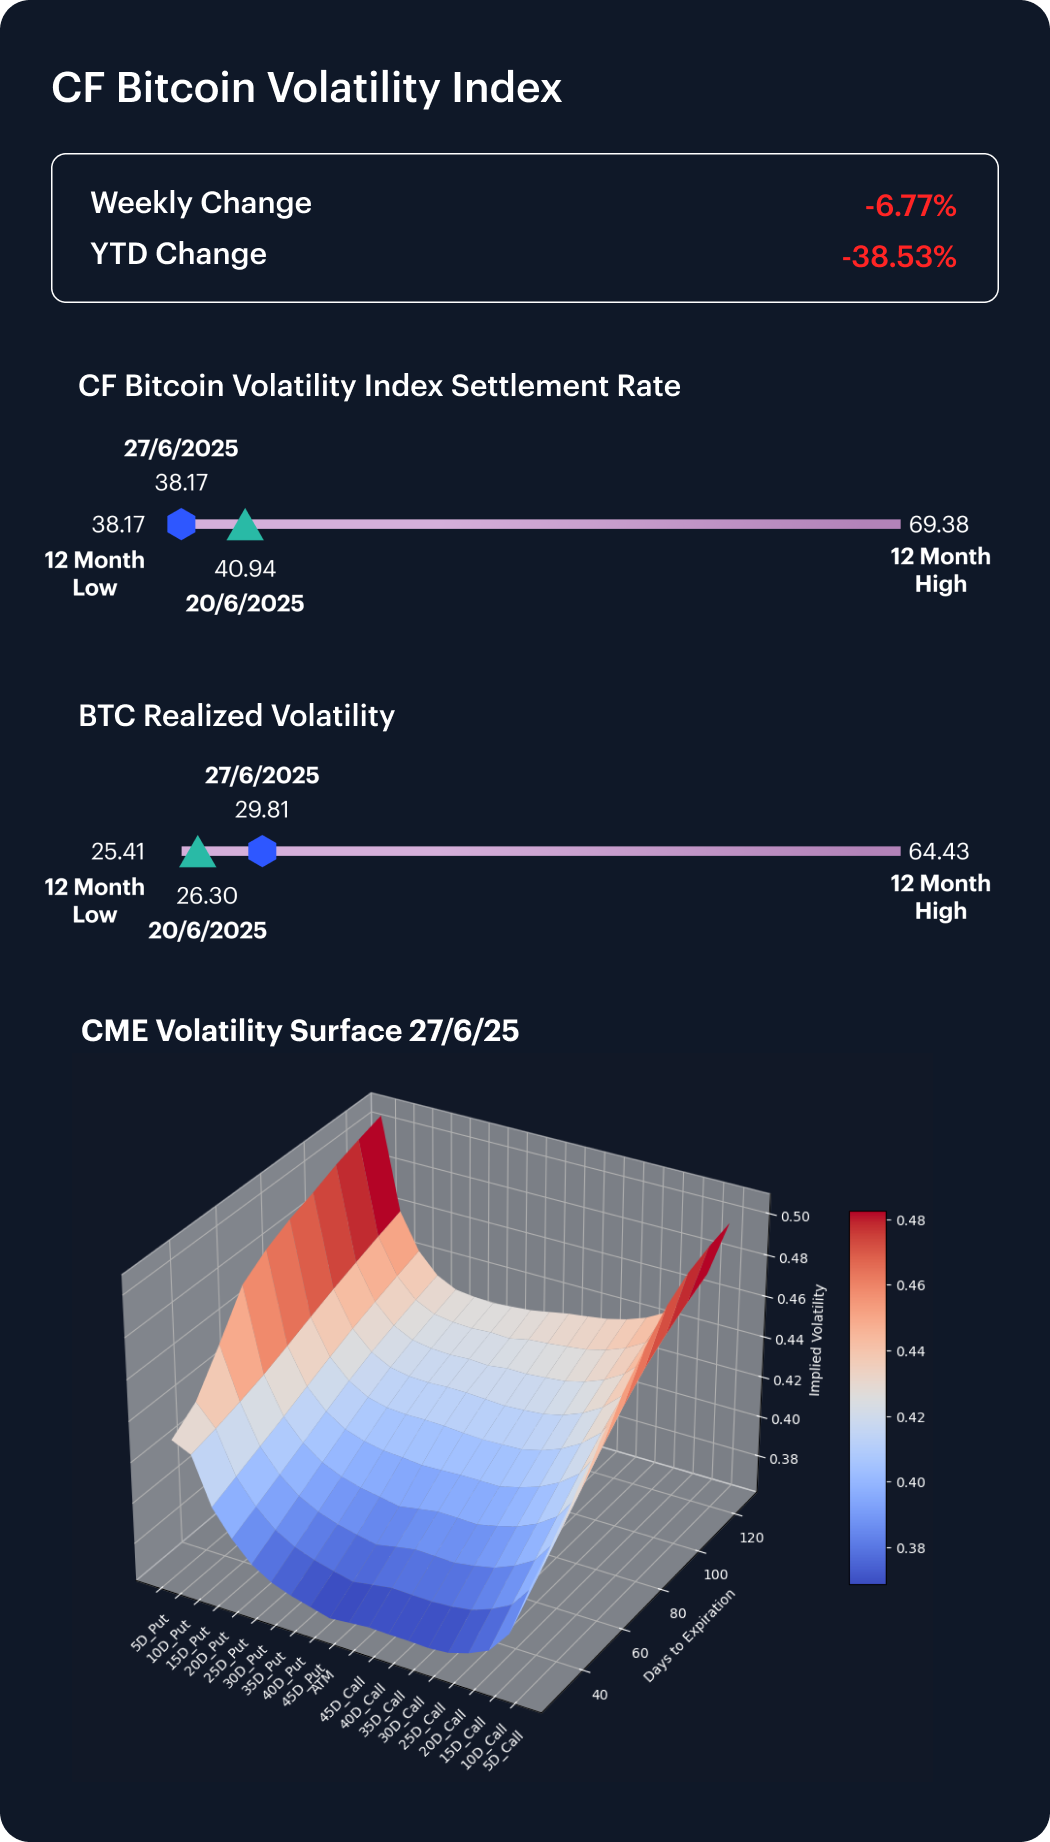
Volatility
The CF Bitcoin Volatility Index Settlement Rate (BVXS) slipped to a 12-month low of 38.17 last week, down 2.8 points (-6.8%) and 38.5% beneath its 1-January mark. Yet realized volatility firmed, climbing to 29.81 from 26.30 (+13%), signaling livelier spot swings even as option premia compress.
Skew across 10-, 15-, 20- and 25-delta strikes is still negative but edging toward parity, hinting at waning demand for drawdown protection. Near-term IV (sub-60-day expiries) saw the sharpest drop, flattening the front of the surface, while longer-dated options retained a volatility premium. Although BVXS now hovers just four points above its cyclical floor, the mix of softer near-term IV, firmer realized prints and neutralizing skew depicts a market rotating away from urgent hedging.
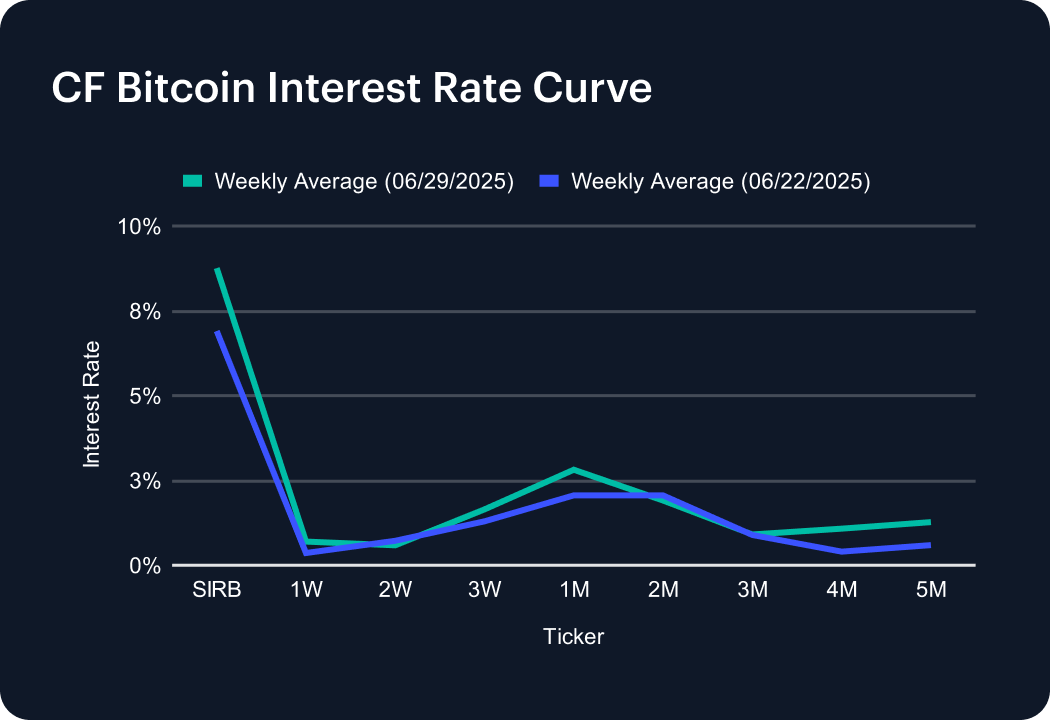
Interest Rate Analysis
Short-term funding costs snapped higher last week as the CF Bitcoin Interest Rate Curve shifted upward across most tenors. The Short-Term Interest Rate Benchmark (SIRB) jumped 186 bps to 8.76%, reversing the prior week’s decline. At the very front end, the 1-week rate climbed 34 bps to 0.70%, while the 2-week tenor softened 13 bps to 0.59%, creating an atypical kink in the curve. Mid-curve benchmarks firmed: 3-week rates rose 36 bps to 1.65% and the 1-month average surged 75 bps to 2.81%. Longer tenors moved in tandem, with both 4- and 5-month rates adding 68 bps to 1.08% and 1.27%, respectively. The result is a steeper curve anchored by a sharply higher short rate yet scattered term spreads.
The information contained within is for educational and informational purposes ONLY. It is not intended nor should it be considered an invitation or inducement to buy or sell any of the underlying instruments cited including but not limited to cryptoassets, financial instruments or any instruments that reference any index provided by CF Benchmarks Ltd. This communication is not intended to persuade or incite you to buy or sell security or securities noted within. Any commentary provided is the opinion of the author and should not be considered a personalised recommendation. Please contact your financial adviser or professional before making an investment decision.
Note: Some of the underlying instruments cited within this material may be restricted to certain customer categories in certain jurisdictions.
Changes to the Token Market Price Benchmarks Series - Market Prices – 21 July 2026
The Administrator has confirmed changes to the Token Market Price Family for the period 14 July 2026 to 21 July 2026.

CF Benchmarks
Softer CPI Reprices July Hike Risk & Lifts Digital Assets
Digital assets extended their recovery over the past week as cooler US inflation prints repriced Fed expectations; the bid was broad across the large cap indices, growth factor leadership returned, stablecoin funding repriced lower, and stress stayed isolated in names hit by token-specific news.
Mark Pilipczuk
Notice of the Demising of CF Dai-Dollar Settlement Price and Spot Rate
The Administrator announces that it will demise the CF Dai-Dollar Settlement Price (DAIUSD_RR) and CF Dai-Dollar Spot Rate (DAIUSD_RTI) which are members of the CF Digital Asset Index Family.
CF Benchmarks
By clicking Accept, you consent to CF Benchmarks's use of cookies.
Visit Cookie Settings to learn how CF Benchmarks uses cookies and to adjust your preferences.