
Jun 23, 2025
Weekly Index Highlights, June 23, 2025
Market Performance Update
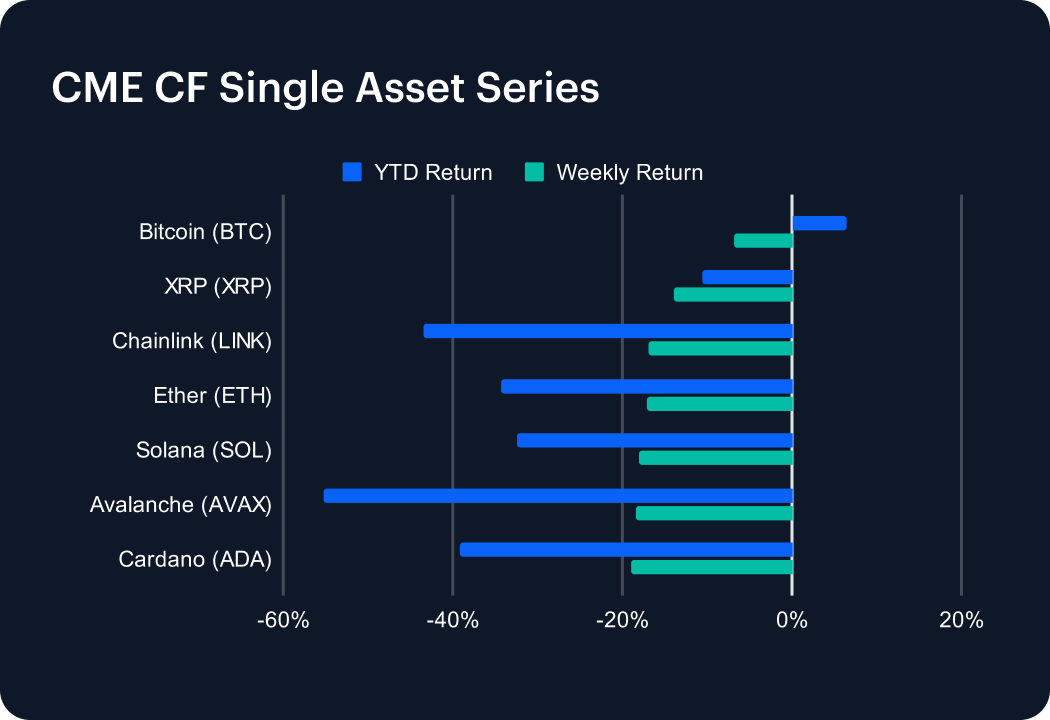
The digital asset market faced a sharp selloff last week, with most major tokens posting double-digit losses. Avalanche (AVAX) led the downturn, tumbling 18.44% and deepening its year-to-date (YTD) loss to -55.27%. Cardano (ADA) and Solana (SOL) followed with respective weekly declines of 18.91% and 17.99%, pushing their YTD returns to -39.08% and -32.50%. Ether (ETH) and Chainlink (LINK) both fell over 17%, now down -34.36% and -43.45% YTD. XRP (XRP) plunged 13.98%, worsening its YTD return to -10.61%. Even Bitcoin (BTC), typically more resilient, dropped 6.86%—its YTD performance trimmed to 6.45%. Geopolitical uncertainty overshadowed earlier optimism, with investors repositioning amid concerns over the budding conflict in Iran.
Sector Analysis
Digital assets saw steep declines across all DACS segments last week. In Borrowing & Lending, losses were heavy with AAVE (-23.52%) and ONDO (-22.15%) underperforming, while SPELL held up slightly better at -16.80%. The trading segment also broadly retreated, led by SUSHI (-21.67%) and UNI (-20.33%). Gaming and Social tokens struggled, with SUPER (-27.77%) and PRIME (-29.52%) posting the sharpest drops. Programmable assets were also hit hard; FTM plunged 28.45%, while INJ fell 22.19%. In Store-of-Value and Payment segment, BCH felt a more a modest -3.48% decline, contrasting with XRP (-13.98%) and XLM (-15.09%). Overall, segment dispersion widened further, skewed heavily to the downside.
Staking Metrics
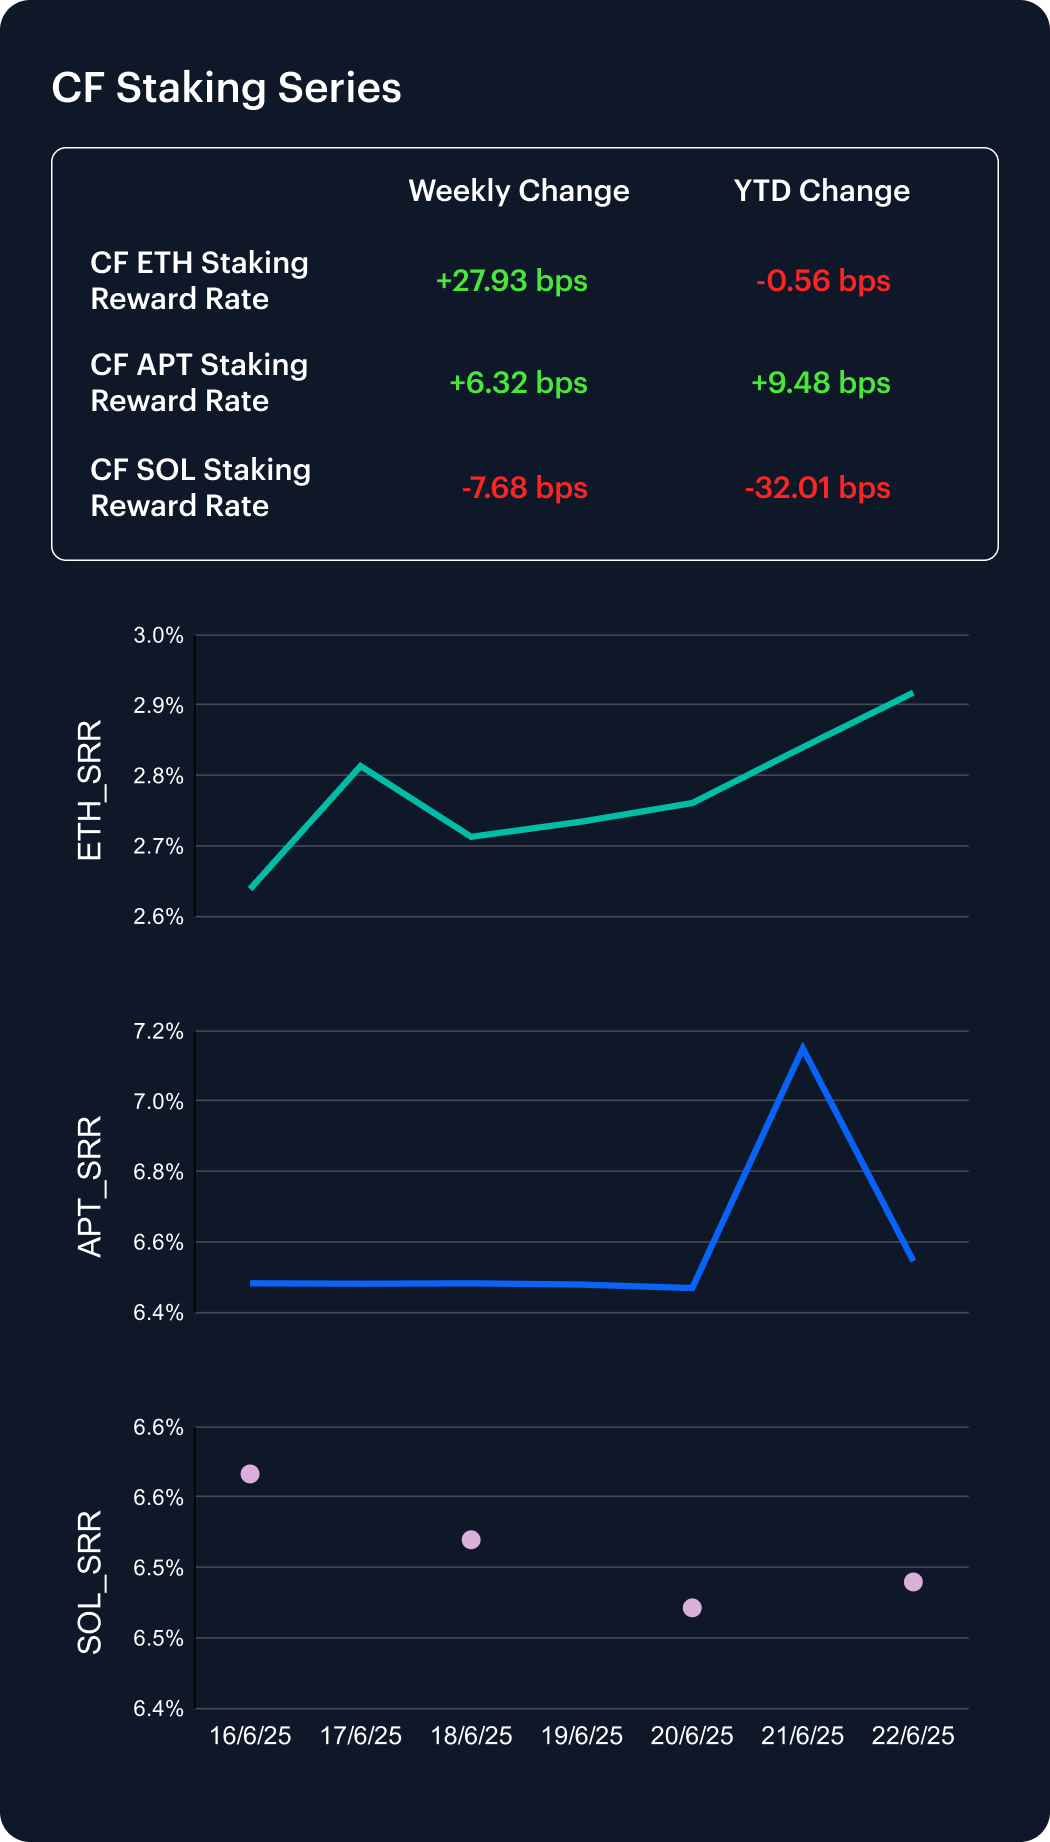
The CF Ether Staking Reward Rate Index (ETH_SRR) jumped 27.93 basis points last week to 2.92%, a 10.59% weekly gain that pared its YTD decline to just 0.19%. Aptos staking (APT_SRR) also saw a modest lift, rising 6.32 bps to 6.54% (+0.98% weekly; +1.47% YTD). Conversely, the CF SOL Staking Reward Rate Index (SOL_SRR) fell 7.68 bps to 6.49%, down 1.17% on the week and 4.70% lower year-to-date. Ethereum’s outsized rebound, contrasting with Solana’s persistent compression, highlights the impact of growing on-chain activity on proof-of-stake protocols. APT stands out as the sole asset with a higher staking rate than it had at the beginning of the year.
Market Cap Index Performance
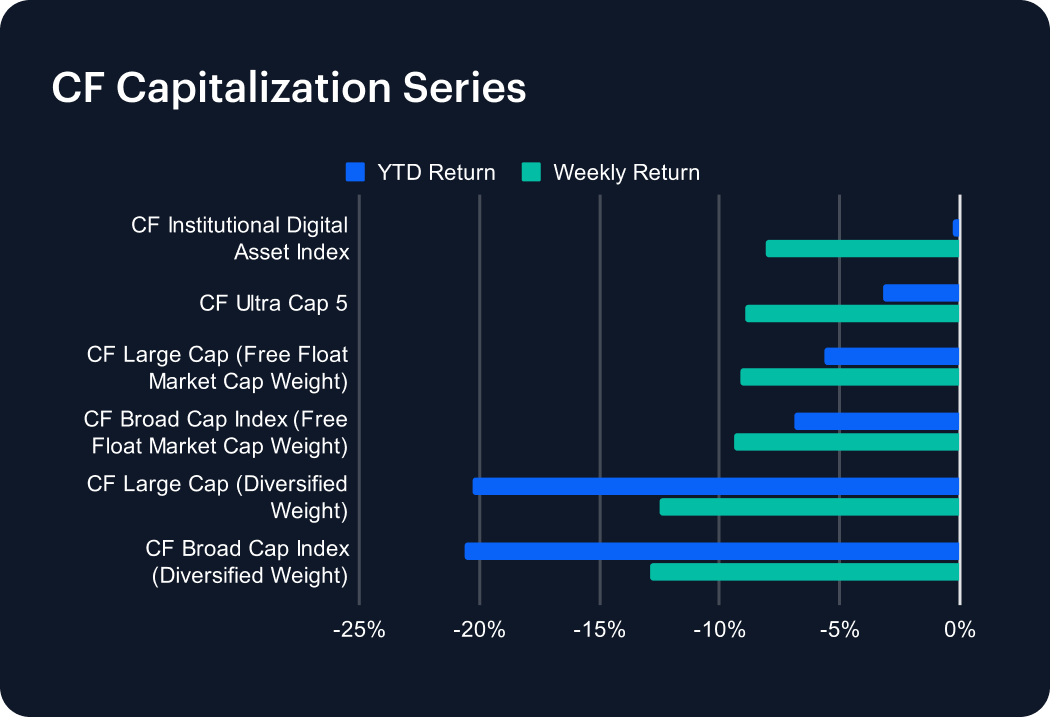
The CF Capitalization Series sold off across the board last week, led by diversified-weight benchmarks. The CF Broad Cap Index (Diversified Weight) plunged 12.86%, driving its YTD loss to –20.61%, while the CF Large Cap (Diversified Weight) fell 12.50%, widening its YTD decline to –20.30%. Free-float market-cap indices also underperformed, with the CF Broad Cap Index down 9.37% (YTD –6.87%) and the Free-Float CF Large Cap dropping 9.14% (YTD –5.61%). The CF Ultra Cap 5 dipped 8.91%, trimming its YTD to –3.20%. Among all, the CF Institutional Digital Asset Index proved most resilient, sliding 8.08% and bringing its YTD return to –0.30%. The steep sell-off underscores ongoing pressure on diversified and mid-to-small-cap exposures despite pockets of large-cap strength.
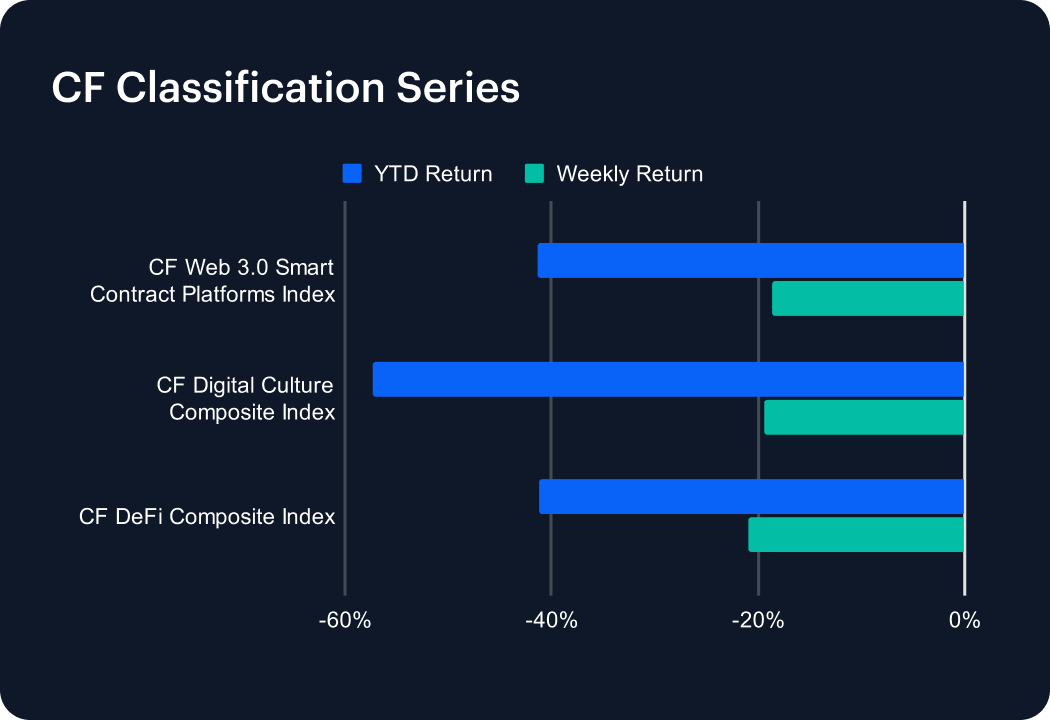
Classification Series Analysis
The CF Classification Series Indices were also caught in last week’s sell-off, with no thematic index spared. The CF Digital Culture Composite Index led the downturn, plunging 19.35% and widening its year-to-date slide to 57.28%. The CF DeFi Composite Index followed, tumbling 20.97% and deepening its YTD loss to 41.20%. Meanwhile, the CF Web 3.0 Smart Contract Platforms Index fell 18.63%, extending its YTD decline to 41.43%. This steep pullback underscores acute risk aversion across high-beta themes, as assets driven by speculation struggle under mounting geopolitical headwinds and lingering market volatility. Investors are increasingly cautious on speculative sectors, recalibrating valuations in light of relentless downside pressure.
Volatility
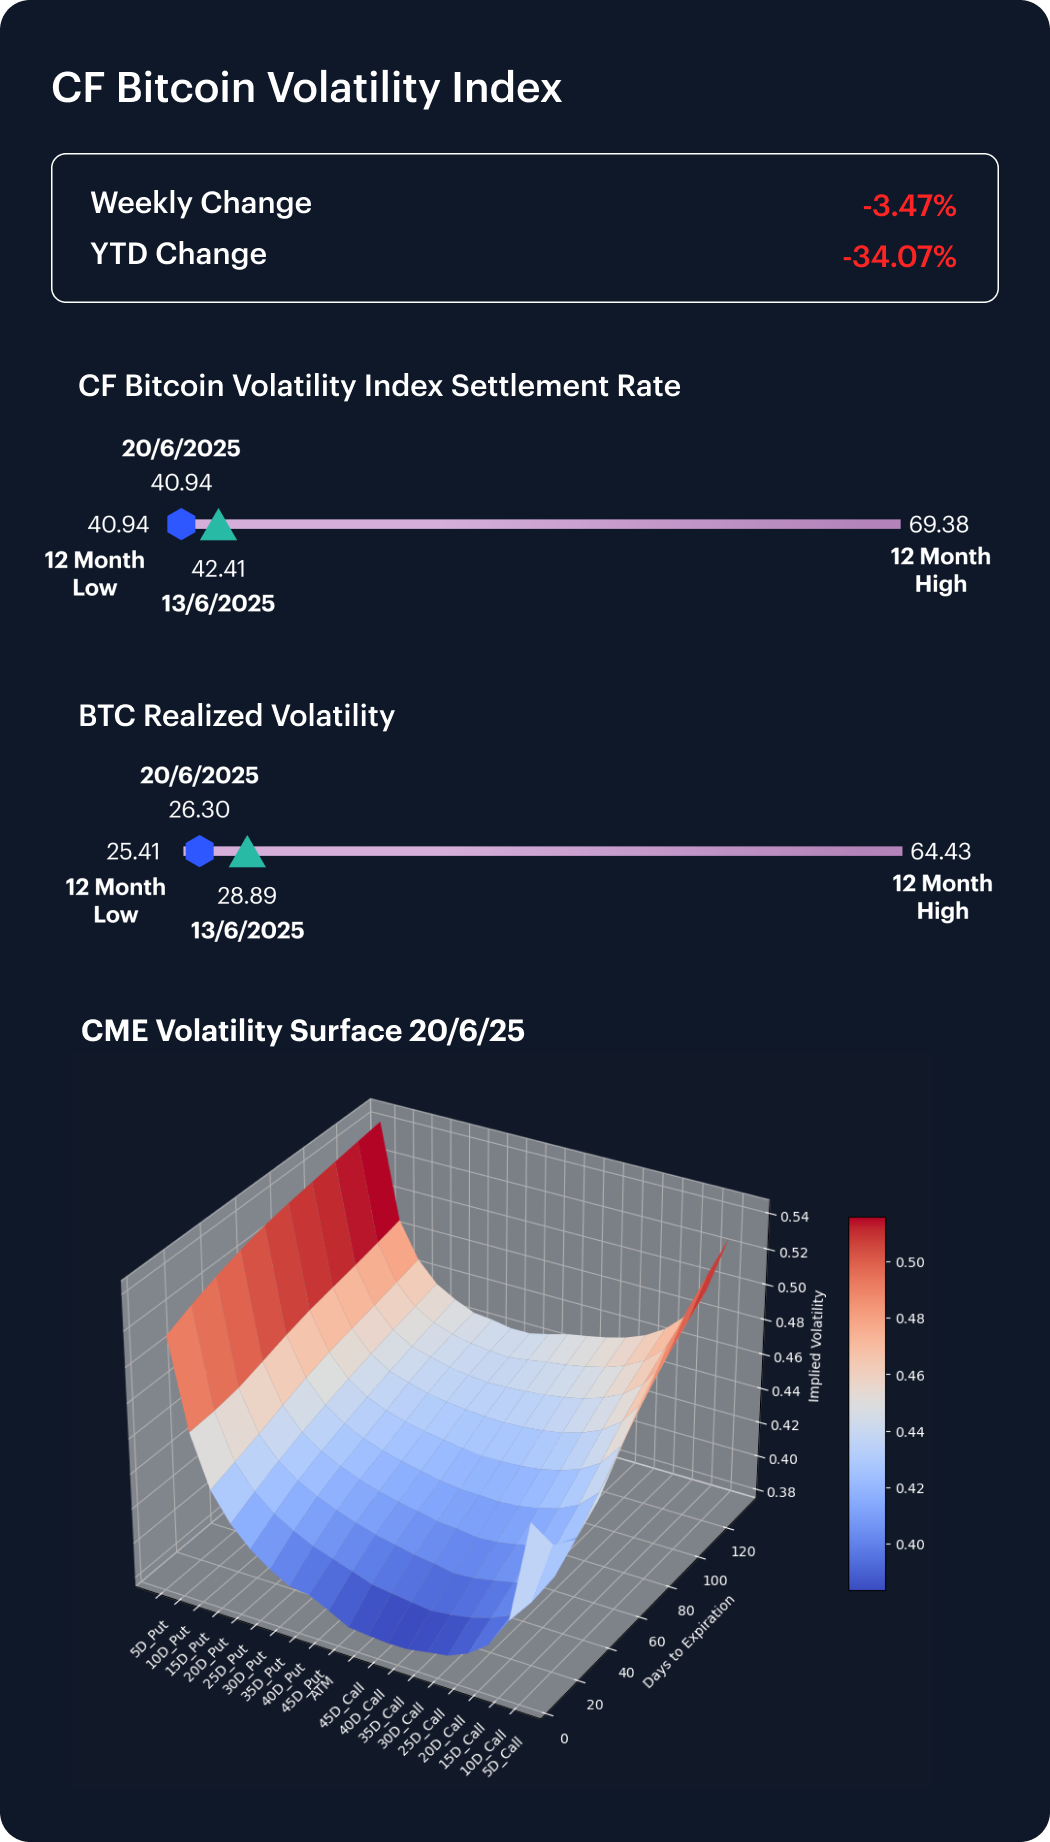
The CF Bitcoin Volatility Index Settlement Rate (BVXS) slid steadily to 40.94 last week, marking a 3.47% decline and a new 12-month low. Implied volatility now sits 34.07% below its January 1 level, reflecting its persistent compression in 2025. Over the same week, realized volatility fell from 28.89 to 26.30 ,a decline of 8.95%.
Options skew across 10-, 15-, 20-, and 25-delta strikes remain negative, signaling a continued demand for downside protection, while convexity in the volatility surface steepened, reflecting higher tail-risk premia. Though overall volatility remains subdued relative to historical highs, the turn toward defensive positioning highlights continued investor caution.
Interest Rate Analysis
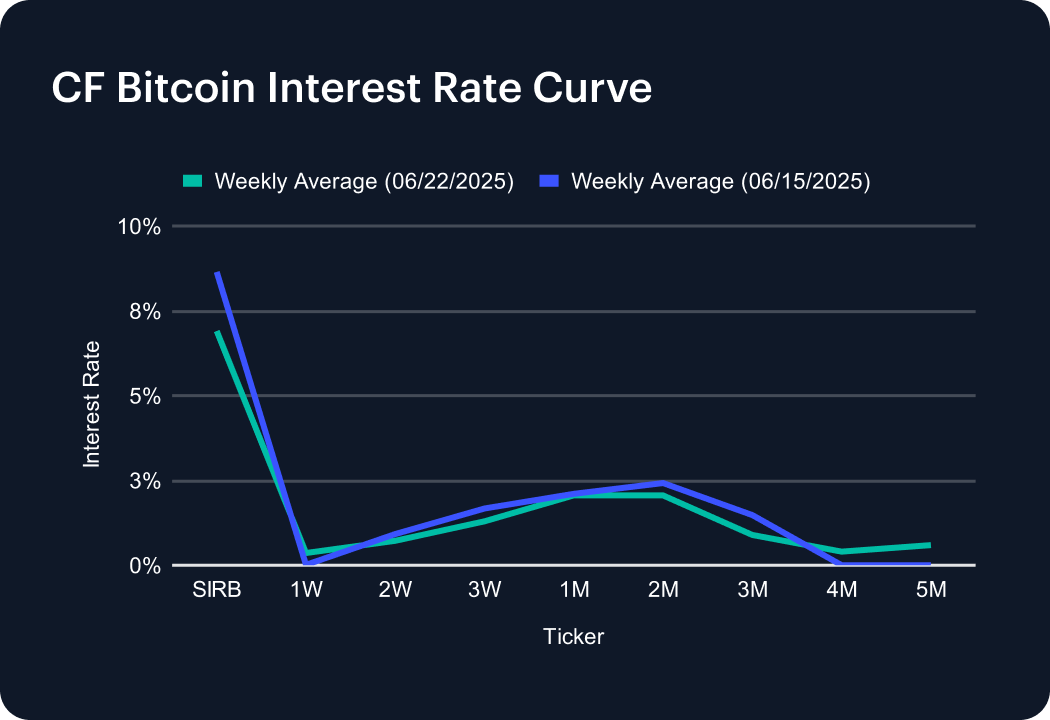
The CF Bitcoin Interest Rate Curve shifted notably last week, as the Short-Term Interest Rate Benchmark (SIRB) eased to 6.90% from 8.65%, signaling a pullback in short-term funding costs. Across the curve, the 1-week rate rebounded to 0.36% (from 0.01%), while the 2-week tenor slipped to 0.72% (down from 0.92%). Medium-term rates also moderated: the 3-week rate fell to 1.29% (vs. 1.67%) and the 1-month average dipped slightly to 2.06% (from 2.10%). The 2-month rate eased to 2.06% (from 2.42%), and 3-month rates contracted to 0.89% (from 1.48%). Notably, longer tenors broke higher, with 4- and 5-month rates climbing to 0.40% and 0.59%, respectively, reflecting tactical repositioning.
The information contained within is for educational and informational purposes ONLY. It is not intended nor should it be considered an invitation or inducement to buy or sell any of the underlying instruments cited including but not limited to cryptoassets, financial instruments or any instruments that reference any index provided by CF Benchmarks Ltd. This communication is not intended to persuade or incite you to buy or sell security or securities noted within. Any commentary provided is the opinion of the author and should not be considered a personalised recommendation. Please contact your financial adviser or professional before making an investment decision.
Note: Some of the underlying instruments cited within this material may be restricted to certain customer categories in certain jurisdictions.
Changes to the Token Market Price Benchmarks Series - Market Prices – 21 July 2026
The Administrator has confirmed changes to the Token Market Price Family for the period 14 July 2026 to 21 July 2026.

CF Benchmarks
Softer CPI Reprices July Hike Risk & Lifts Digital Assets
Digital assets extended their recovery over the past week as cooler US inflation prints repriced Fed expectations; the bid was broad across the large cap indices, growth factor leadership returned, stablecoin funding repriced lower, and stress stayed isolated in names hit by token-specific news.
Mark Pilipczuk
Notice of the Demising of CF Dai-Dollar Settlement Price and Spot Rate
The Administrator announces that it will demise the CF Dai-Dollar Settlement Price (DAIUSD_RR) and CF Dai-Dollar Spot Rate (DAIUSD_RTI) which are members of the CF Digital Asset Index Family.
CF Benchmarks
By clicking Accept, you consent to CF Benchmarks's use of cookies.
Visit Cookie Settings to learn how CF Benchmarks uses cookies and to adjust your preferences.