
Jun 02, 2025
Weekly Index Highlights, June 2, 2025
Market Performance Update
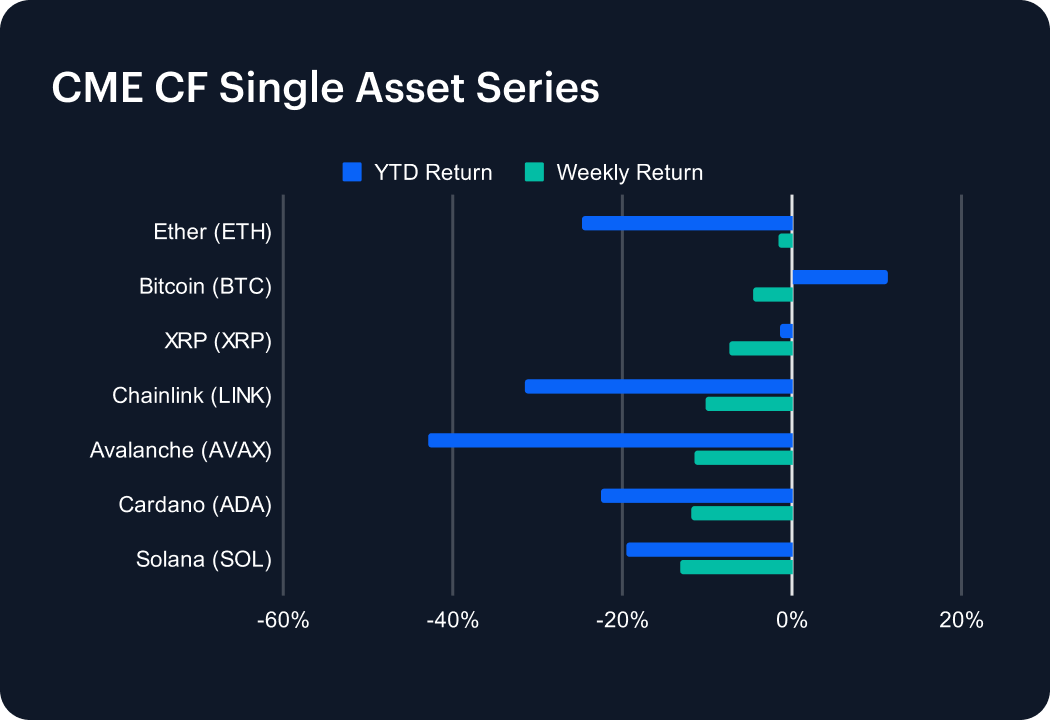
The digital asset market pulled back last week, with major tokens posting broad-based declines. Solana (SOL) led the pullback, falling 13.26% and deepening its year-to-date (YTD) loss to -19.53%. Cardano (ADA) and Avalanche (AVAX) also suffered steep drops of 11.83% and 11.43%, respectively, continuing their double-digit YTD declines. Bitcoin (BTC) slid 4.55%, paring its YTD gain to 11.38%, still the best among large-cap assets. Ether (ETH) declined 1.58%, leaving it down 24.76% for the year. Meanwhile, XRP (XRP) shed 7.33%, slipping into negative territory YTD at -1.49%. Chainlink (LINK) was the worst performer, plunging 10.14% for a YTD return of -31.41%. The retracement signals investor caution following Bitcoin’s move to new all-time highs.

Sector Analysis
Digital asset sub-categories broadly declined last week, with weakness spanning most segments. In Trading, UNI limited losses to 4.26%, outperforming deeper drawdowns in BAL (-11.86%) and CRV (-13.41%). Borrowing & Lending saw pressure from ONDO (-11.98%) and SPELL (-10.55%), while COMP held up relatively well at -3.72%. Among Smart Contract Platforms, Avalanche (AVAX), Cardano (ADA), and Fantom (FTM) each fell more than 11%, with EOS leading losses at -18.29%. Specialized platforms also struggled, as Injective (INJ) and SEI dropped over 12%. In Culture & Gaming, LPT surged 66.23% to top all tokens, while SUPER and DOGE sank 18.74% and 14.73%, respectively. QNT was a standout in Interoperability, gaining 17.10%. Overall, performance was broadly negative, with isolated strength in select segments.
Staking Metrics
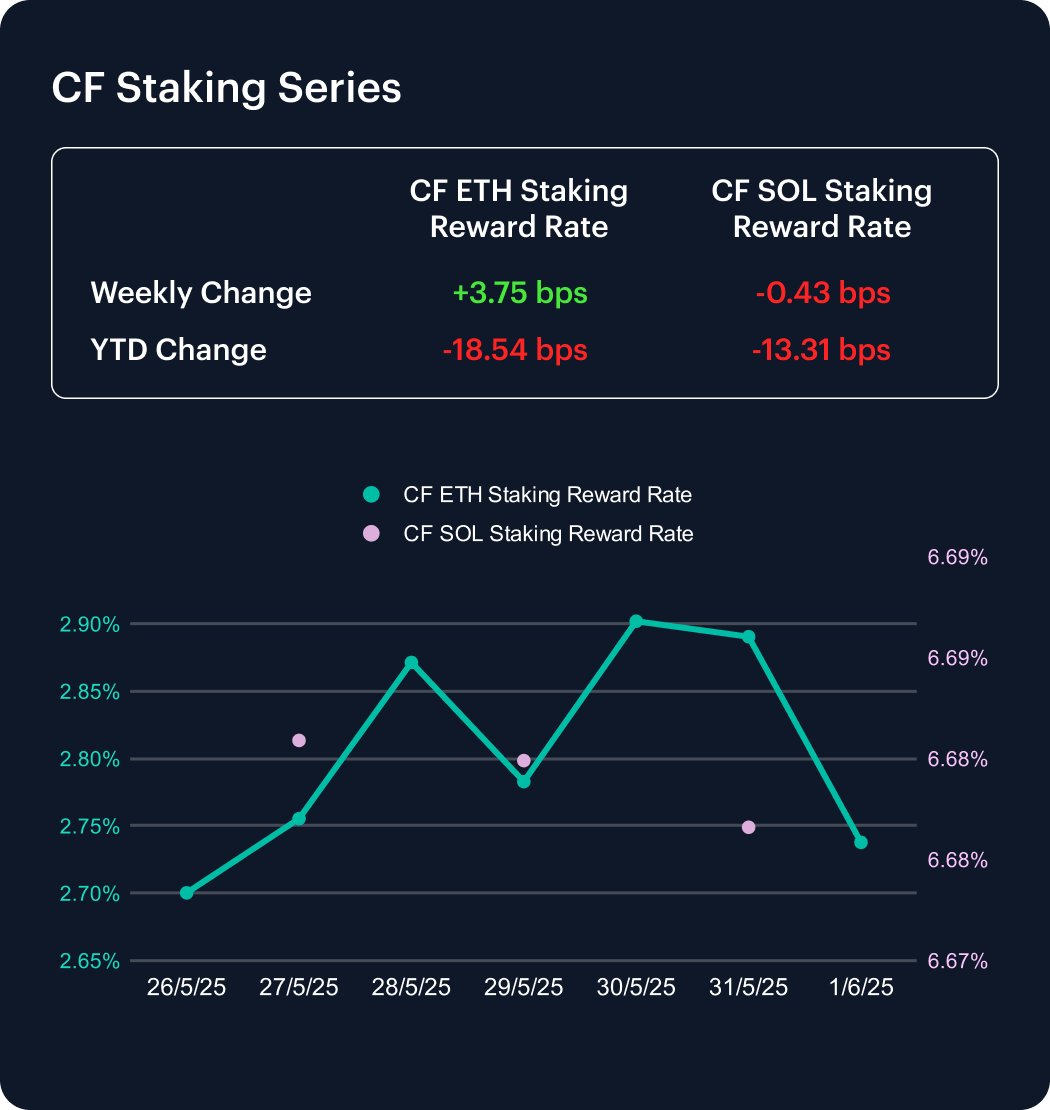
The CF Ether Staking Reward Rate Index (ETH_SRR) edged up 3.75 basis points last week to 2.74%, a 1.39% gain. Despite the weekly rise, the index remains down 18.54 bps year-to-date from 2.92%, marking a 6.34% decline and signaling continued long-term yield compression.
Meanwhile, the CF SOL Staking Reward Rate Index (SOL_SRR) dipped slightly by 0.43 bps to 6.68%, essentially flat on the week with a 0.06% decrease. Solana’s YTD decline now stands at 13.31 bps, or 1.95%. As Ethereum’s staking yields remain under pressure, the gap in reward rates between major proof-of-stake networks persists.
Market Cap Index Performance
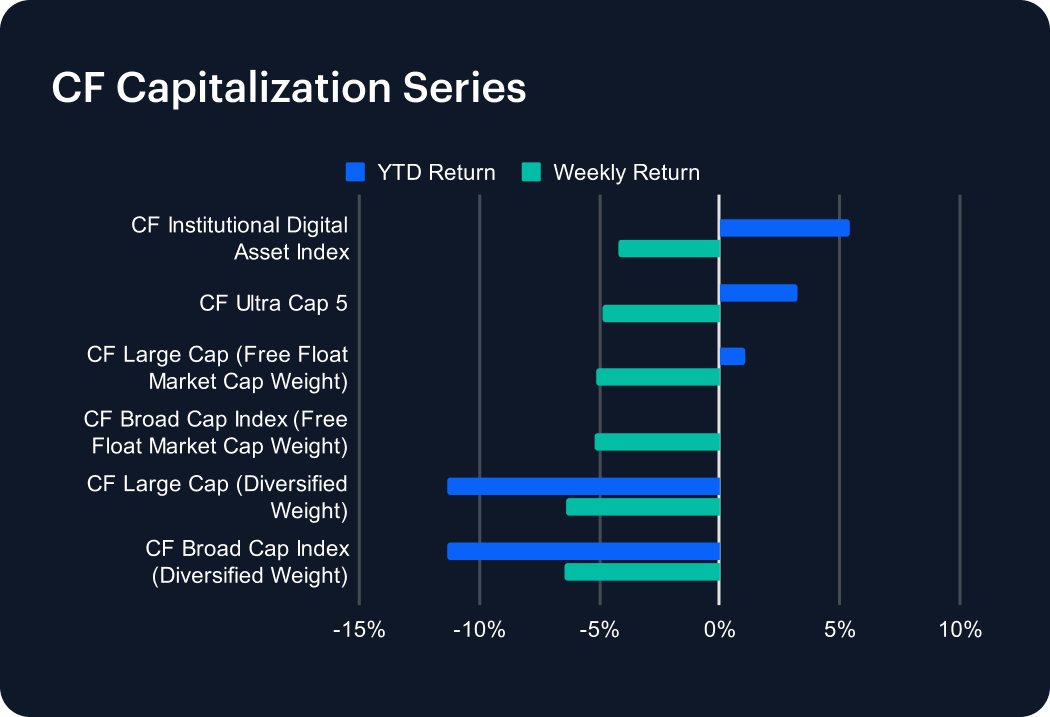
The CF Capitalization Series retraced sharply last week, with losses across both free-float and diversified-weighted indices. The CF Institutional Digital Asset Index was the most resilient, falling 4.20% and trimming its year-to-date (YTD) return to 5.38%. The CF Ultra Cap 5 dropped 4.88%, reducing its YTD gain to 3.21%. Free-float market cap-weighted benchmarks also struggled—CF Large Cap and CF Broad Cap Index fell 5.12% and 5.21%, respectively, with the latter now slightly negative YTD at -0.01%. Diversified-weighted indices extended their underperformance, as the CF Broad Cap and CF Large Cap slid 6.45% and 6.40%, pushing YTD returns deeper into negative territory at -11.34% and -11.37%. The retreat reflects broad risk aversion and weaker small-cap momentum.
Classification Series Analysis
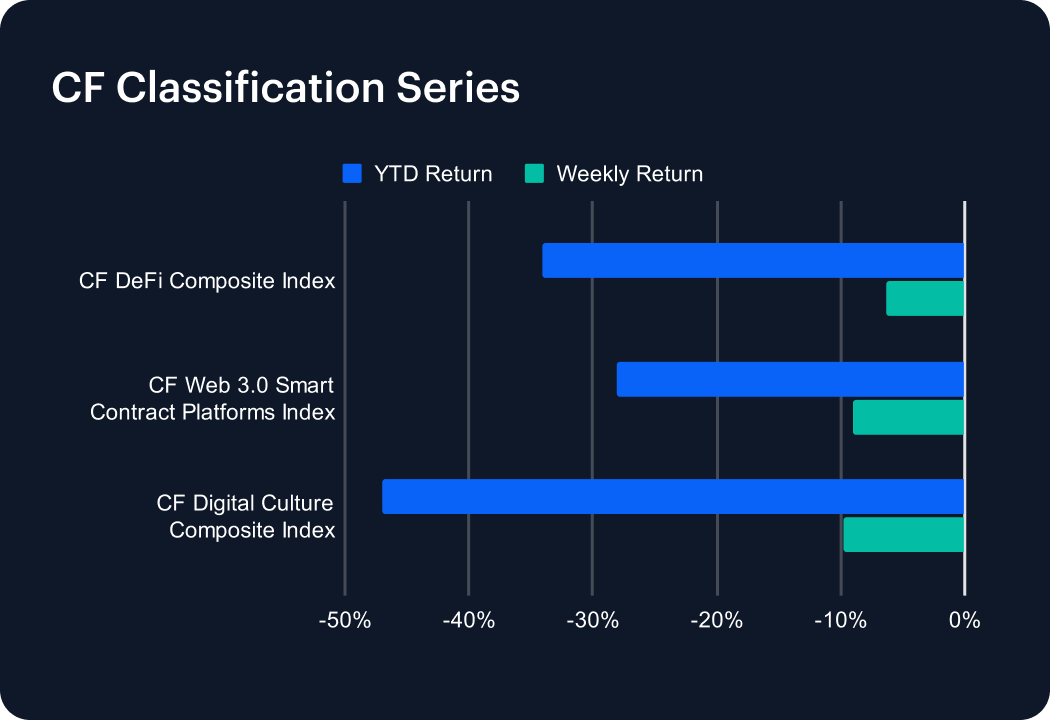
The CF Classification Series Indices underperformed other indicies last week, with all three major thematic benchmarks posting losses. The CF DeFi Composite Index fell 6.39%, widening its year-to-date (YTD) decline to -34.13%. The CF Web 3.0 Smart Contract Platforms Index dropped 9.07%, extending its YTD loss to -28.06%. The CF Digital Culture Composite Index remained the weakest performer, tumbling 9.73% to deepen its YTD drawdown to -47.04%. The across-the-board retreat highlights ongoing weakness in high-beta segments, as investor appetite for risk continues to wane. While previous weeks showed tentative recovery in DeFi and Web3, this renewed selloff underscores persistent uncertainty across thematic sectors. Overall, sentiment remains fragile amid shifting market conditions and lackluster momentum in speculative digital assets.
Volatility
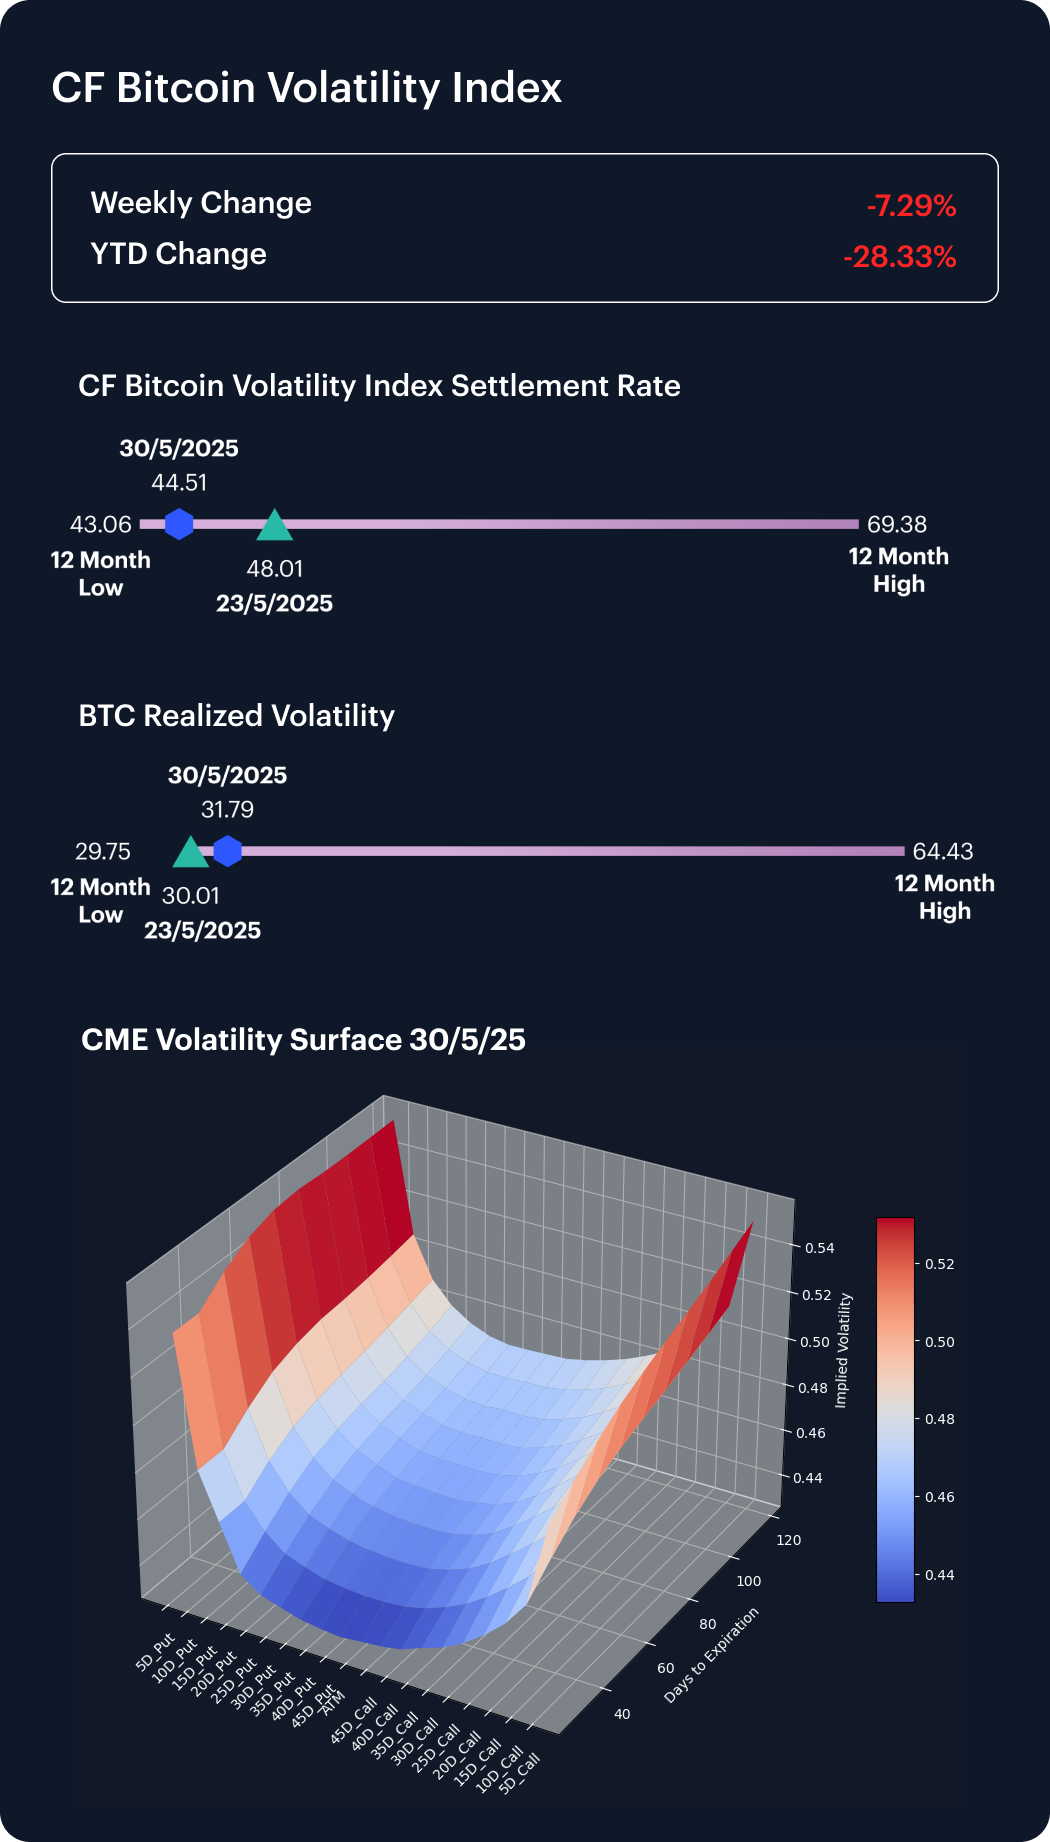
The CF Bitcoin Volatility Index Settlement Rate (BVXS) declined 3.50 points last week to 44.51, a 7.29% drop that deepens its year-to-date decline to 28.33%. Implied volatility continued to soften, signaling reduced demand for directional or hedging exposure amid a quieter macro backdrop. Realized volatility edged higher to 31.79 from 30.12, modestly narrowing the vol gap.
Notably, CME Bitcoin options markets showed a shift in positioning: 120-day 5-delta puts now command higher implied volatility than their call counterparts, signaling heightened downside hedging demand. This inversion highlights a tilt toward protection rather than speculative upside. Elevated convexity in both tails suggests traders are bracing for larger, less probable moves, even as baseline volatility trends lower.
Interest Rate Analysis
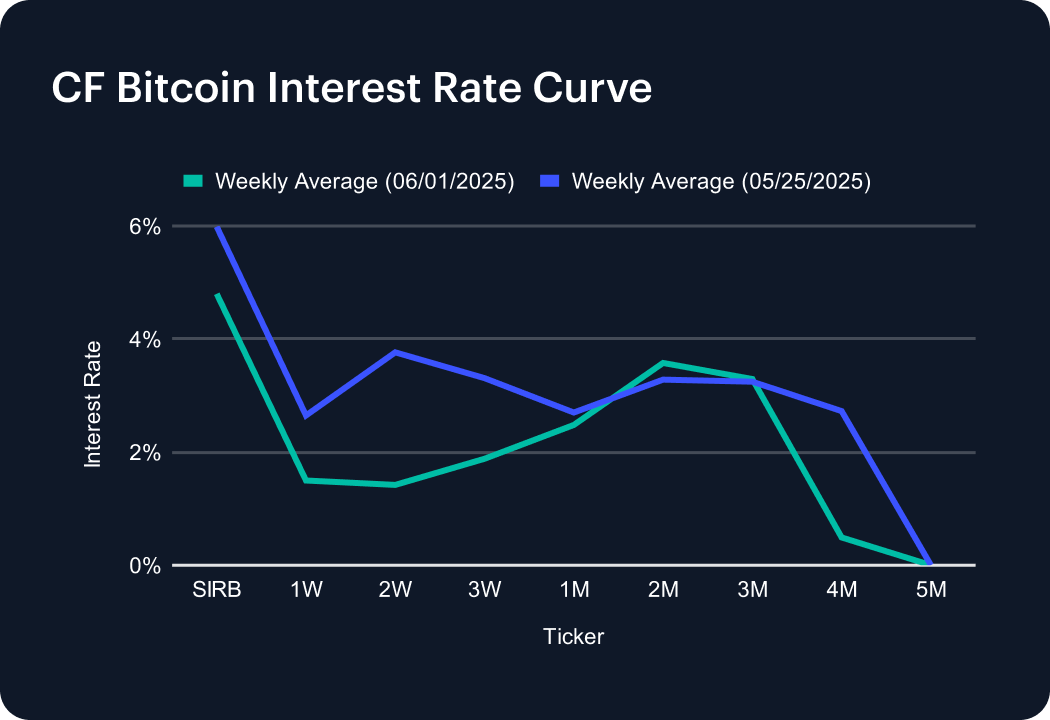
The CF Bitcoin Interest Rate Curve declined across most tenors last week, unwinding the prior spike in funding costs. The Short-Term Interest Rate Benchmark (SIRB) dropped sharply to 4.80% from 5.99%, signaling reduced demand for near-term borrowing. Short-duration tenors saw notable pullbacks, with the 1-week and 2-week rates falling to 1.50% and 1.42%, respectively. The 1-month average eased to 2.48%, while 3-month and 4-month rates also declined. Only the 2-month tenor ticked higher, reaching 3.58%. The curve flattened considerably, suggesting a moderation in speculative demand and a retreat from leveraged positioning following last week’s broader market softness.
The information contained within is for educational and informational purposes ONLY. It is not intended nor should it be considered an invitation or inducement to buy or sell any of the underlying instruments cited including but not limited to cryptoassets, financial instruments or any instruments that reference any index provided by CF Benchmarks Ltd. This communication is not intended to persuade or incite you to buy or sell security or securities noted within. Any commentary provided is the opinion of the author and should not be considered a personalised recommendation. Please contact your financial adviser or professional before making an investment decision.
Note: Some of the underlying instruments cited within this material may be restricted to certain customer categories in certain jurisdictions.
Factor Friday - July 10, 2026
The relief rally extended for a second week with Market +2.27%, but the real story is risk appetite: Liquidity led styles at +1.51% as thinner, less liquid names caught a bid. Value paused at -0.79% yet still leads over four weeks. Defensive tilts kept unwinding into the bounce.

Mark Pilipczuk
2026 Mid-Year Market Outlook
Iran risk, regulatory policy, Bitcoin rebalancing, tokenization, and protocol revenue are reshaping the outlook. Growth is narrowing, but regulatory progress and productive on-chain activity create offsets. Dispersion, not broad beta, should define the next year.
Gabriel Selby
Changes to the Token Market Price Benchmarks Series - Market Prices – 07 July 2026
The Administrator has confirmed changes to the Token Market Price Family for the period 30 June 2026 to 07 July 2026.
CF Benchmarks
By clicking Accept, you consent to CF Benchmarks's use of cookies.
Visit Cookie Settings to learn how CF Benchmarks uses cookies and to adjust your preferences.