
Jun 16, 2025
Weekly Index Highlights, June 16, 2025
Market Performance Update
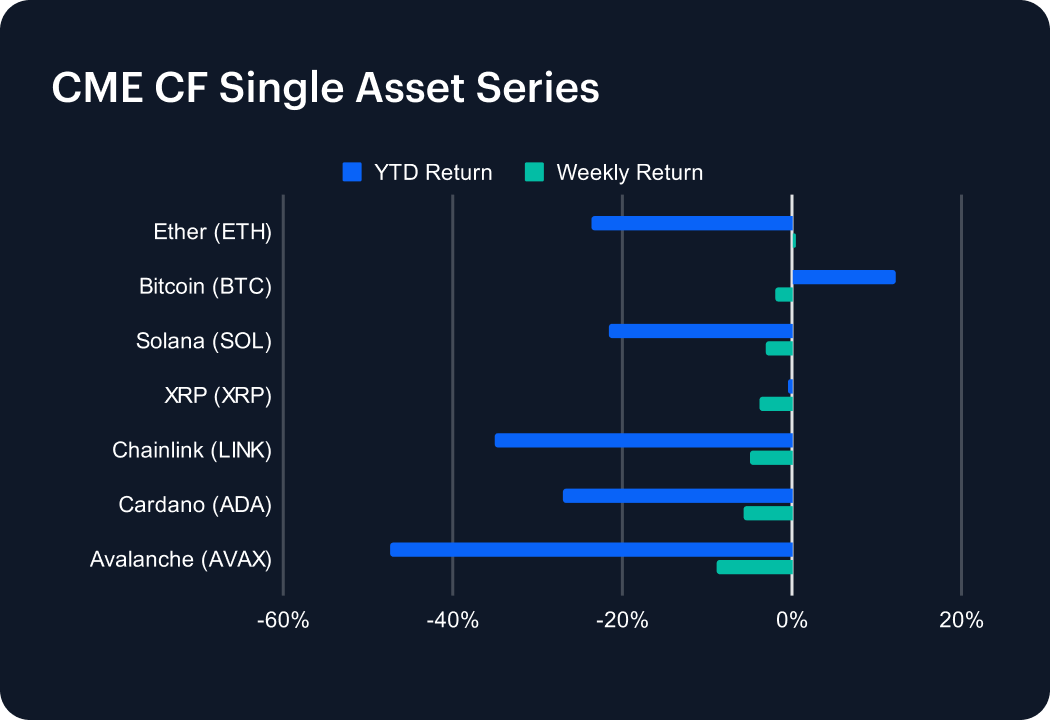
The digital asset market experienced a broad pullback last week, with most major tokens posting declines. Avalanche (AVAX) was the biggest loser among large-cap assets, sliding 8.95% to deepen its year-to-date (YTD) loss to -47.31%. Cardano (ADA) and Chainlink (LINK) followed closely, down 5.74% and 5.02%, bringing their YTD returns to -27.05% and -34.99%, respectively. XRP (XRP) fell 3.76%, erasing prior gains and turning negative on the year at -0.53%. Solana (SOL) also declined, dropping 3.08% for a YTD return of -21.57%. Bitcoin (BTC) retreated 1.95%, but remains the top performer in 2025 with a 12.31% gain. Ether (ETH) was the lone gainer, up 0.51% last week, modestly reducing its YTD decline to -23.72%. Despite positive regulatory developments, geopolitical tensions dampened investor sentiment.
Sector Analysis
Digital assets experienced a broad decline across the DACS segments, with a few standout performers. In Borrowing & Lending, COMP (+15.86%) and AAVE (+6.12%) led gains, while SPELL (-7.98%) and ONDO (-6.71%) weighed on the group. Trading assets underperformed overall, with BAL flatlining at 0.00% and CRV (-11.49%) leading losses. Within the Programmable sub-category, FTM (-12.81%), HBAR (-9.75%), and INJ (-13.50%) dragged down returns. The Gaming segment was especially weak, PRIME (-10.68%), SUPER (-9.90%), and GALA (-8.34%) all saw heavy losses. Meanwhile, MKR in Stablecoin Issuance surged 17.57%, and BCH led within the Non-Programable sub-category with an 8.76% gain. Sector dispersion widened notably, with strength concentrated in Borrowing & Lending and select Store-of-Value and Payment tokens.
Staking Metrics
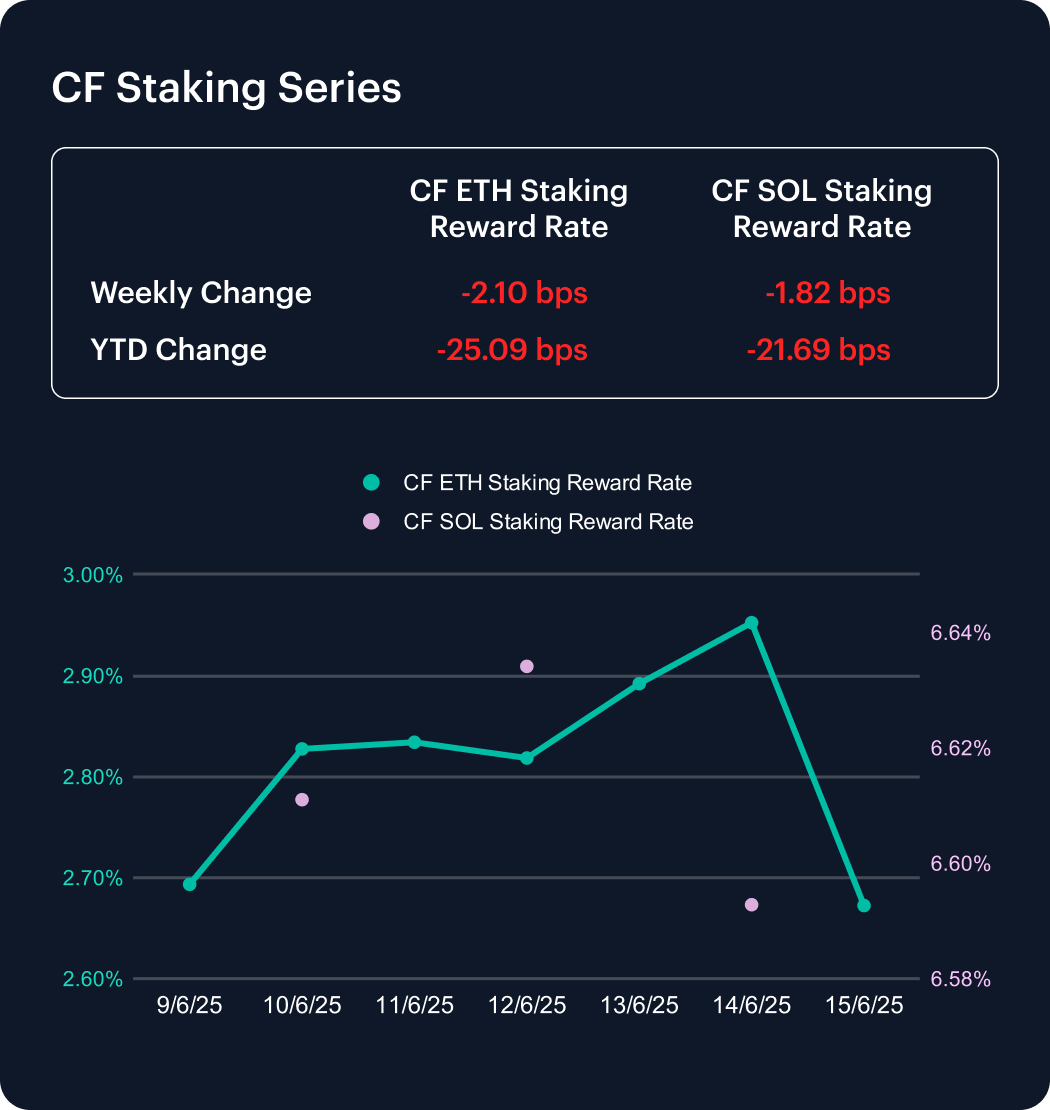
The CF Ether Staking Reward Rate Index (ETH_SRR) declined 2.1 basis points last week to 2.67%, marking a 0.78% weekly drop. Year-to-date, the index has fallen 25.09 bps from 2.92%, reflecting an 8.58% decrease, highlighting persistent downward pressure on Ethereum staking yields.
Meanwhile, the CF SOL Staking Reward Rate Index (SOL_SRR) dipped 1.82 bps to 6.59%, a weekly decline of 0.28%. Solana’s YTD decrease now stands at 21.69 bps, or 3.19%. The sustained compression in Ethereum yields, relative to more modest declines in Solana’s, continues to reflect diverging incentive structures among leading proof-of-stake ecosystems.
Market Cap Index Performance
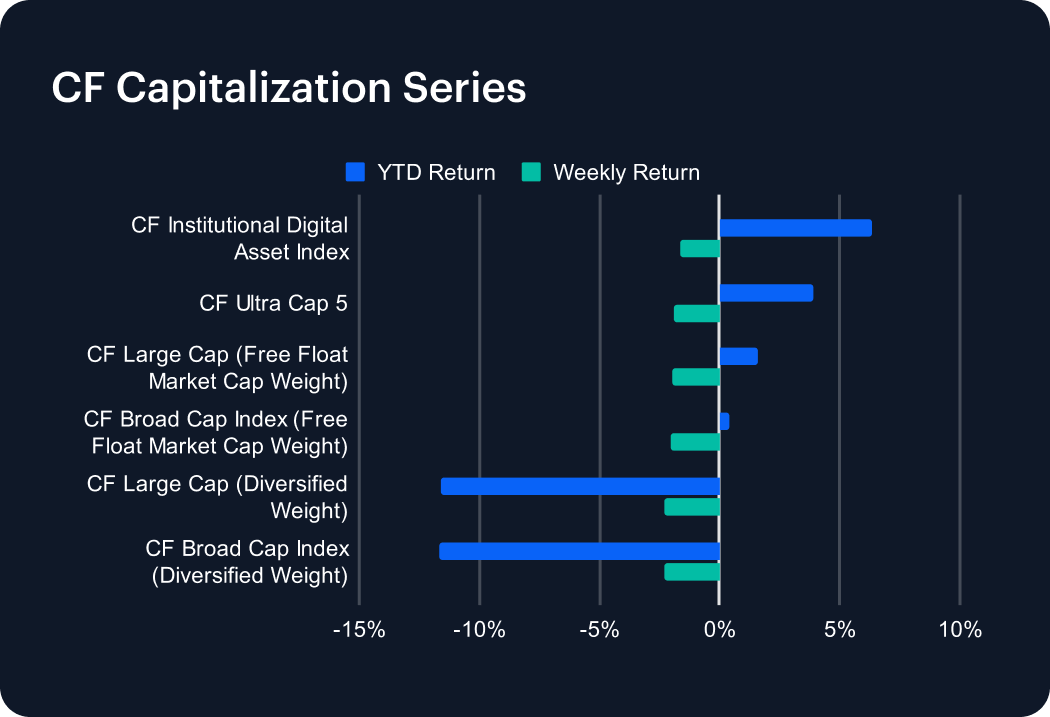
The CF Capitalization Series declined across the board last week, reversing prior gains as all major indices posted losses. The CF Institutional Digital Asset Index fell 1.67%, trimming its year-to-date (YTD) return to 6.33%. The CF Ultra Cap 5 dropped 1.89%, paring its YTD gain to 3.92%, while the CF Large Cap Free Float and CF Broad Cap Free Float indices lost 1.99% and 2.02%, respectively, bringing their YTD returns to 1.56% and 0.42%. Diversified-weighted benchmarks underperformed once again, with CF Large Cap and CF Broad Cap falling 2.29% and 2.33%, pushing YTD losses to -11.63% and -11.66%. The pullback highlights ongoing pressure from small-cap exposure, which continues to weigh on diversified indices despite broader market resilience.
Classification Series Analysis
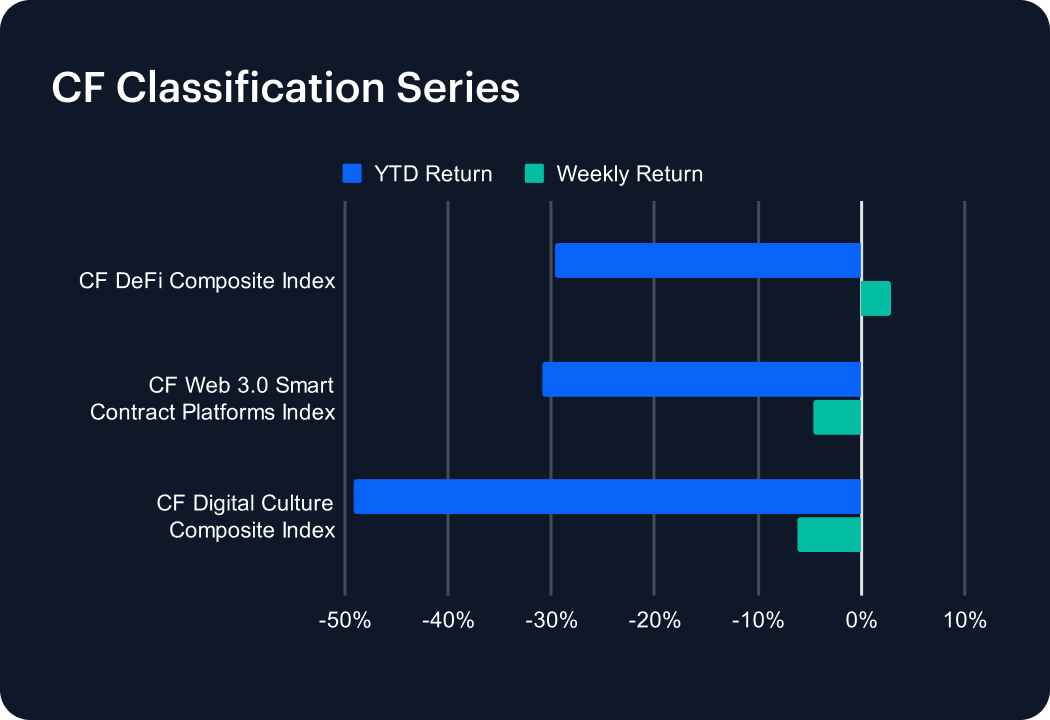
The CF Classification Series Indices broadly underperformed last week, deepening losses across high-beta thematic segments. The CF Digital Culture Composite Index led the declines, dropping 6.16% and pushing its year-to-date (YTD) loss to a steep -49.21%. The CF Web 3.0 Smart Contract Platforms Index followed with a 4.65% decline, extending its YTD drop to -30.89%. In contrast, the CF DeFi Composite Index offered a bright spot, rising 2.82% on the week, though it remains down 29.74% YTD. Despite isolated strength in DeFi, persistent risk aversion and lackluster sentiment continue to pressure speculative segments, underscoring the fragile footing of innovation-driven assets amid broader market volatility.
Volatility
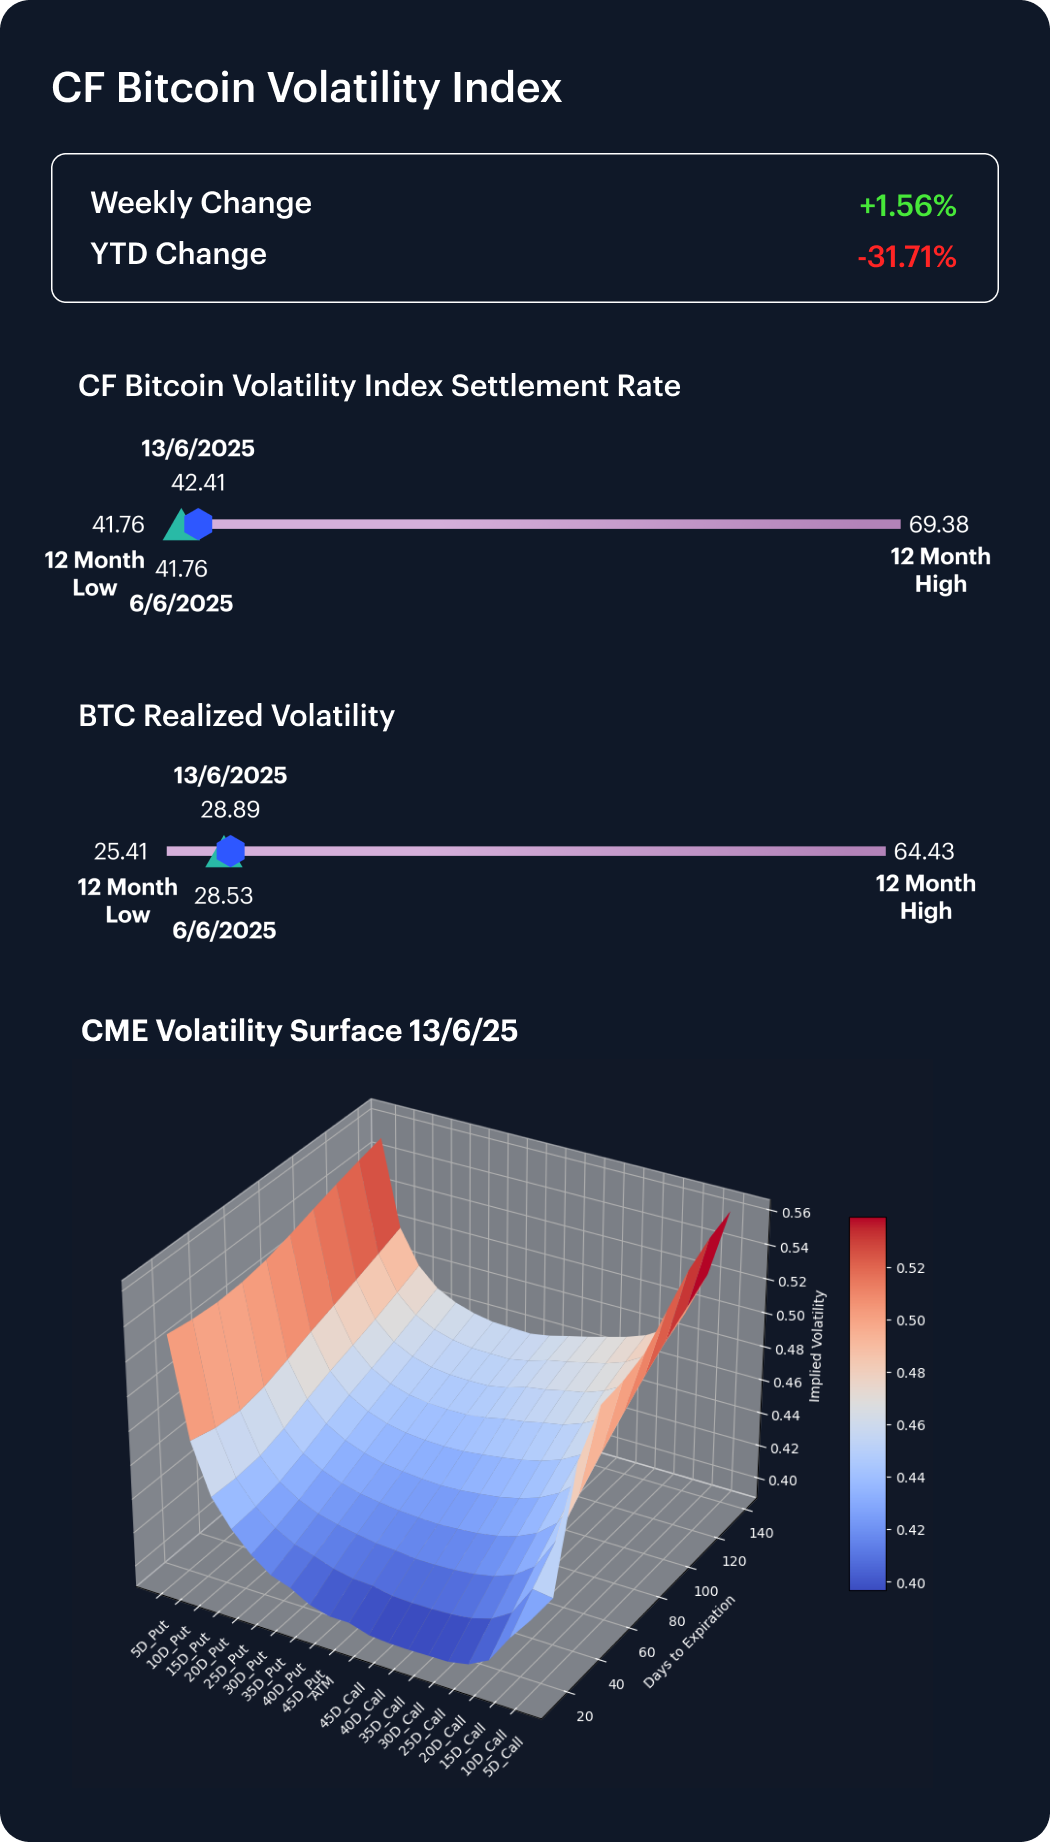
The CF Bitcoin Volatility Index Settlement Rate (BVXS) edged up 0.65 points last week to 42.41, a 1.56% increase that slightly lifts it from its 12-month low but leaves implied volatility down 31.71% year-to-date. Realized volatility also rose modestly, climbing from 28.53 to 28.89.
Sentiment in the options market turned more defensive. Skew across the 10-, 15-, 20-, and 25-delta levels flipped negative, signaling a shift in preference toward downside protection. At the same time, convexity in the volatility surface steepened, indicating increased pricing for tail events. Despite a still-muted volatility regime, the structural tone has turned more cautious, reflecting heightened hedging demand amid lingering macro uncertainty.
Interest Rate Analysis
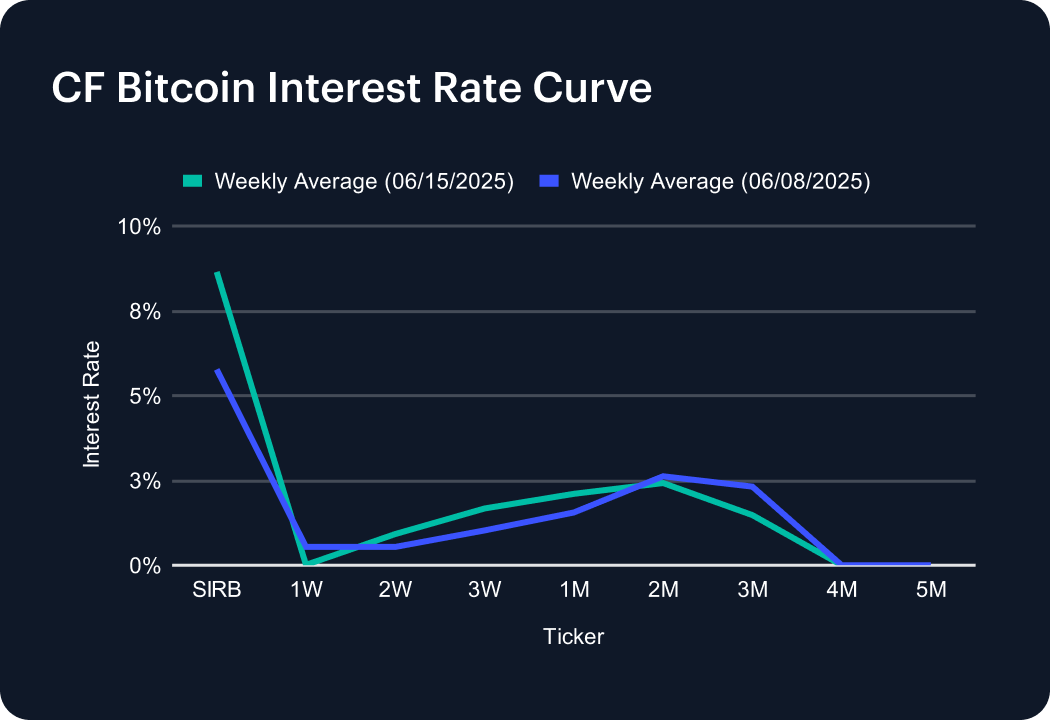
The CF Bitcoin Interest Rate Curve steepened sharply last week, with the Short-Term Interest Rate Benchmark (SIRB) surging to 8.65% from 5.77%, signaling a spike in short-term borrowing costs. However, shifts across the curve were mixed. The 1-week rate plunged to 0.01%, while the 2-week tenor rebounded slightly to 0.92%. Medium-dated rates rose, with the 3-week and 1-month averages increasing to 1.67% and 2.10%, respectively. The 2-month tenor dipped to 2.42%, while 3-month rates fell more steeply to 1.48%. The 4- and 5-month rates remained at 0.00%. These movements reflect tactical repositioning amid elevated market volatility.
The information contained within is for educational and informational purposes ONLY. It is not intended nor should it be considered an invitation or inducement to buy or sell any of the underlying instruments cited including but not limited to cryptoassets, financial instruments or any instruments that reference any index provided by CF Benchmarks Ltd. This communication is not intended to persuade or incite you to buy or sell security or securities noted within. Any commentary provided is the opinion of the author and should not be considered a personalised recommendation. Please contact your financial adviser or professional before making an investment decision.
Note: Some of the underlying instruments cited within this material may be restricted to certain customer categories in certain jurisdictions.
Changes to the Token Market Price Benchmarks Series - Market Prices – 21 July 2026
The Administrator has confirmed changes to the Token Market Price Family for the period 14 July 2026 to 21 July 2026.

CF Benchmarks
Softer CPI Reprices July Hike Risk & Lifts Digital Assets
Digital assets extended their recovery over the past week as cooler US inflation prints repriced Fed expectations; the bid was broad across the large cap indices, growth factor leadership returned, stablecoin funding repriced lower, and stress stayed isolated in names hit by token-specific news.
Mark Pilipczuk
Notice of the Demising of CF Dai-Dollar Settlement Price and Spot Rate
The Administrator announces that it will demise the CF Dai-Dollar Settlement Price (DAIUSD_RR) and CF Dai-Dollar Spot Rate (DAIUSD_RTI) which are members of the CF Digital Asset Index Family.
CF Benchmarks
By clicking Accept, you consent to CF Benchmarks's use of cookies.
Visit Cookie Settings to learn how CF Benchmarks uses cookies and to adjust your preferences.