
Jan 19, 2026
Weekly Index Highlights, January 19, 2026
Market Performance Update
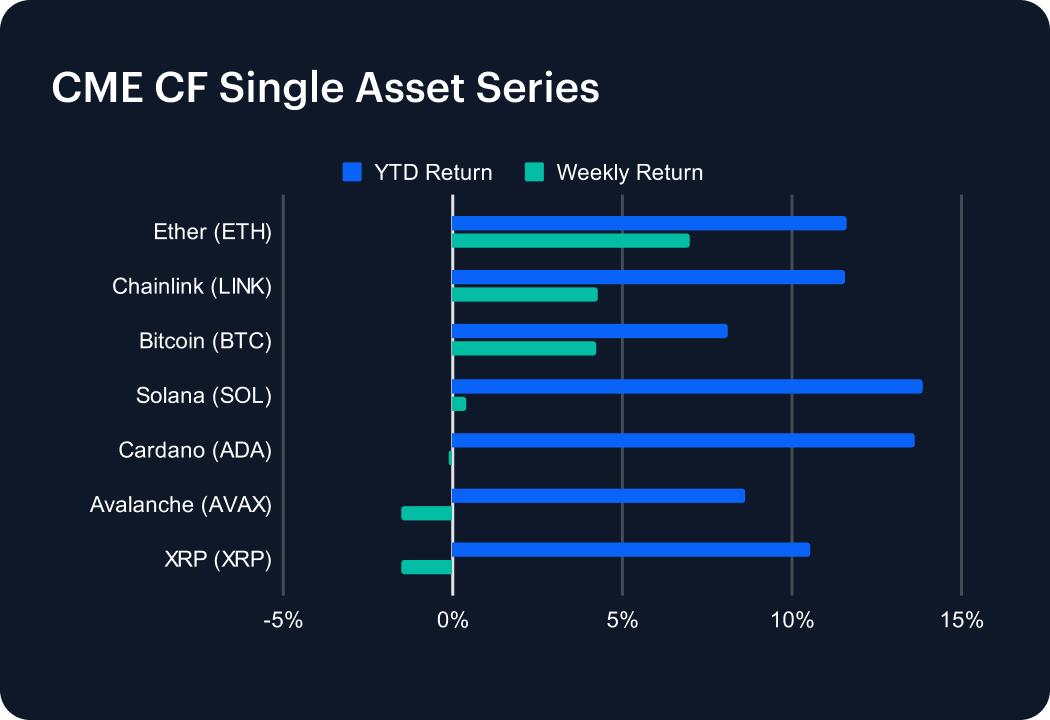
Digital assets posted a promising advance week-on-week (w/w), with Bitcoin gaining 4.2% and Ether striding 7.0% higher. For another somewhat constructive signal, breadth skewed positive across the single-asset set (4 advancers vs. 3 decliners). BTC closed the most recent week up 8.1% for the year to date (YTD), while ETH sat +11.6% YTD, leaving large caps trading in a -1.5% to +7.0% w/w band. Higher-beta names also participated: Chainlink (LINK) returned +4.3% w/w and Solana (SOL) was +0.4%, while laggard XRP (XRP) fell 1.5%. The dispersion between the best and worst performers was 8.5 percentage points, suggesting a constructive but still selective risk bid rather than a uniform squeeze. From an index perspective, the week’s profile can be summed up as a quality-led rebound anchored in BTC/ETH leadership (+4.2%/+7.0%), with negative tails contained to roughly -1.5% at the worst single-asset print.
Volatility Analysis
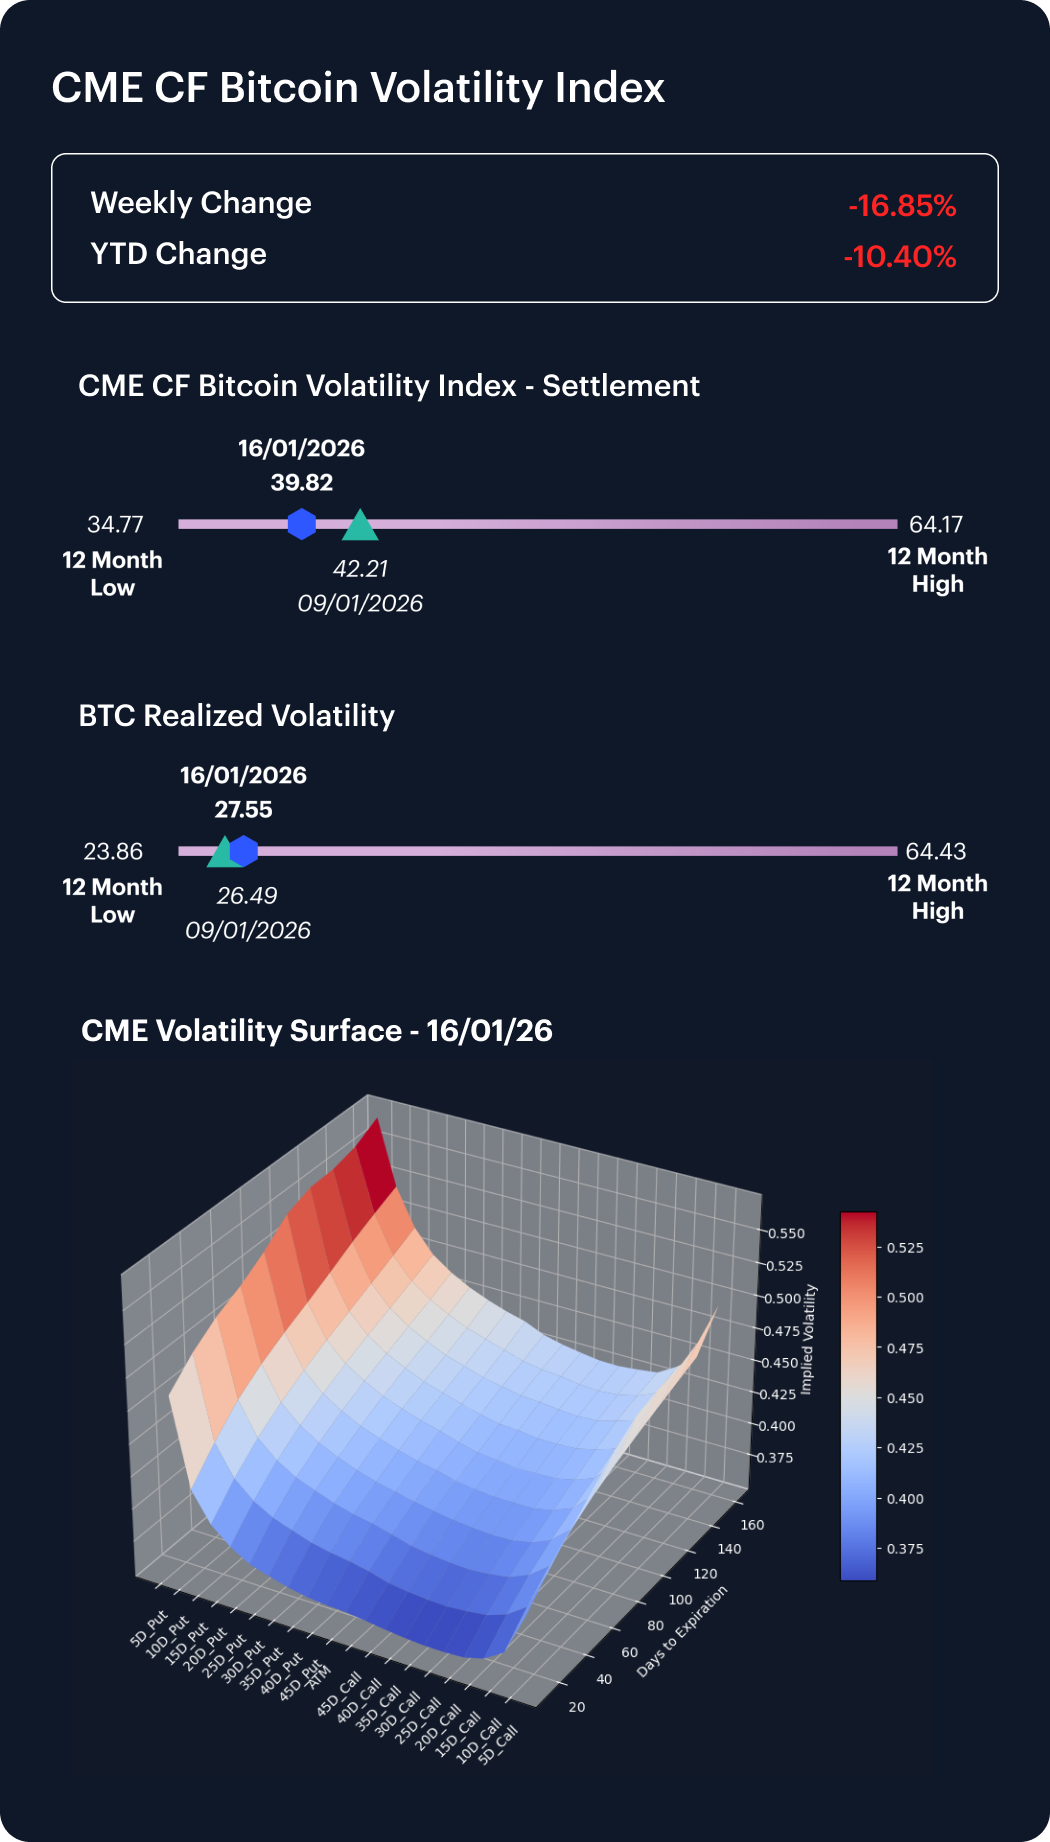
Bitcoin volatility eased on an implied basis, with the CME CF Bitcoin Volatility Index – Settlement (BVXS) moving from its 42.21 close on January 9th, to 39.82 by Friday January 16th (a -2.39 vol.-point shift) while realized volatility rose from 26.49 to 27.55 (+1.06 vol. points). With realized at 27.55 versus implied at 39.82, the implied–realized spread is +12.27 vol. points, leaving implied above realized. This upward spread compression (+12.27 vol. points) alongside a falling of the definitive CME Bitcoin options volatility gauge – BVXS – indicates option markets priced a calmer forward path, even as spot delivered slightly higher realized turbulence. It’s a configuration typically associated with contained hedging demand and opportunistic vol. selling. Generally, such scenarios are constructive near-term auguries for the underlying.
Market Cap Index Performance
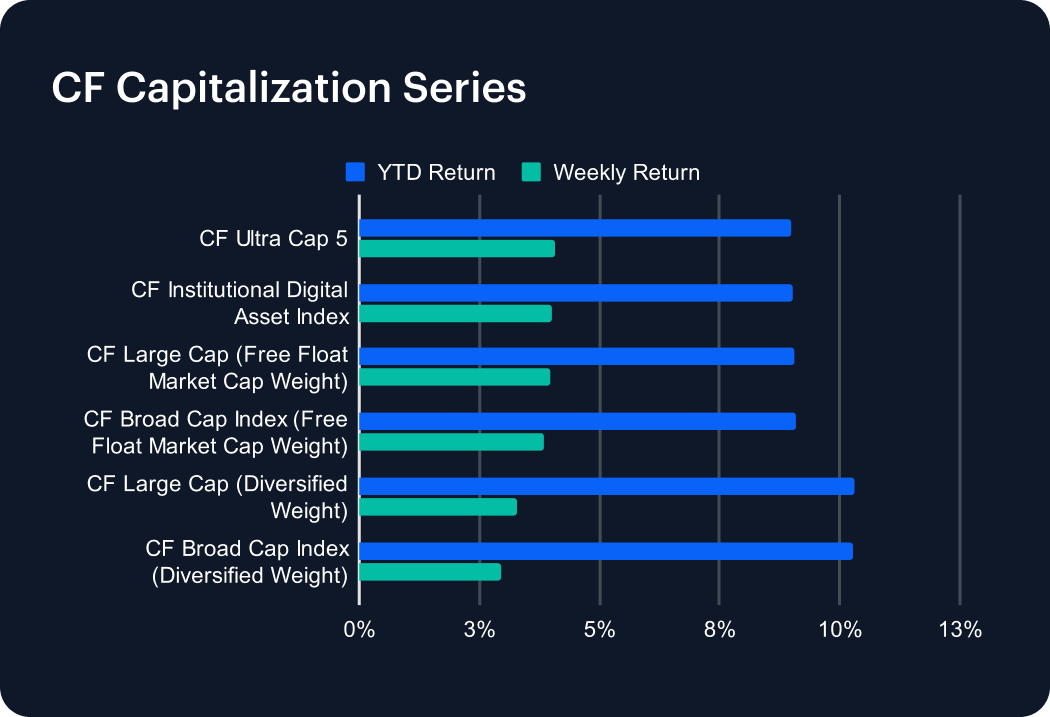
CF Capitalization indices traded in a narrow range over the week, with CF Ultra Cap 5 up 4.1% w/w (YTD +9.0%), CF Large Cap (Free Float Market Cap Weight) up 4.0% (YTD +9.1%) and CF Broad Cap Index (Free Float Market Cap Weight) up 3.9% (YTD +9.1%). Diversified-weight indices were similarly firm, with the CF Broad Cap Index (Diversified Weight) at +3.0% (YTD +10.3%). Meanwhile, the CF Institutional Digital Asset Index closed the week at +4.0% (YTD +9.0%). Weekly returns were clustered between +3.0% and +4.1% (a 1.1 pp range). Notionally, this looks like a mildly agnostic bid within the cap tier, with limited size-style separation perceptible at the index level. The closer tracking between free-float and diversified constructions this week—within a +3.0% to +4.1% band—suggests performance was driven more by perceived commonality of exposure than idiosyncratic constituent weight effects.
Factors Analysis
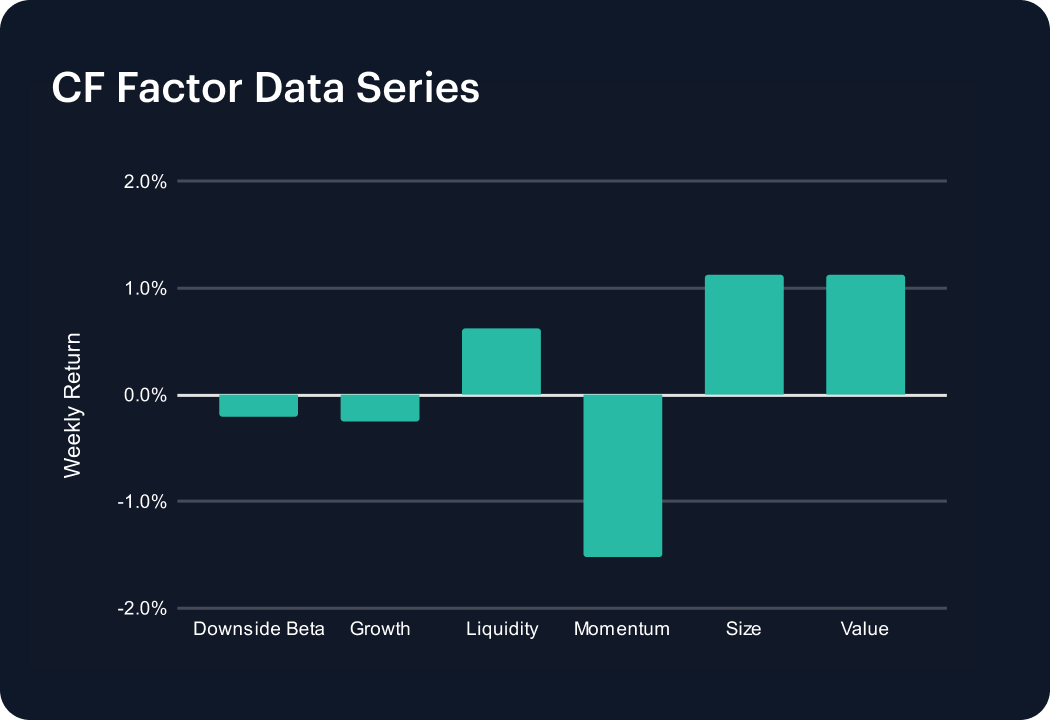
Factor returns were mixed over the week, with outcomes spanning -1.51 pp to +1.13 pp. Factors with positive returns in the current week were Liquidity (+0.63 percentage points), Size (+1.12 pp) and Value (+1.13 pp); while Momentum (-1.51 pp) was the clear laggard, and Downside Beta (-0.21 pp) and Growth (-0.25 pp) were modest drags. Versus the prior week (Downside Beta -0.91 pp, Growth +1.66 pp, Liquidity -1.11 pp, Momentum -0.11 pp, Size +1.83 pp, Value +2.17 pp), week-on-week changes were: Downside Beta +0.70 pp, Liquidity +1.74 pp, Growth -1.91 pp, Momentum -1.40 pp, Size -0.71 pp, and Value -1.04 pp. Net-net, we can observe that the factor complexion rotated toward Liquidity leadership, with Momentum meaningfully negative, and Growth reversing from the prior week’s strength.
Classification Series Analysis
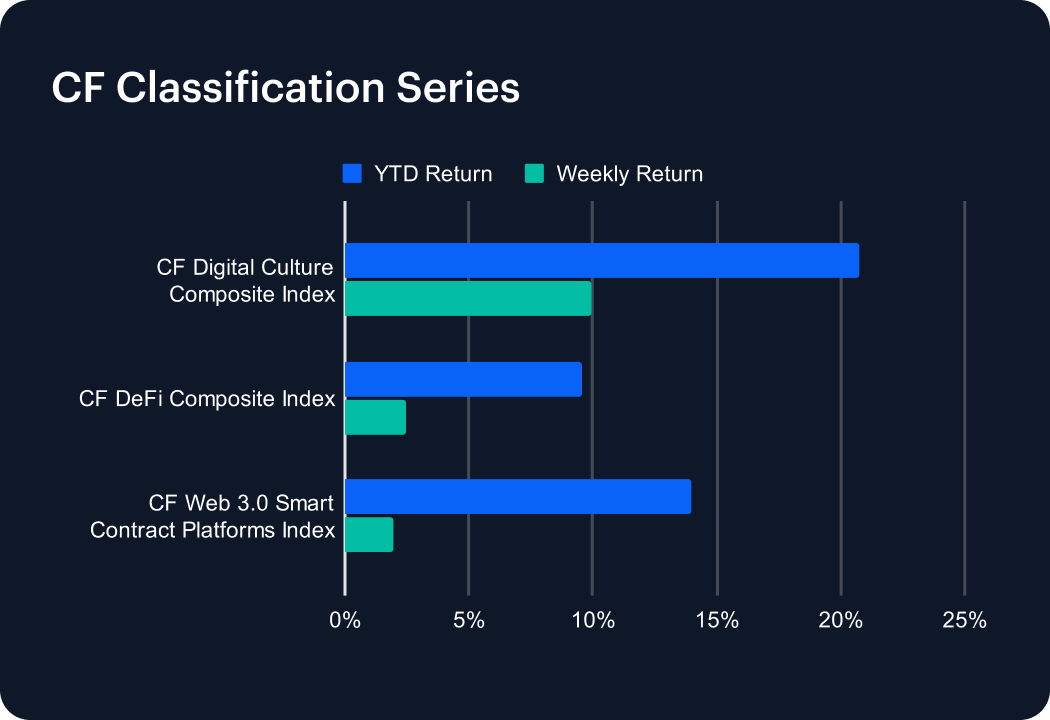
Across the CF Classification Series, CF Web 3.0 Smart Contract Platforms Index returned +1.9% w/w (YTD +14.0%), compared with CF DeFi Composite Index at +2.4% (YTD +9.5%) and CF Digital Culture Composite Index at +9.9% (YTD +20.8%). This equates to CF Digital Culture Composite Index outperforming CF Web 3.0 Smart Contract Platforms Index by roughly 8.0 pp – implying a firm preference for the strongest theme, rather than equal-weighted thematic beta. Given that all three themes posted positive weekly returns, between +1.9% and +9.9%, we can tentatively posit that the tape is consistent with a re-risking impulse, which remained anchored in identifiable leadership instead of broad compression.
Sector Analysis
Performance diverged across the CF DACS classification set, led by the Culture Sub-Category (+11.6% w/w)—boosted by outsized upside in AXS (+104.9%) and strength in CHZ (+23.0%)—while Non-Programmable (-0.7% w/w) lagged, weighed by BCH (-4.4%) and LTC (-3.0%) despite BTC (+4.2%) partially offsetting. Elsewhere, Programmable finished +3.1%, helped by ICP (+27.7%) and ETH (+7.0%), and Utility rose +2.8%, with LINK (+4.3%) among the notable contributors. Among other gainers, Finance added +1.5%, and Infrastructure advanced +1.3%—with Interoperability (e.g., ZRO +18.3%, QNT +10.5%) offset by weakness in the Computing cohort (e.g., RENDER -10.9%). Across the set, weekly outcomes spanned -0.7% to +11.6% (a 12.3 pp spread), echoing the selective risk bid observed elsewhere, though with a pronounced cross-theme dispersion more visible through the CF DACS lens.
CF Staking Series
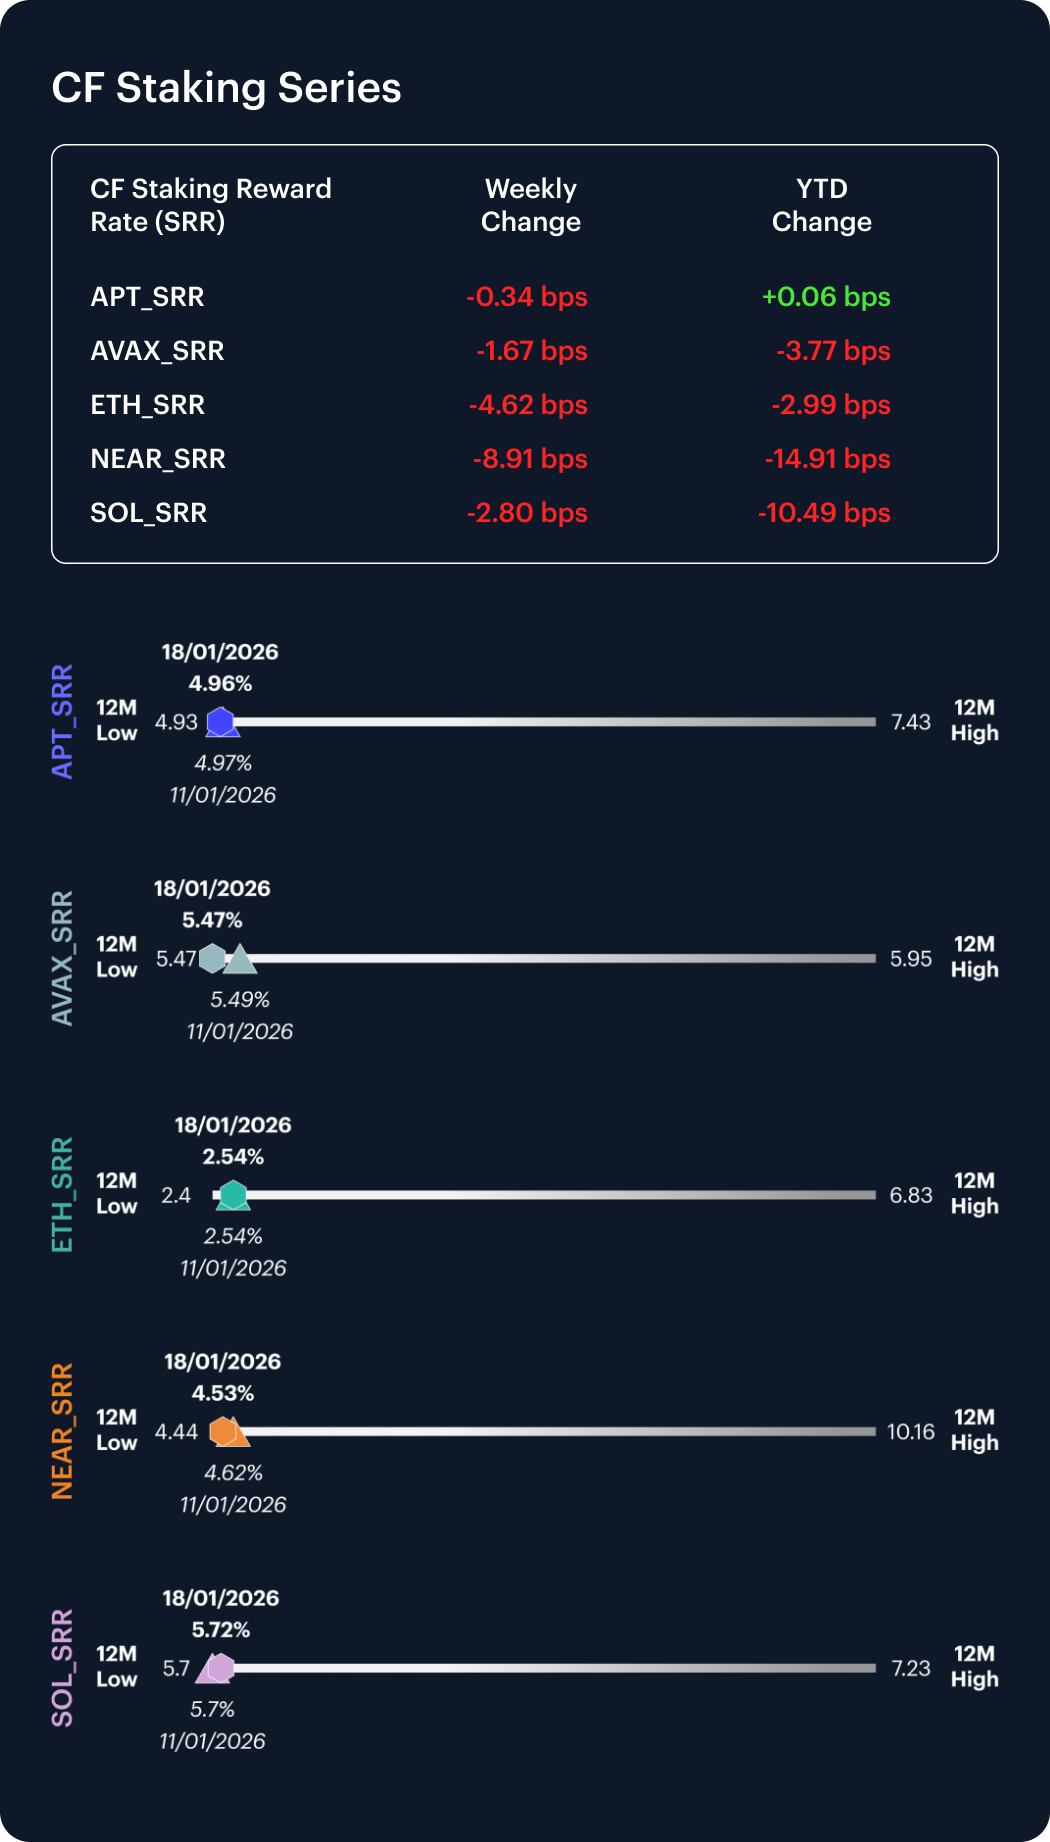
Within the CF Staking Series, weekly performance was modestly negative across the complex, with APT Staking at -0.1% w/w and ETH Staking at -1.8% w/w, while SOL Staking declined -0.5% and NEAR Staking was -1.9%. Intra-week Reward Rate moves were thus: APT -0.34 bps, AVAX -1.67 bps, ETH -4.62 bps, NEAR -8.91 bps, and SOL -2.8 bps. In aggregate, intra-week reward-rate changes spanned -8.91 bps to -0.34 bps. That’s a narrow band in absolute terms, and consistent with orderly curve repricing. The combination of small reward-rate adjustments and mostly moderate weekly spot price moves suggests the staking complex remained driven by incremental positioning rather than forced de-leveraging.
Interest Rate Analysis
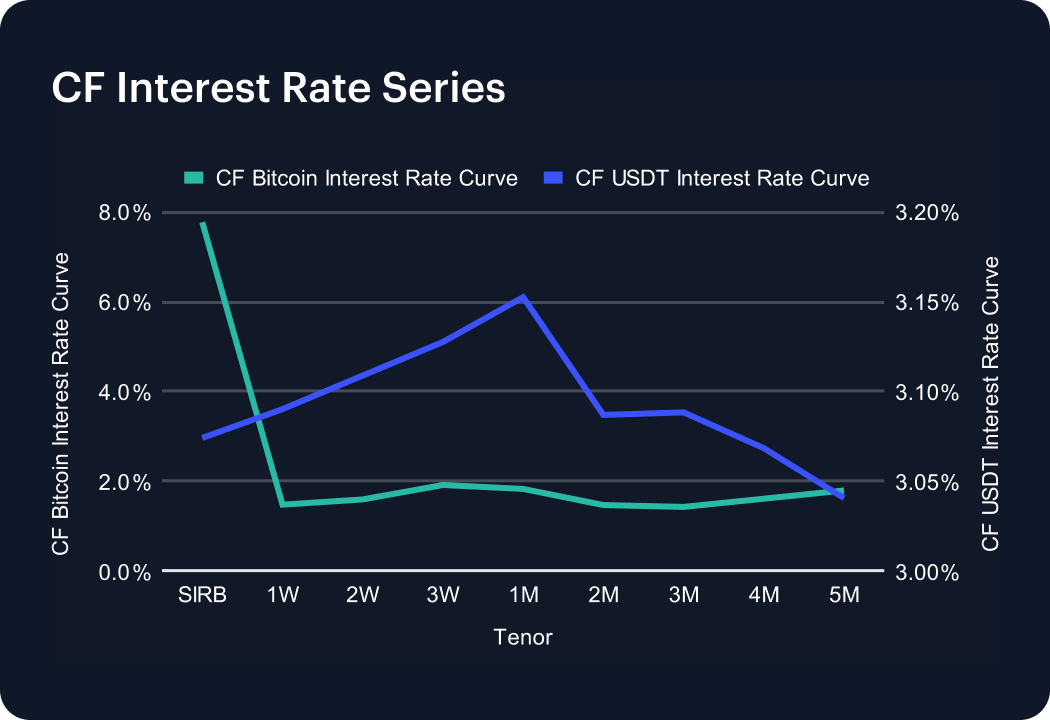
Funding conditions diverged across the CF BIRC curves, with BTC SIRB moving from 11.07% to 7.78% (-329 bps), while the 1W tenor shifted from 2.35% to 1.47% (-88 bps) and 1M from 1.85% to 1.82% (-3 bps). In USDT, SIRB moved from 2.78% to 3.07% (+29 bps), with 1W up from 2.79% previously, to 3.09% (+30 bps) and 1M moving from 2.82% to 3.15% (+33 bps). Across BTC and USDT tenors, rate changes spanned -329 to +35 bps over the week week, highlighting a front-end normalization in BTC, alongside a modest upward drift in USDT funding. This configuration may point to some easing off of leverage premia in BTC, at the very front end (SIRB -329 bps; 1W -88 bps), even as stablecoin funding remained firm (+29 to +35 bps across key USDT tenors). A controlled, basis-driven adjustment is suggested.
The information contained within is for educational and informational purposes ONLY. It is not intended nor should it be considered an invitation or inducement to buy or sell any of the underlying instruments cited including but not limited to cryptoassets, financial instruments or any instruments that reference any index provided by CF Benchmarks Ltd. This communication is not intended to persuade or incite you to buy or sell security or securities noted within. Any commentary provided is the opinion of the author and should not be considered a personalised recommendation. Please contact your financial adviser or professional before making an investment decision.
Note: Some of the underlying instruments cited within this material may be restricted to certain customer categories in certain jurisdictions.
Changes to the Token Market Price Benchmarks Series - Market Prices – 21 July 2026
The Administrator has confirmed changes to the Token Market Price Family for the period 14 July 2026 to 21 July 2026.

CF Benchmarks
Softer CPI Reprices July Hike Risk & Lifts Digital Assets
Digital assets extended their recovery over the past week as cooler US inflation prints repriced Fed expectations; the bid was broad across the large cap indices, growth factor leadership returned, stablecoin funding repriced lower, and stress stayed isolated in names hit by token-specific news.
Mark Pilipczuk
Notice of the Demising of CF Dai-Dollar Settlement Price and Spot Rate
The Administrator announces that it will demise the CF Dai-Dollar Settlement Price (DAIUSD_RR) and CF Dai-Dollar Spot Rate (DAIUSD_RTI) which are members of the CF Digital Asset Index Family.
CF Benchmarks
By clicking Accept, you consent to CF Benchmarks's use of cookies.
Visit Cookie Settings to learn how CF Benchmarks uses cookies and to adjust your preferences.