
Jan 13, 2025
Weekly Index Highlights, January 13, 2025
Market Performance Update
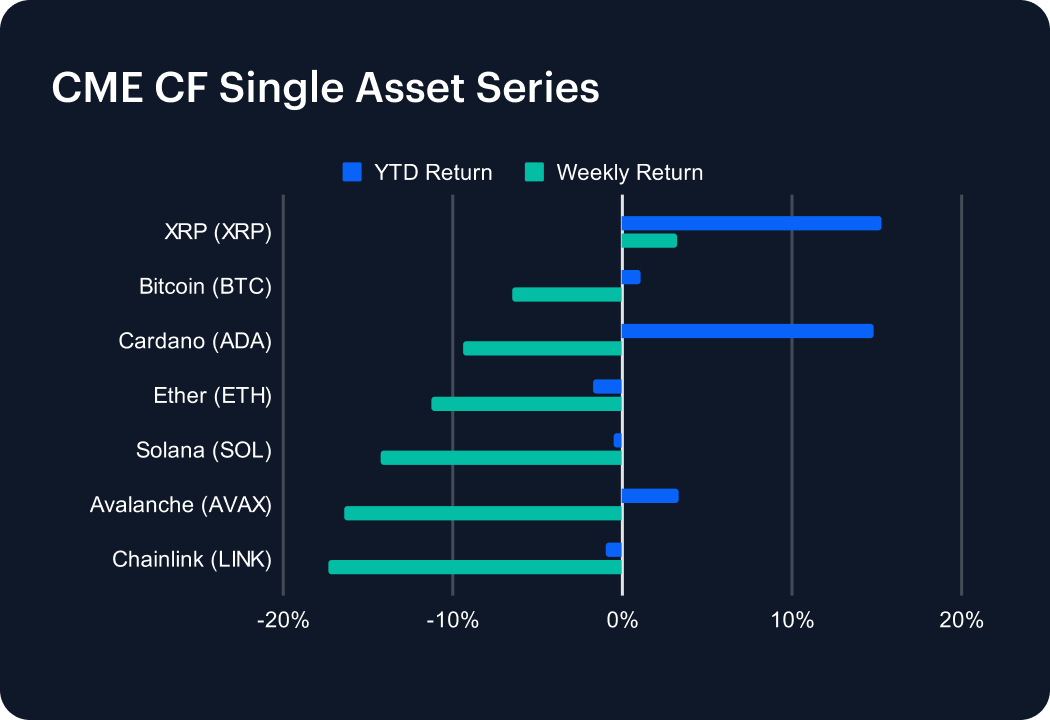
A broad-based decline across digital assets marked the recent week, with most CME CF Single Asset indices retreating following their prior advances. XRP (XRP) emerged as the most resilient performer, gaining +3.19% weekly and maintaining a YTD return of +15.26%. Bitcoin (BTC), despite its bellwether status, struggled with a -6.53% weekly decline, bringing its YTD performance to a modest +1.06%. Cardano (ADA) saw notable losses of -9.39% for the week, reducing its YTD return to +14.77%. Meanwhile, Solana (SOL) slipped -14.26% weekly, turning its YTD performance negative at -0.51%. Ether (ETH), Avalanche (AVAX), and Chainlink (LINK) followed suit, posting significant weekly declines of -11.27%, -16.43%, and -17.36%, respectively, with LINK and ETH now showing a negative YTD return.
Sector Analysis
A turbulent week for digital assets saw widespread declines across all CF DACS segments, with significant underperformance across Settlement and Culture protocols. In the Finance sub-category Trading tokens led the declines, with SUSHI (-20.36%) and CRV (-18.03%) among the laggards, contributing to the sub-category’s -14.77% average weekly return. Meanwhile, the Culture sub-category was weighed down by Gaming tokens, as GALA (-18.12%) and SUPER (-24.80%) struggled, and Social tokens like PRIME dropped -25.59%, driving the sub-category’s average to -17.12%. Within Services, Oracles and Information & Data Management tokens suffered, with LINK (-17.36%) and GRT (-17.97%) under pressure. Infrastructure tokens were hit hard, led by Scaling solutions like ARB (-21.57%) and SKL (-21.43%). Despite the declines, XRP (+3.19%) stood out as a rare gainer among Non-programmable protocols, contrasting with steep losses for programmable platforms like AVAX (-16.43%) and SOL (-14.26%).
Staking Metrics
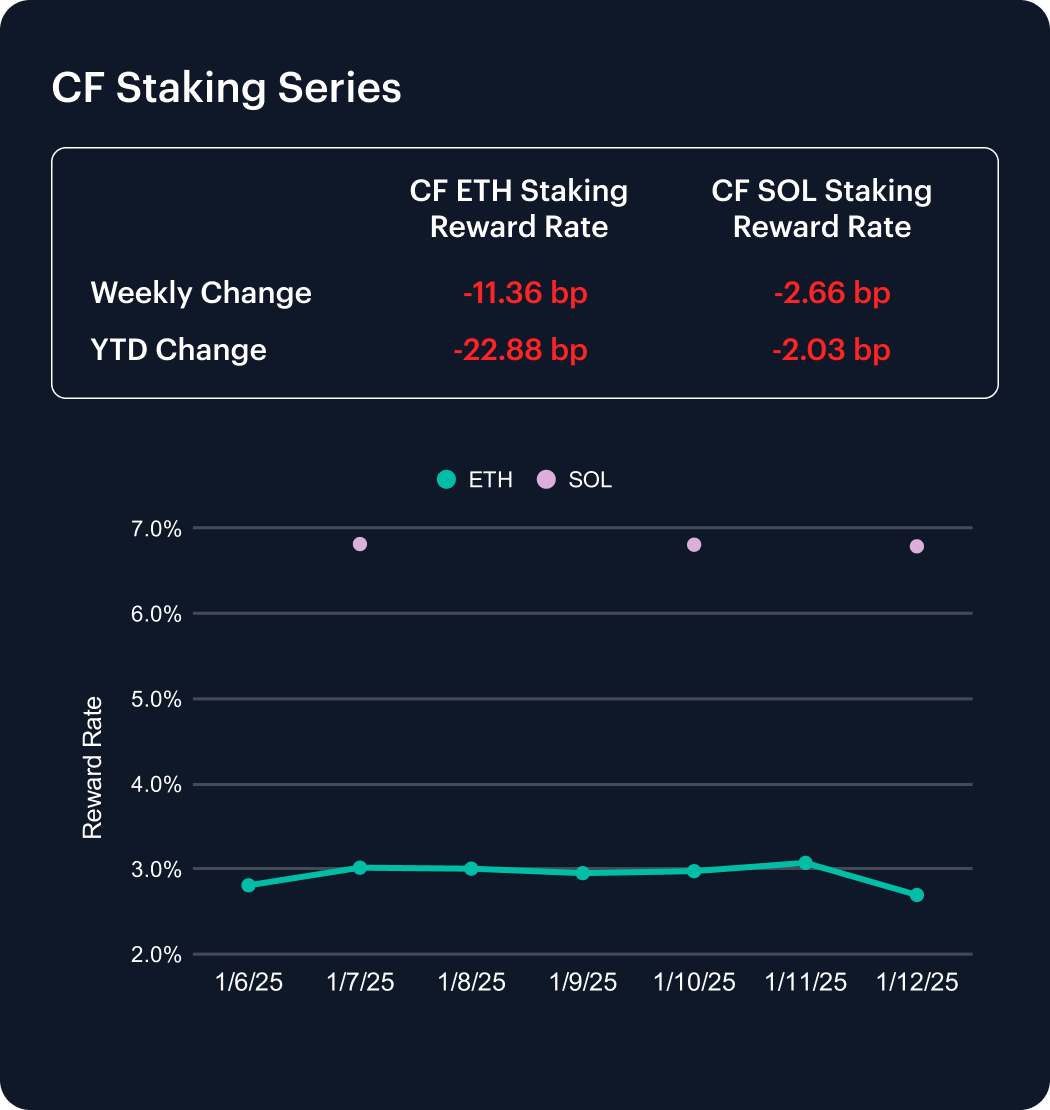
The CF Ether Staking Reward Rate Index (ETH_SRR) decreased by -11.36 basis points over the past week, settling at a 2.69% annual rate. The index experienced intraweek fluctuations, peaking at 3.07% before declining sharply. On a year-to-date basis, ETH staking yields have dropped -22.88 basis points, reflecting a -7.83% decline.
The CF SOL Staking Reward Rate Index (SOL_SRR) exhibited more stability, declining by -2.66 basis points to 6.79%. This marks a modest -0.39% weekly decline, with a year-to-date change of -2.03 basis points (-0.30%). The contrasting performances underscore shifting validator dynamics, with ETH facing sharper yield compression as 2025 begins.
Market Cap Index Performance
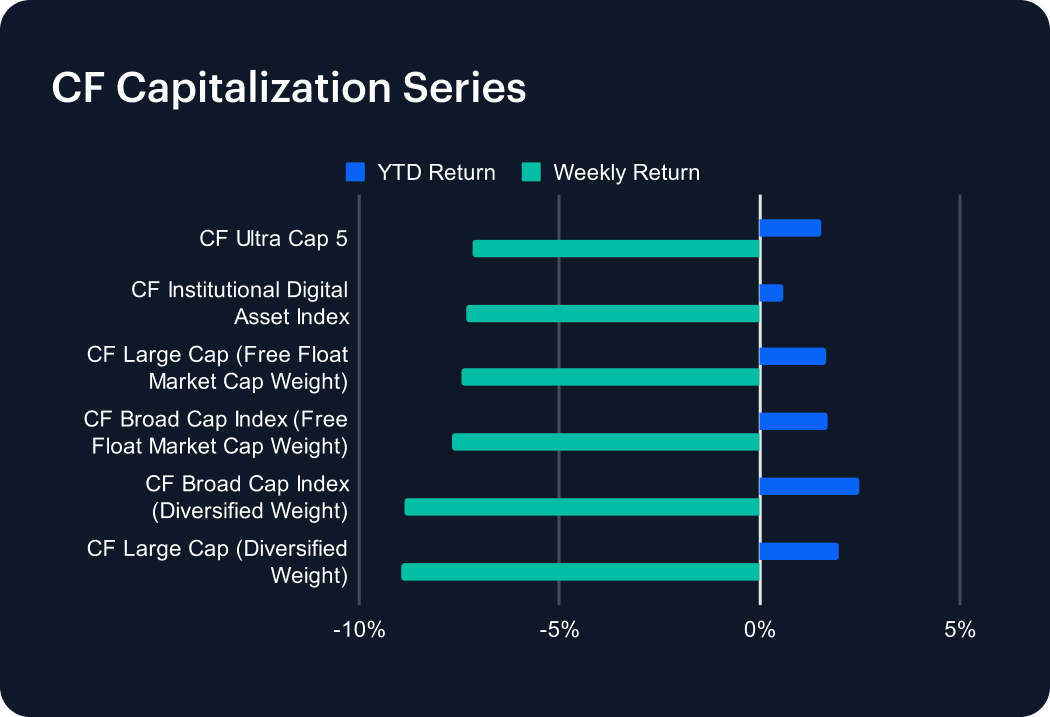
Our CF Capitalization indices reflected notable declines this past week, with diversified weightings underperforming their free float counterparts. The CF Broad Cap Index (Diversified Weight) posted a steep loss of -8.88% weekly, though it maintains the strongest year-to-date position with a modest +2.50% gain. Similarly, the CF Large Cap (Diversified Weight) fell -8.95% for the week, resulting in a +1.95% YTD return.
In contrast, the CF Ultra Cap 5 and CF Institutional Digital Asset Index demonstrated slightly smaller declines of -7.15% and -7.33% weekly, though they have experienced smaller gains year-to-date at +1.54% and +0.59%, respectively. The performance disparity highlights the broader market’s risk aversion, favoring larger-cap assets over diversified exposure as 2025 progresses.
Classification Series Analysis
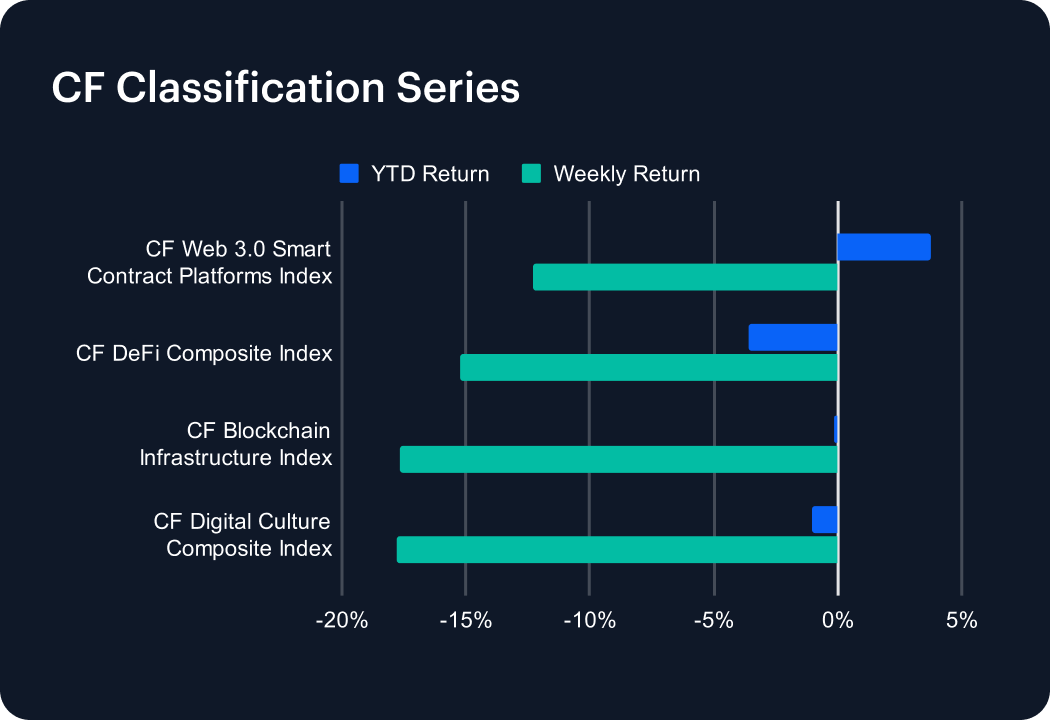
The CF Classification Series indices experienced sharp declines this past week, reversing early-year momentum. The CF Web 3.0 Smart Contract Platforms Index posted a -12.31% weekly loss, reducing its year-to-date return to +3.78%. The CF DeFi Composite Index showed even greater weakness, falling -15.26% for the week and turning negative year-to-date at -3.61%.
Infrastructure protocols underperformed significantly, with the CF Blockchain Infrastructure Index declining -17.69% weekly and slipping to -0.12% YTD. Similarly, the CF Digital Culture Composite Index dropped -17.82% for the week, pushing its YTD performance to -1.01%. The synchronized declines across all sector benchmarks reflect market-wide caution, suggesting dampened sentiment around specialized digital asset verticals as 2025 begins on a challenging note.
Volatility
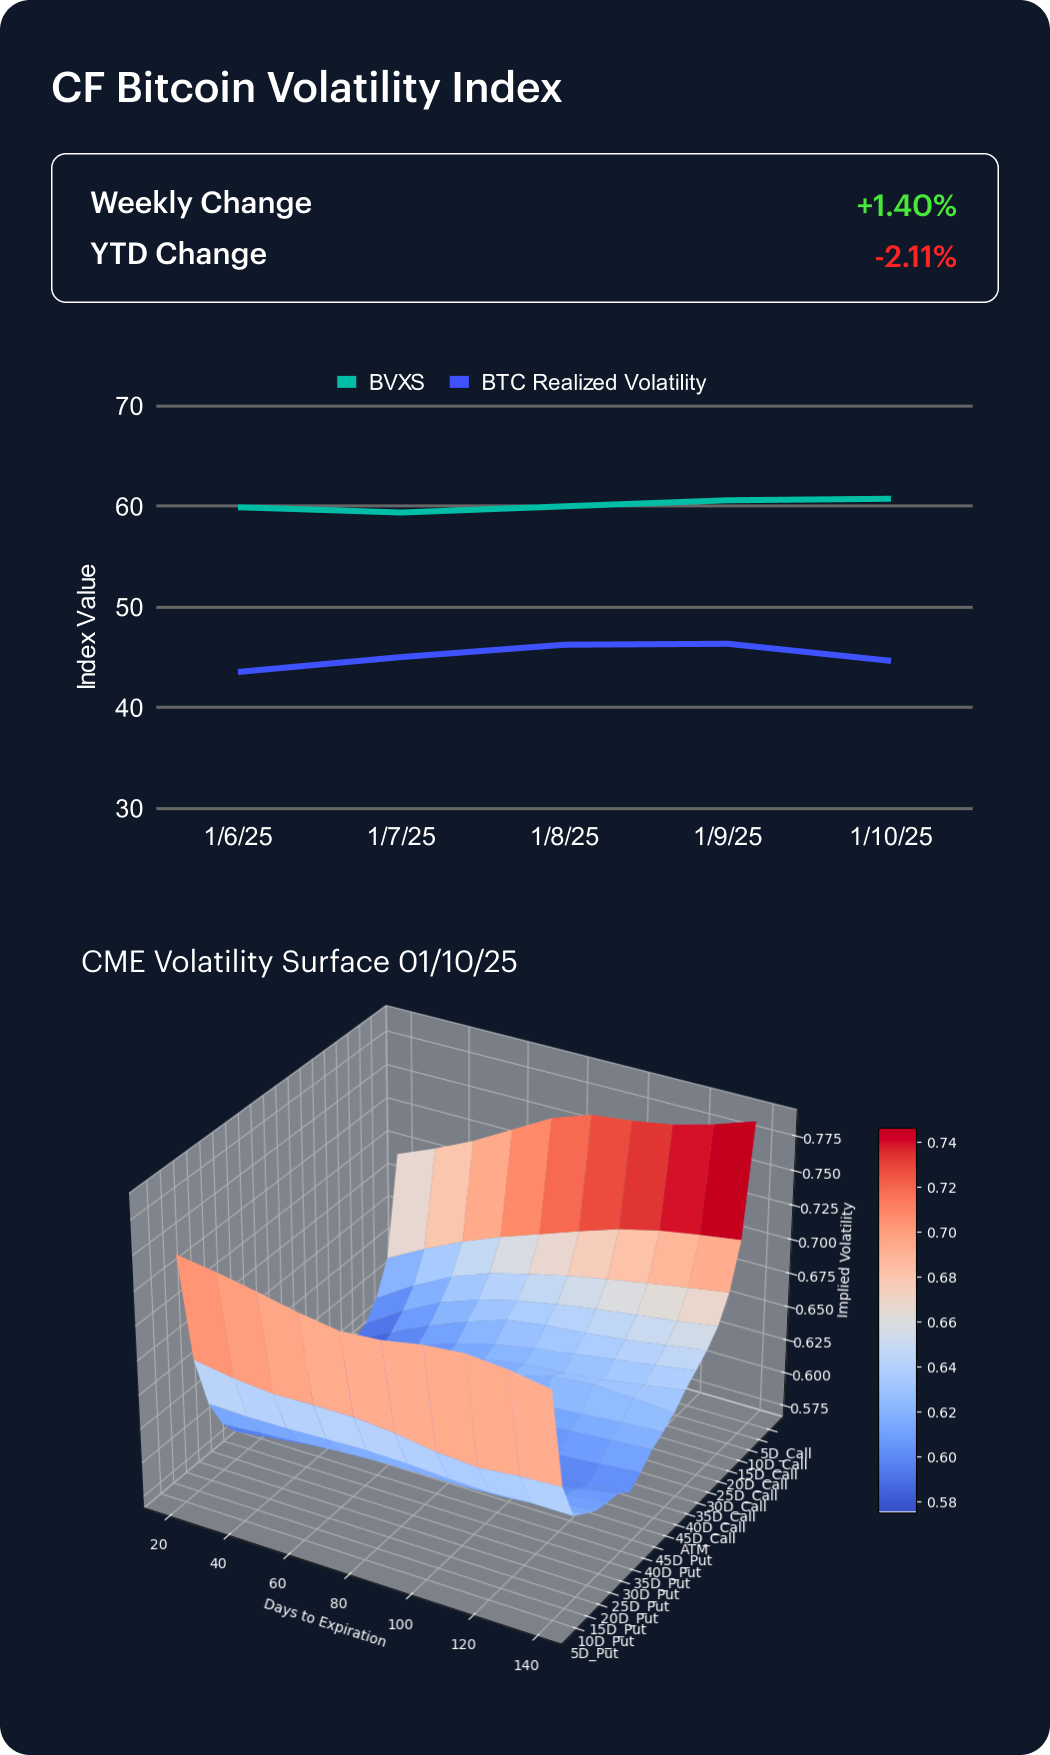
The CF Bitcoin Volatility Index Settlement Rate (BVXS) reversed its prior trend, increasing by +1.40% over the past week to reach 60.79. Despite this weekly uptick, year-to-date implied volatility metrics remain compressed, down -2.11%. Realized volatility also edged higher, peaking midweek at 46.38 before moderating slightly to 44.68.
Analysis of the CME Bitcoin Volatility Surface indicates a flattening skew, with increased convexity across strike ranges as of January 10, 2025, compared to December. The rise in implied volatility suggests renewed demand for options hedging, likely in response to shifting market sentiment. This contrasts with December’s subdued volatility patterns and highlights growing attention to tail-risk outcomes, as institutional participants adjust positioning amid evolving market conditions.
Interest Rate Analysis
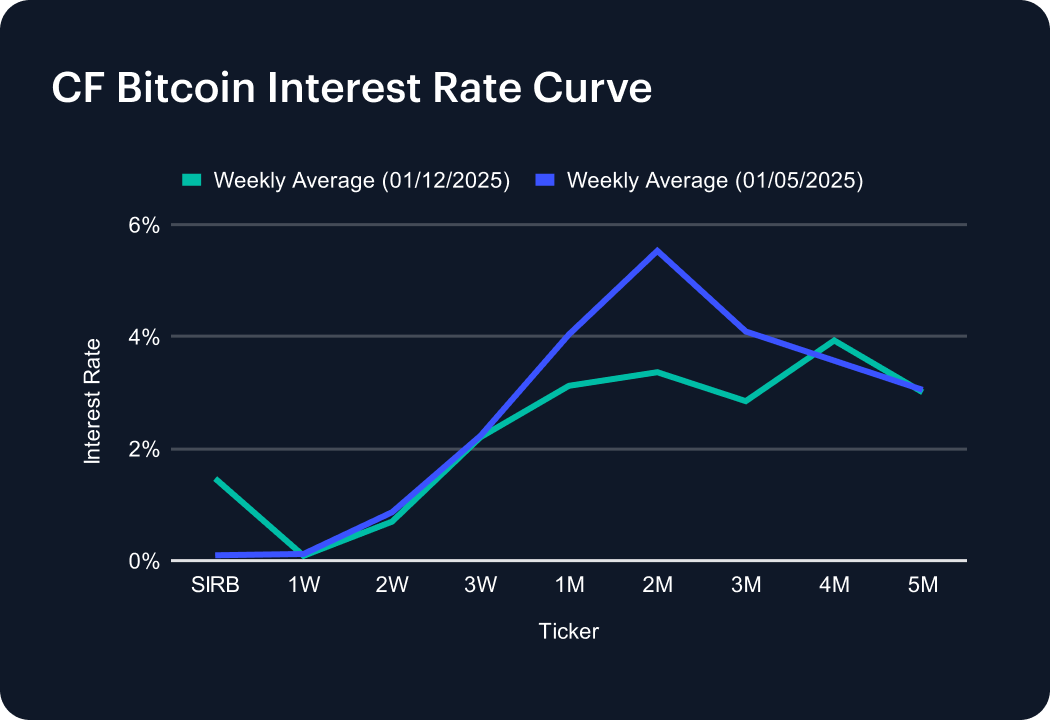
The CF Bitcoin Interest Rate Curve saw significant repricing across various tenors, with a notable flattening in medium-term rates. The 2-Month tenor, which previously led gains, declined to 3.36%, reflecting a -217 basis point weekly decrease. Similarly, the 1-Month rate fell to 3.12%, down -92 basis points week-over-week.
Short-term rates showed mixed movement, with the SIRB climbing to 1.47% from 0.10%, while the 1-Week tenor slipped slightly to 0.09%. The longer end of the curve exhibited stability, with 3-Month and 5-Month tenors averaging 2.85% and 3.01%, respectively. This flattening across the curve indicates a moderation in institutional lending dynamics and reflects shifting preferences for Bitcoin collateral across different maturities as 2025 begins.
The information contained within is for educational and informational purposes ONLY. It is not intended nor should it be considered an invitation or inducement to buy or sell any of the underlying instruments cited including but not limited to cryptoassets, financial instruments or any instruments that reference any index provided by CF Benchmarks Ltd. This communication is not intended to persuade or incite you to buy or sell security or securities noted within. Any commentary provided is the opinion of the author and should not be considered a personalised recommendation. Please contact your financial adviser or professional before making an investment decision.
Note: Some of the underlying instruments cited within this material may be restricted to certain customer categories in certain jurisdictions.
Factor Friday - July 31, 2026
July's rally has stalled, with the Market factor flat at +0.02% and its four-week gain down to +0.48% from +7.13%. Momentum led a second straight week at +1.96%, its first back-to-back run since late May, while Growth reversed to +1.74% and Value fell to the bottom at -1.93%.

Mark Pilipczuk
Changes to the Token Market Price Benchmarks Series - Market Prices – 28 July 2026
Changes to the Token Market Price Benchmarks Series - Market Prices – 28 July 2026
CF Benchmarks
Digital Assets Absorb Hawkish Repricing Ahead of the FOMC
Digital assets traded through a hawkish macro surprise this week but closed mostly higher, with breadth holding across major names and indices. Sector leadership traced to a single regulatory catalyst, not a broad rotation, and implied volatility stayed firmer than realized into the weekend.
Mark Pilipczuk
By clicking Accept, you consent to CF Benchmarks's use of cookies.
Visit Cookie Settings to learn how CF Benchmarks uses cookies and to adjust your preferences.