
Dec 08, 2025
Weekly Index Highlights, December 8, 2025
Market Performance Update
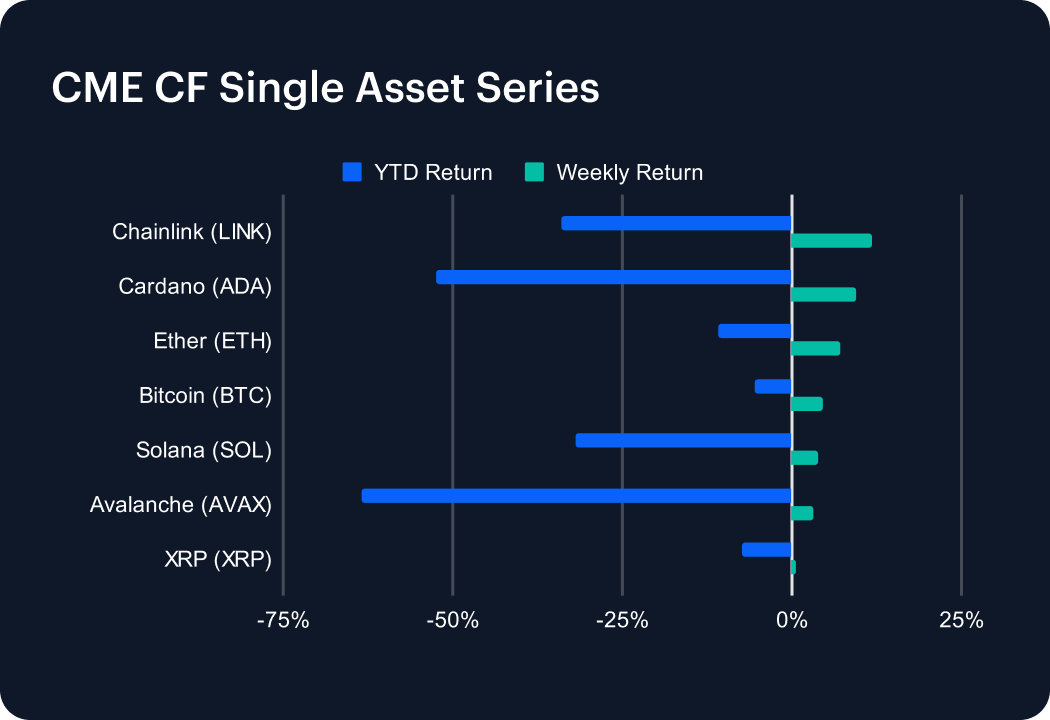
Digital assets suffered yet another strong downdraft in recent sessions, though after a firmer showing in the first half of the most recently completed week, large and mega caps still managed to post a constructive week overall, with Bitcoin, Ether and key layer 1s ending in positive territory. Bitcoin gained about 4.5% week-on-week, recovering its year-to-date (YTD) outcome to a less malign -5.4%, while Ether (ETH) rose roughly 7.2% on the week, leaving it -11.0% YTD. Higher-beta names did even more of the heavy lifting. Chainlink (LINK) rallied approximately 11.7%, ending -34.1%, YTD, Cardano (ADA) added 9.4% to stand YTD -52.4%, and Solana (SOL) and Avalanche (AVAX) were up 3.8% and 3.1% respectively, despite still sitting on deep YTD drawdowns (around -32.0% and -63.5%). XRP (XRP) lagged with a modest 0.5% w/w gain (YTD -7.4%). All told, this was a quality-led beta bounce rather than a wholesale squeeze. Order books and spreads remained orderly, suggesting a technical relief rally from oversold conditions rather than a decisive regime change.

Sector Analysis
Sector performance through the CF Digital Asset Classification Structure (CF DACS) lens was more nuanced than during the recent liquidation phase. Within Finance, Trading tokens mostly traded lower in absolute terms – for instance SUSHI fell about -4.5% week-on-week, SNX lost roughly -4.7%, and 1INCH around -2.7%; while JTO in Asset & Wealth Management bucked the trend with a gain of +4.9%. In Culture, dispersion widened: PRIME surged approximately +68.7%, while meme tokens such as WIF and PEPE added about +10.0% and +8.0% respectively, even as Media and VR/AR names softened (APE down -4.3%, BAT about -1.0%). Overall, sector moves show selective re-risking, with pockets of aggressive buying coexisting with persistent caution in more “earnings-like” parts of Finance.
CF Staking Series
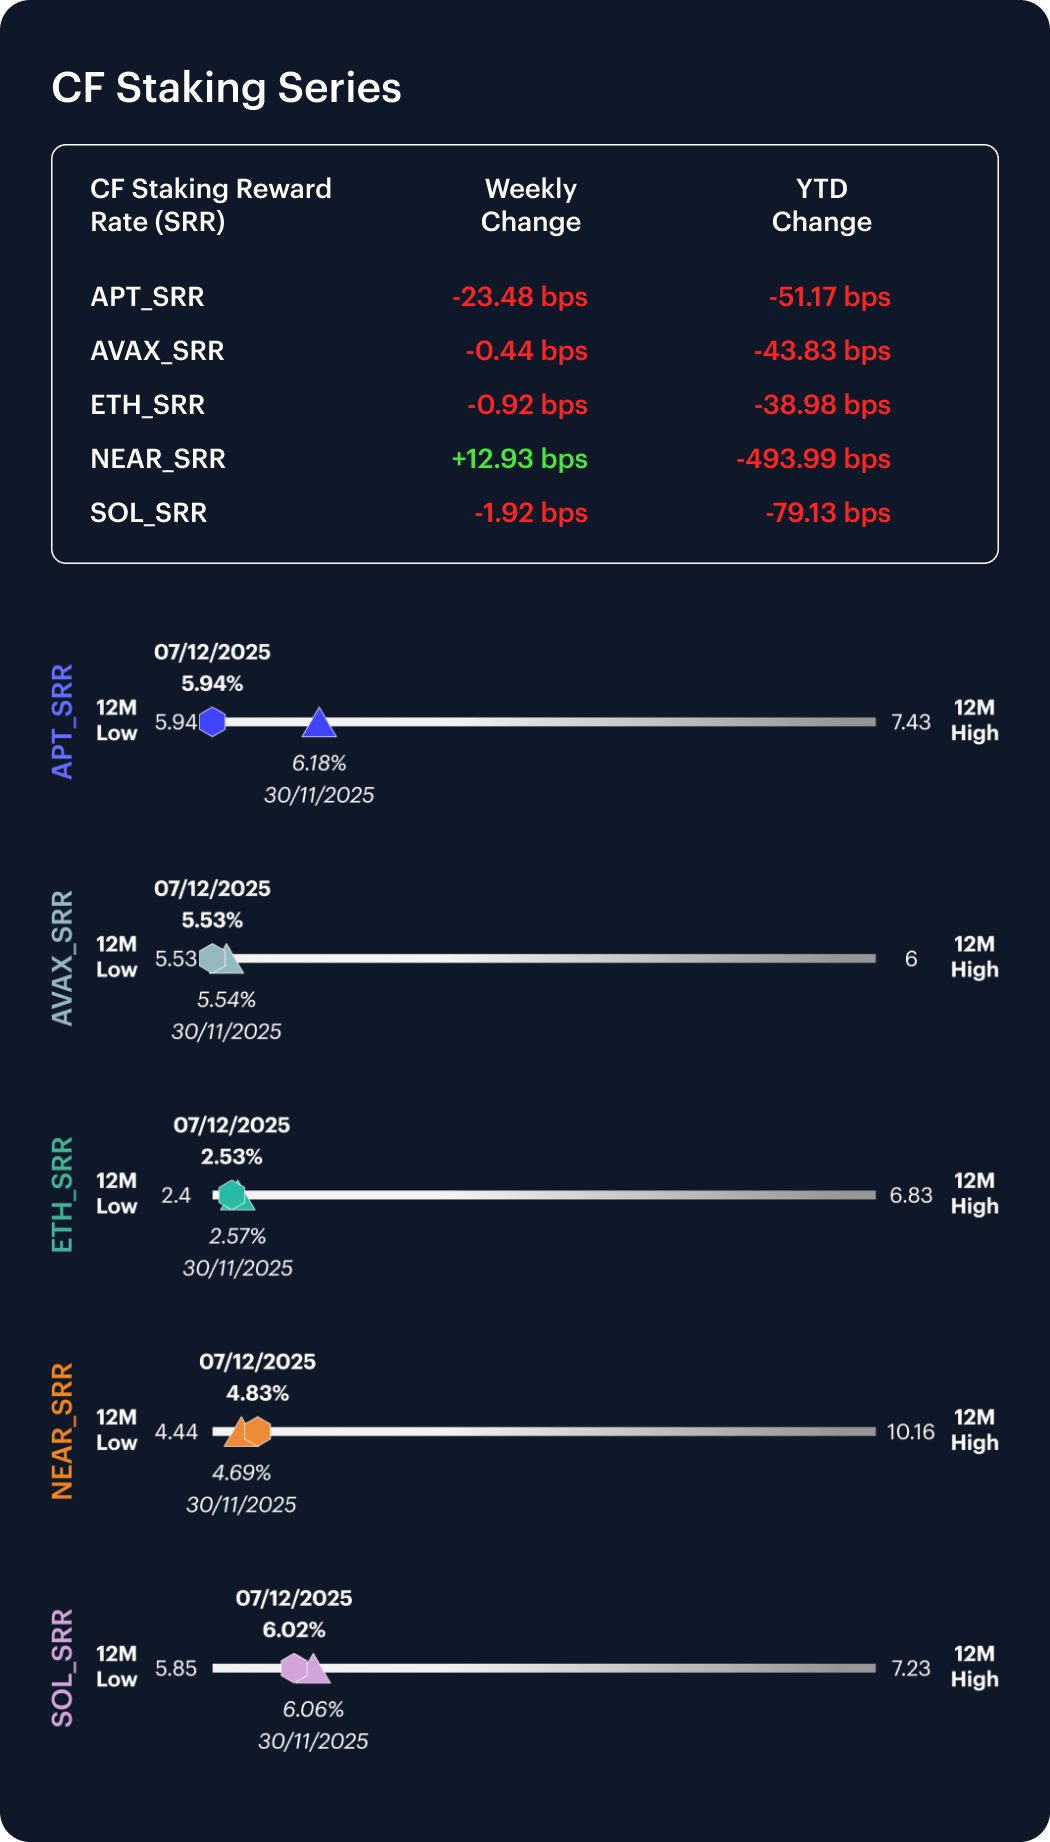
The CF Staking Series staking indices delivered a directionally clean set of weekly moves. APT staking fell -3.8%, with reward-rate changes steepening from -1.1 bps last week to roughly -23.5 bps this week. AVAX staking was nearly flat at -0.1%, with weekly changes easing from -0.06 bps to -0.44 bps. ETH staking slipped -0.4%, with reward rates flipping from +0.10 bps to approximately -0.9 bps. The more notable moves were in NEAR, which gained +2.8% week-to-week and saw reward-rate increases accelerate from +3.4 bps to +12.9 bps; and in SOL, which fell -0.3%, but still exhibited positive weekly reward-rate changes (+2.0 bps, up from +1.4 bps). Taken together, the staking indices show orderly repricing of reward curves, with modest softening in APT and ETH, and re-expansion on NEAR and SOL. Tentatively, these readings suggest a staking complex that’s bereft of any specific signs of stress.
Market Cap Index Performance
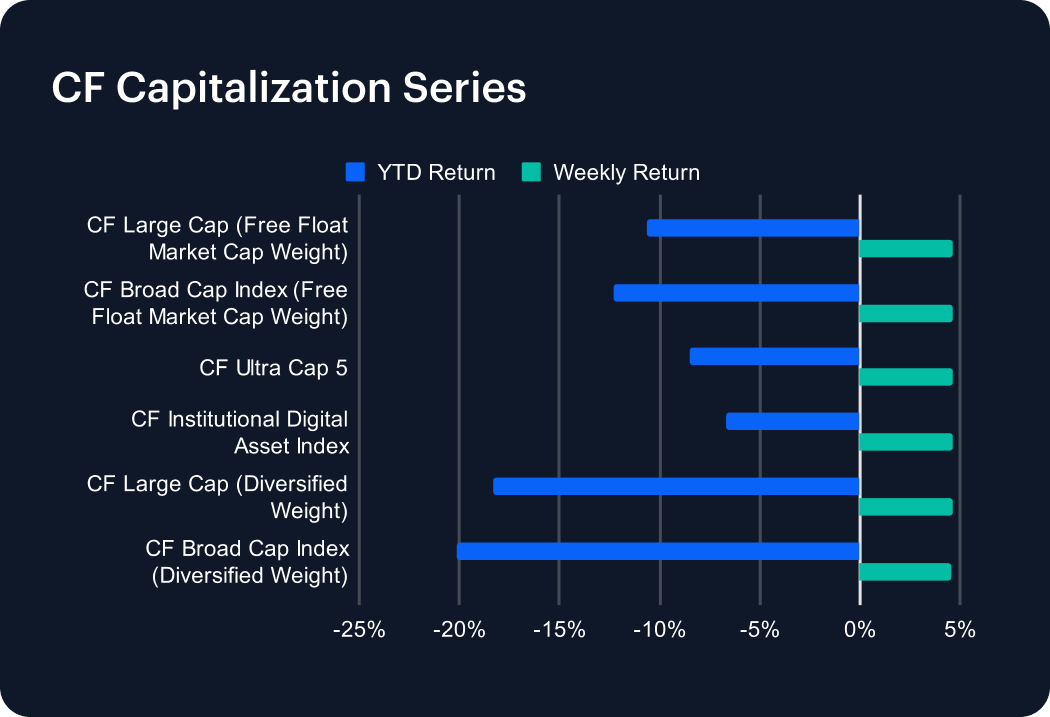
All tiers in the CF Capitalization Series posted similar weekly gains, illustrating a tier-agnostic relief rally. The CF Ultra Cap 5 gained about +4.6% w/w (YTD -8.5%), matched closely by the CF Large Cap (Free Float Market Cap Weight) at +4.7% (YTD -10.7%), and the CF Broad Cap Index (Free Float Market Cap Weight) at +4.6% (YTD -12.3%). Diversified-weight indices moved in near lockstep. The CF Institutional Digital Asset Index rose +4.6% (YTD -6.7%), the CF Large Cap (Diversified Weight) about +4.6% (YTD -18.3%), and the CF Broad Cap Index (Diversified Weight) +4.6% (YTD -20.1%). The curious clustering in terms of weekly returns near +4.6% strongly indicates a performance that was broad-based and mechanical, with differentiation reflected primarily in YTD damage, rather than recent momentum.
Classification Series Analysis
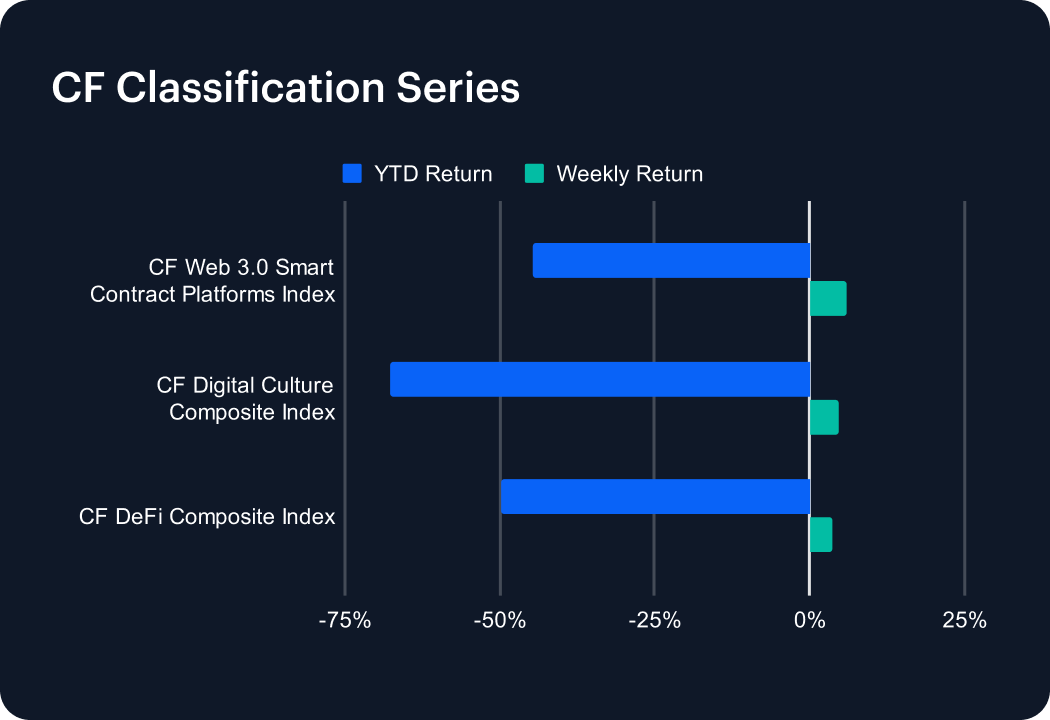
All three thematic indices rebounded week-on-week after heavy YTD declines. The CF Web 3.0 Smart Contract Platforms Index (down YTD -44.7%) gained +6.0% w/w, outperforming both the CF Digital Culture Composite Index (YTD -67.8%, +4.7% w/w) and the CF DeFi Composite Index (YTD -49.8%, +3.8% w/w). The narrower spread between weekly returns suggests beta compression. The relative leadership of Web 3.0 suggests a scenario emerging where allocators are more willing to re-engage with core execution platforms than with DeFi or Culture, where risk-seeking remains more selective. This pattern could be consistent with the early stages of rotation within a broader de-risking environment. Unfortunately, though, a thesis suggesting the recommencement of thematic expansion, seems less favored, for now.
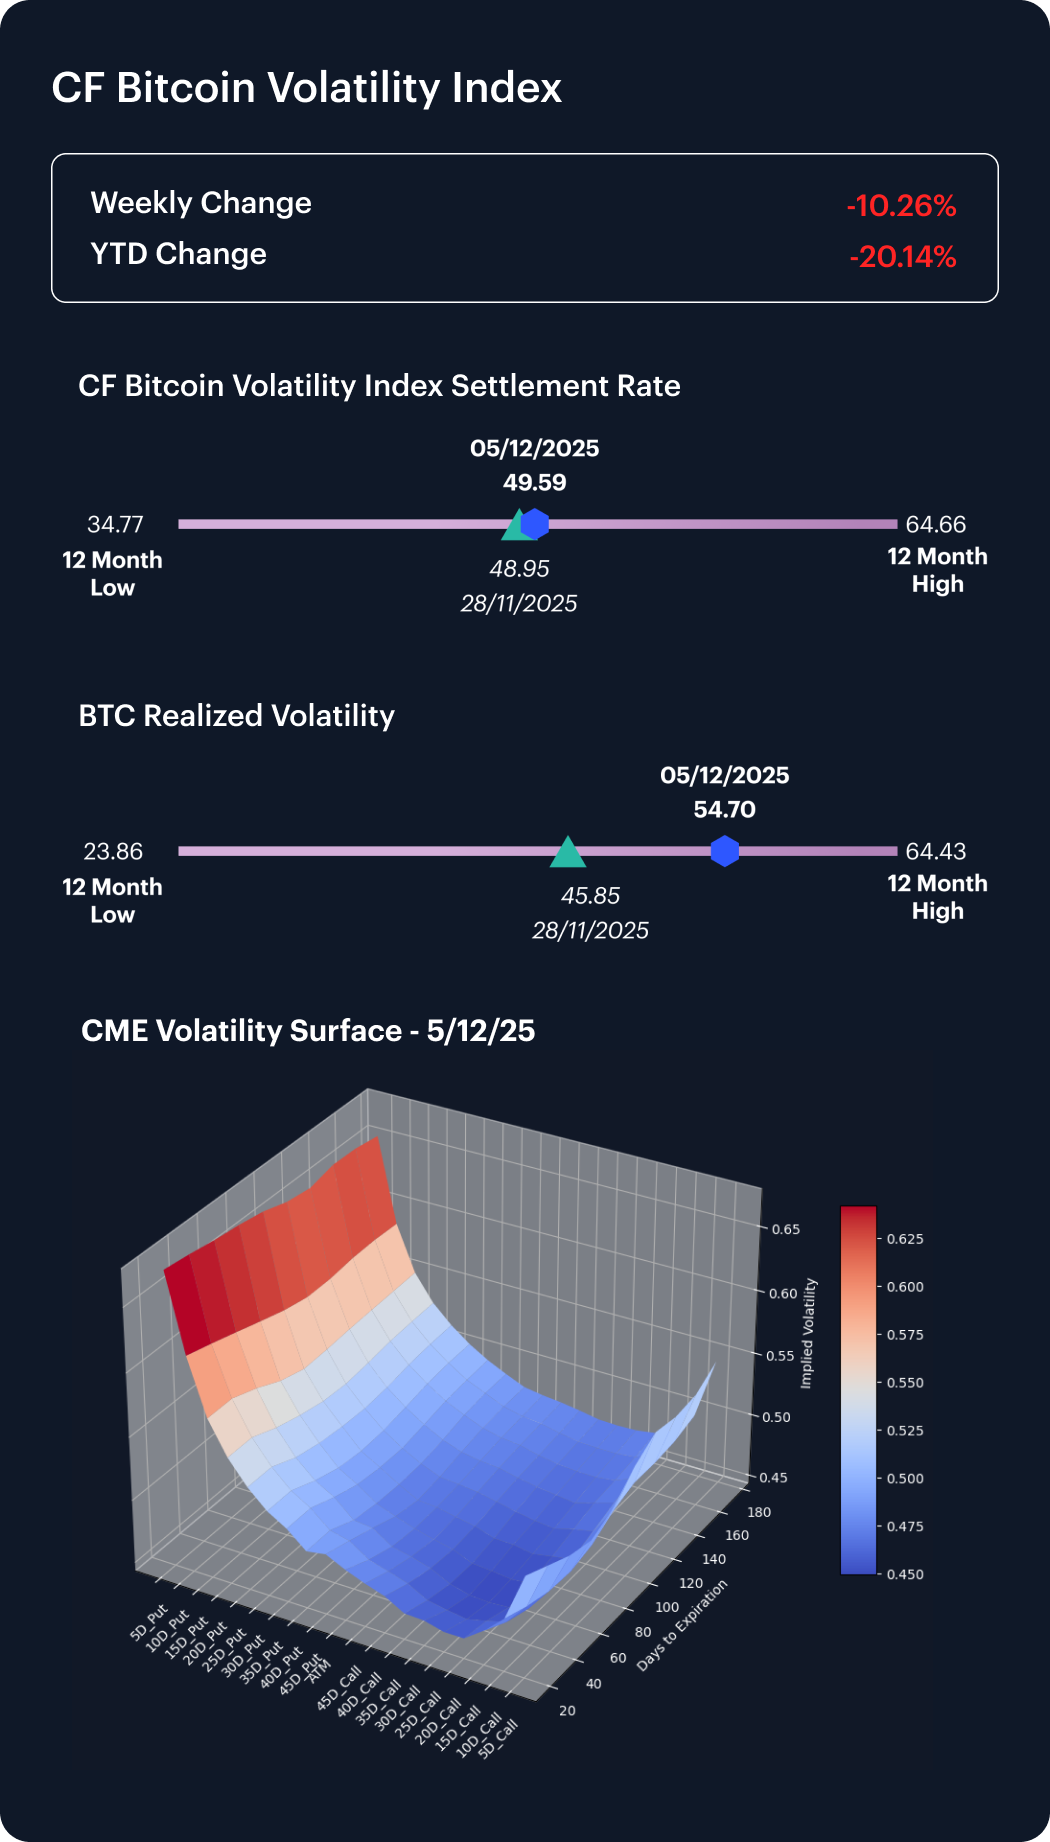
Volatility Analysis
Bitcoin’s volatility profile shifted decisively this week as realized volatility surged from 45.9 to 54.7, overtaking BVX, which edged only modestly higher from 48.9 to 49.6. This inversion — realized now trading above implied — indicates a market absorbing outsized spot swings more than a repricing of option demand. The modest uptick in BVX, set against a much larger realized jump, implies that vol. sellers stepped back while option markets remained orderly, allowing implied to lag the underlying turbulence. The implied–realized spread therefore compressed sharply into negative territory, signaling that the week’s volatility was driven primarily by spot-led shocks rather than hedging flows, and that options markets, while firmer, did not exhibit signs of disorderly repricing.
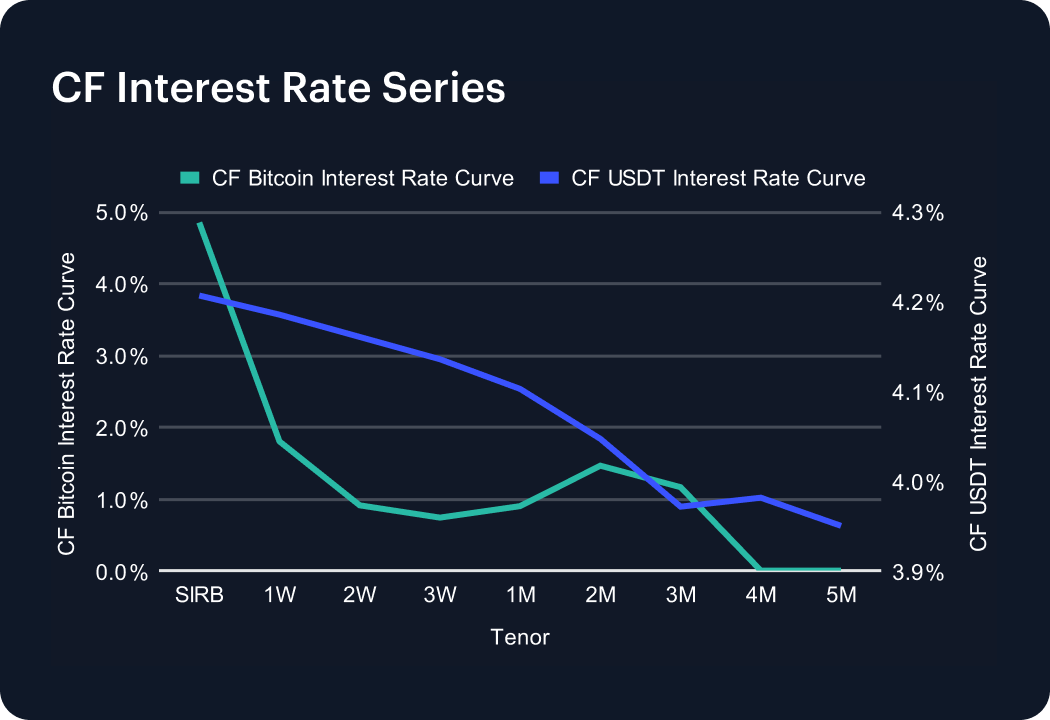
Interest Rate Analysis
Funding conditions diverged meaningfully across BTC and USDT curves, with BTC SIRB collapsing from 10.63% to 4.86% (-5.77 percentage points) as an outsized front-end premium normalized, even while intermediate BTC tenors firmed modestly. For example, 1W rose from 1.19% to 1.80% (+0.61 pp), 2W from 0.58% to 0.91% (+0.33 pp) and 2M from 1.26% to 1.46% (+0.20 pp), leaving the curve still positively sloped across the 1W–3M sector, despite 4–5M tenors drifting to 0.00%. By contrast, the USDT curve shifted higher almost in parallel, with SIRB rising from 3.74% to 4.21%, and most tenors advancing by +0.33–0.45 pp. For instance, 1W moved from 3.74% to 4.19%, 1M from 3.77% to 4.10%, and 3M from 3.63% to 3.97%. The net effect is a funding landscape where BTC leverage premia normalized sharply at the front end, while USDT funding tightened broadly; a configuration consistent with targeted basis-reset behavior, with systemic funding stress appearing to have been kept to a minimum.
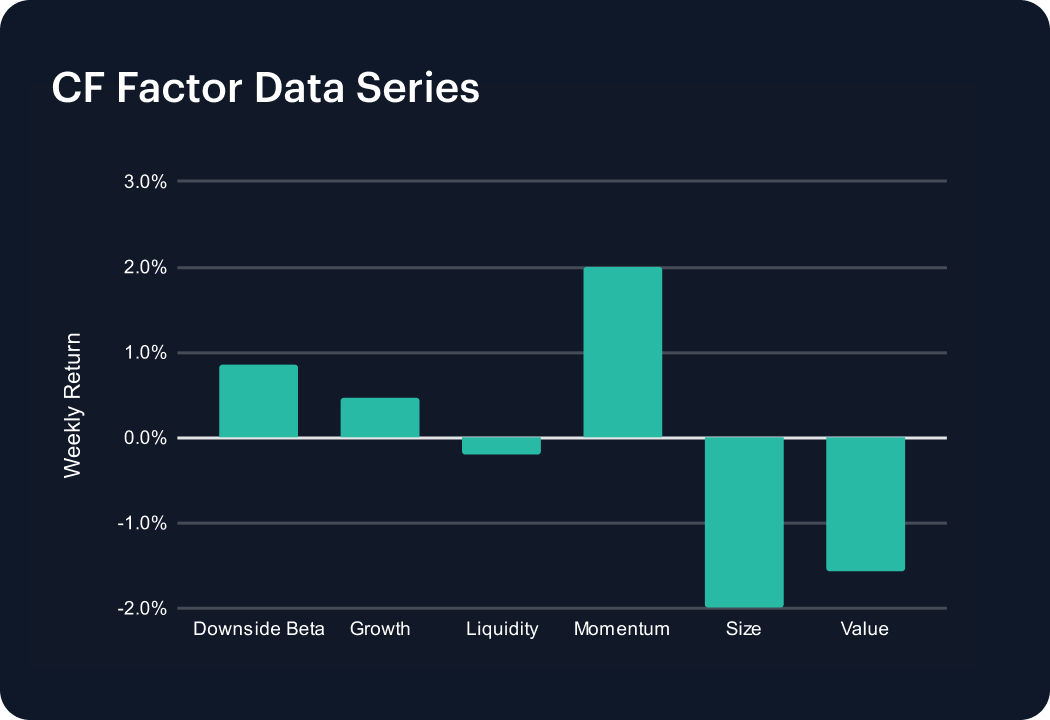
Factors Analysis
Factor returns painted a more nuanced picture over the week, with leadership rotating away from pure downside protection towards Growth and Momentum, while liquidity and size cheapened. Downside Beta fell sharply from 2.05% to 0.85% (-1.2 pp, w/w), indicating a meaningful reduction in demand for high-beta exposure versus the prior week’s risk-on stance. By contrast, Growth swung from -1.36% to +0.47% (a +1.83 pp shift), and Momentum improved from 0.88% to 2.01% (+1.13 pp), suggesting that investors rotated back into growth and trend-following expressions after de-risking the week before. Liquidity weakened materially, dropping from 1.36% to -0.21% (-1.57 pp), while Size turned further negative, from -0.96% to -2.00% (-1.04 pp), consistent with smaller names underperforming as conditions tightened at the margin. Value remained negative but stabilized, improving slightly from -1.85% to -1.58% (+0.27 pp). Overall, the configuration reads as selective re-risking in quality growth and trend, financed partly by smaller and less liquid exposures, and not an outright return to high-beta carry.
The information contained within is for educational and informational purposes ONLY. It is not intended nor should it be considered an invitation or inducement to buy or sell any of the underlying instruments cited including but not limited to cryptoassets, financial instruments or any instruments that reference any index provided by CF Benchmarks Ltd. This communication is not intended to persuade or incite you to buy or sell security or securities noted within. Any commentary provided is the opinion of the author and should not be considered a personalised recommendation. Please contact your financial adviser or professional before making an investment decision.
Note: Some of the underlying instruments cited within this material may be restricted to certain customer categories in certain jurisdictions.
Changes to the Token Market Price Benchmarks Series - Market Prices – 21 July 2026
The Administrator has confirmed changes to the Token Market Price Family for the period 14 July 2026 to 21 July 2026.

CF Benchmarks
Softer CPI Reprices July Hike Risk & Lifts Digital Assets
Digital assets extended their recovery over the past week as cooler US inflation prints repriced Fed expectations; the bid was broad across the large cap indices, growth factor leadership returned, stablecoin funding repriced lower, and stress stayed isolated in names hit by token-specific news.
Mark Pilipczuk
Notice of the Demising of CF Dai-Dollar Settlement Price and Spot Rate
The Administrator announces that it will demise the CF Dai-Dollar Settlement Price (DAIUSD_RR) and CF Dai-Dollar Spot Rate (DAIUSD_RTI) which are members of the CF Digital Asset Index Family.
CF Benchmarks
By clicking Accept, you consent to CF Benchmarks's use of cookies.
Visit Cookie Settings to learn how CF Benchmarks uses cookies and to adjust your preferences.