
Dec 16, 2024
Weekly Index Highlights, December 16, 2024
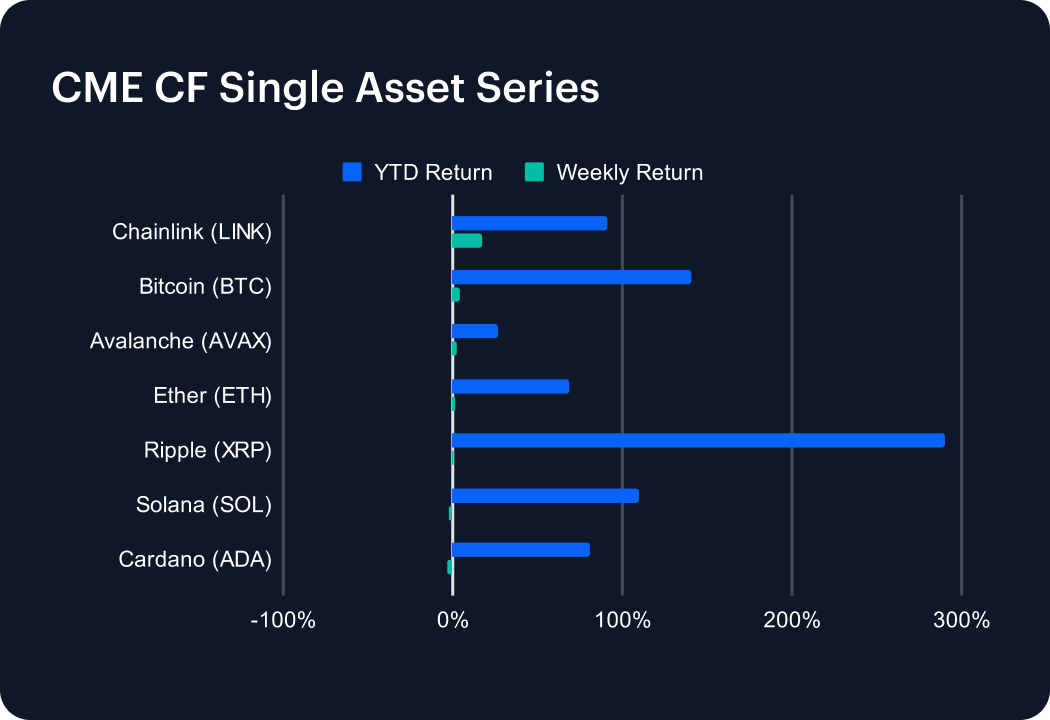
Clearer signs of select large-cap assets taking a breather after notable recent gains and milestones. Chainlink (LINK) continued to outperform, rising +16.93%. That compares with Solana (SOL) and Cardano (ADA), dipping -2.67% and -3.12% respectively, and 2024’s series outperformer XRP, now standing at +290.03% year-to-date (YTD), but barely inching higher, +0.56%, for the week. That said, it’s worth noting Bitcoin’s signal week-on-week advance of +4.37%. It means our CME CF Bitcoin Reference Rate (BRR) posted its first week above $100,000 on a closing basis; ending trade on Sunday December 15th, at $102,840.89. Avalanche (AVAX) edged 1.97% higher.
The week’s easing overall pace was more evident through the lens of the CF Digital Classification Structure (CF DACS), with two prior-week standout sub-categories on the back foot. Less significantly in the case of DeFi, which ticked down -0.33%, on average. More expressly for Culture, which fell an average -7.77%. Nevertheless, note the strong outperformance of AAVE, a Borrowing & Lending DeFi token, striding +35.38% higher; and segment counterpart, ONDO, +15.36%. Lido (LDO), in the Asset & Wealth Management segment, shone too, gaining + 12.56%. Culture’s Gaming segment was also resilient; particularly SuperVerse (SUPER), with a +4.19% rise, while PRIME also closed firmer, +1.87%. All other Gaming tokens slipped. In fact, all 15 of the Culture sub-category’s remaining coins, across Social, Media, VR and AR, and other segments, also declined. Meme Coins bore the brunt. WIF tumbled -16.81%, BONK collapsed -14.38% and PEPE reversed -11.04%. DOGE lost -7.81%.
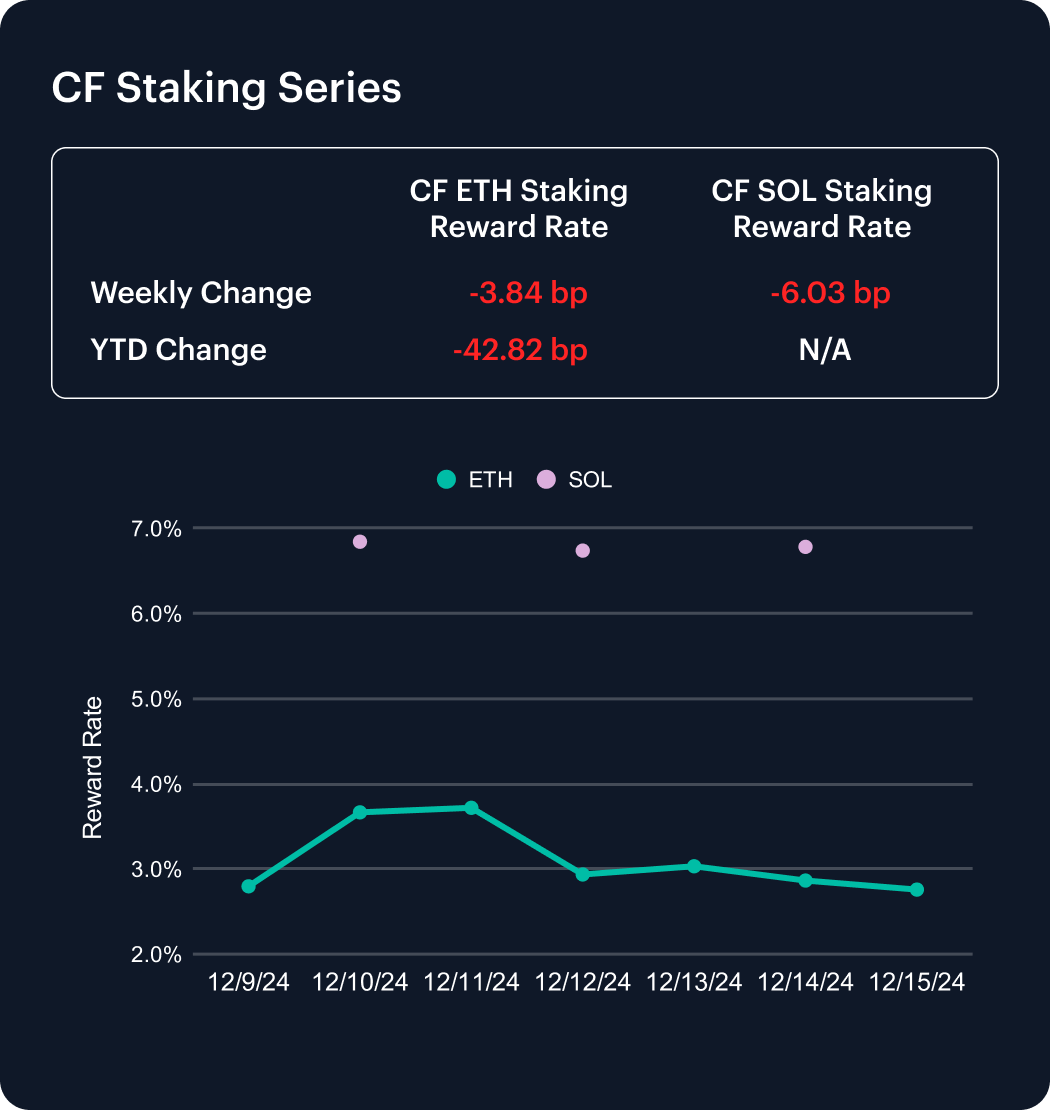
A somewhat notable week for our CF SOL Staking Reward Rate Index (SOL_SRR), due to the first decline of the SOL_SRR change in several weeks; by -6.03 basis points (bp). Judging by the SOL_SRR web page, the index closed the week -9.87% lower than its level on March 2nd, 2024, the earliest date for which a value is available since the benchmark joined this series in November. As for the CF Ether Staking Reward Rate Index (ETH_SRR), it continues to portray the same steady weakening of Ethereum staking rewards witnessed of late, this time slipping -3.84 bp, leaving its YTD change at -42.82 bp.
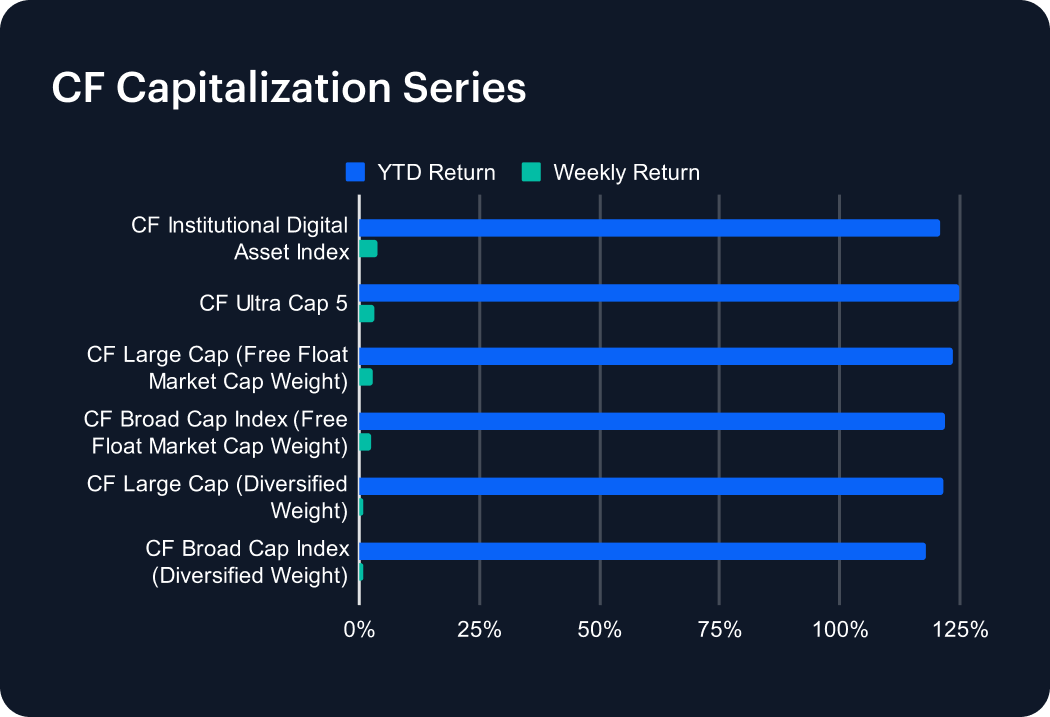
Slim weekly returns of less diversified indices in this series synched with the relative outperformance of large cap tokens. The CF Broad Cap Index (Diversified Weight) and CF Large Cap (Diversified Weight) duly underperformed, eking out respective gains of just +0.72% and +0.82%. Meanwhile, series outperformer, the CF Institutional Digital Asset Index, comprised of Bitcoin and Ether, rose +3.63%. The CF Ultra Cap 5 and CF Large Cap (Free Float Market Cap Weight) followed, with +3.12% and + 2.71%. CF Broad Cap Index (Free Float Market Cap Weight) added +2.57%. For the year, our benchmark of the top 5 tokens by free float market capitalization, the CF Ultra Cap 5, is the outperformer, standing +124.69% higher, YTD. The spread between the average 2024 return of the remaining indices in the series, 121.15%, and the weakest, is now just 3.41 percentage points.
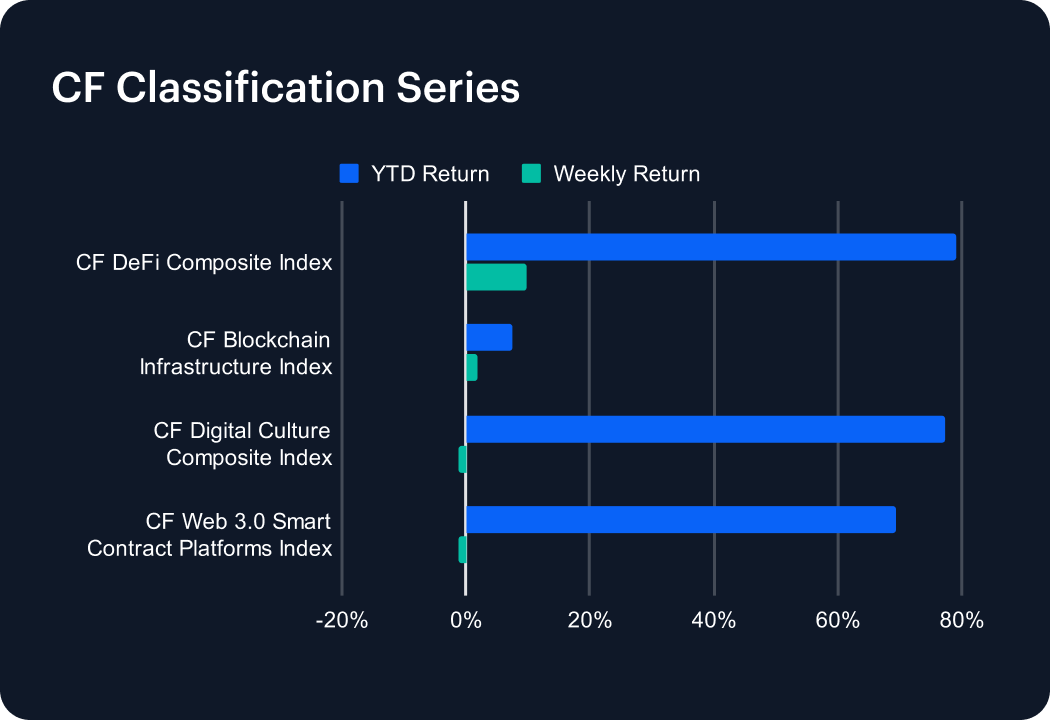
The relative outperformance of the DeFi sub-category, cited in the CF DACS section above, has pointers for the similar outperformance of the CF DeFi Composite Index over the week, with a +9.90% rise. With the CF Blockchain Infrastructure Index stepping only +1.87% ahead – see the CME CF Single Asset section for color – our DeFi index’s advance was the standout in this series. Its weekly move has cemented its YTD lead, leaving the DeFi benchmark up +79.00% for the year. Its closest YTD outperforming series peer, the CF Digital Culture Composite Index, has jumped +77.22% so far this year. The Culture gauge edged -1.08% lower for the week, while third-best series outperformer, CF Web 3.0 Smart Contract Platforms Index (up +69.48% YTD) fell -1.11% for the week.
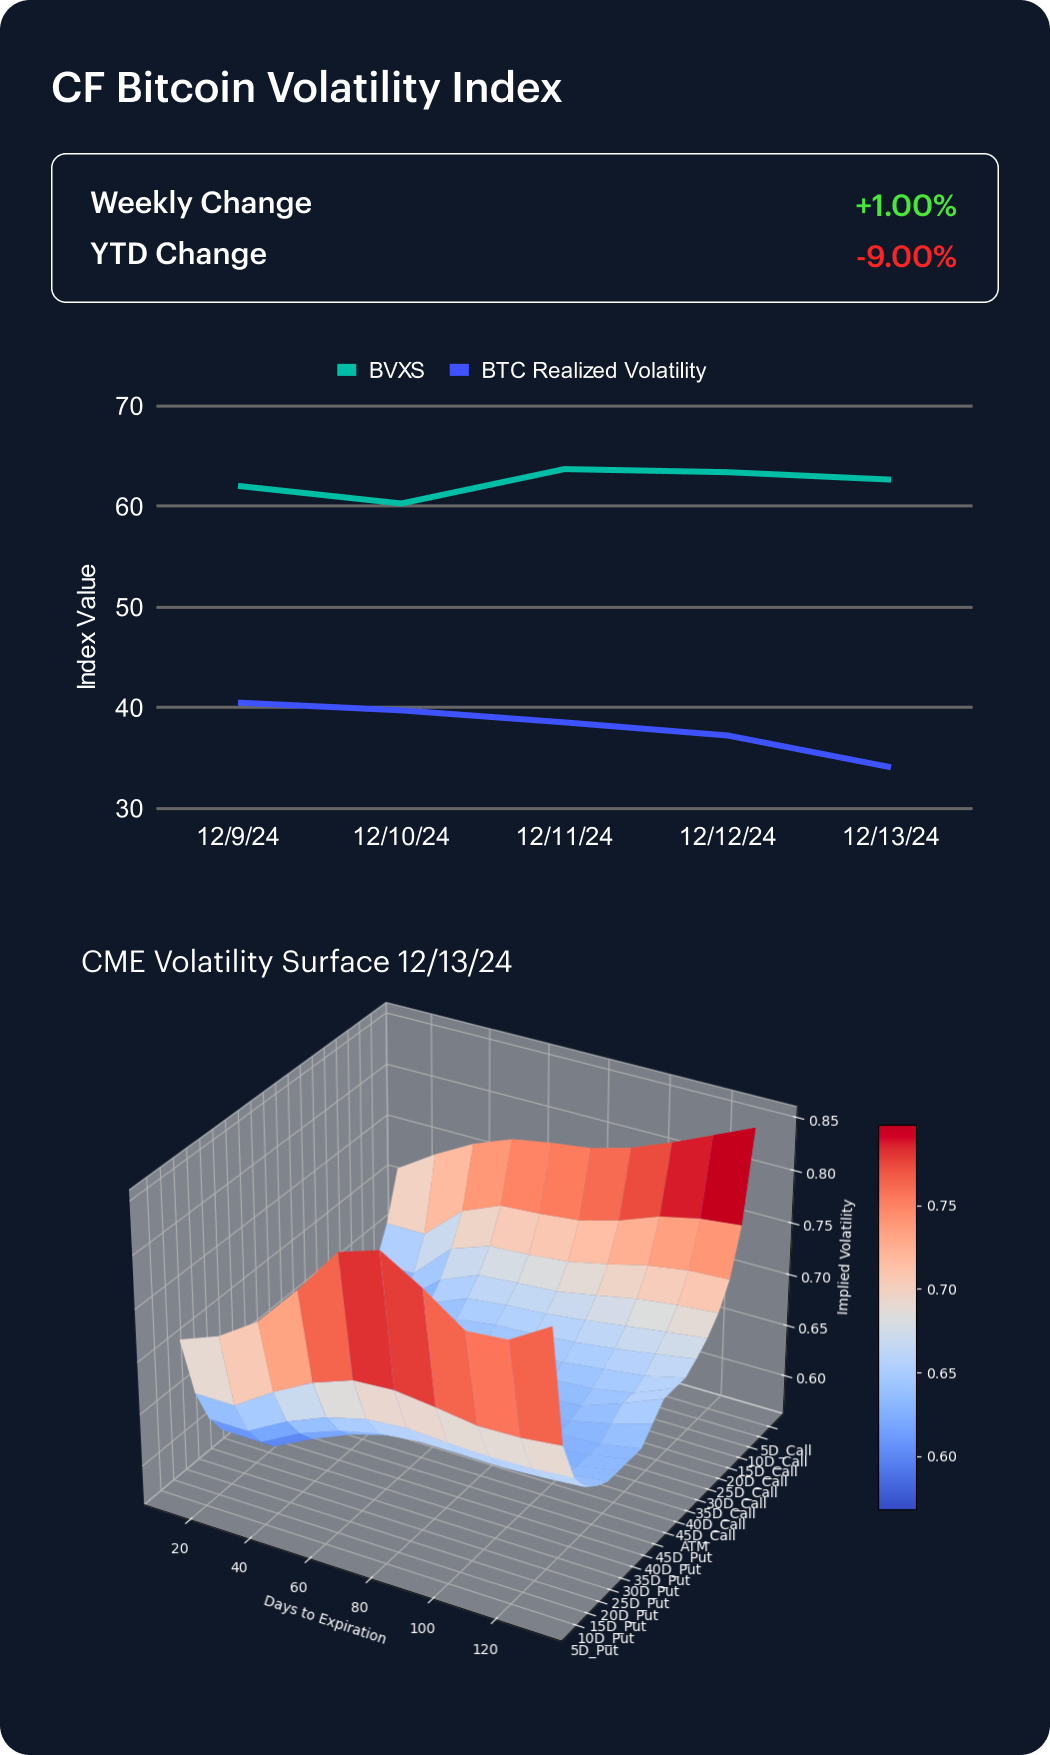
A mild rise of the CF Bitcoin Volatility Index Settlement Rate (BVXS) of 1% over the week appears immaterial for now, given the recent declining trend in CME Bitcoin implied volatility. This fall appears to be corroborated to a degree by the trend of historical volatility continuing to head visibly lower over the week, looking at the trend line for this metric that’s now been added to the chart in this section. The year-to-date BVXS change remains relatively balanced, now just 9.00% lower.
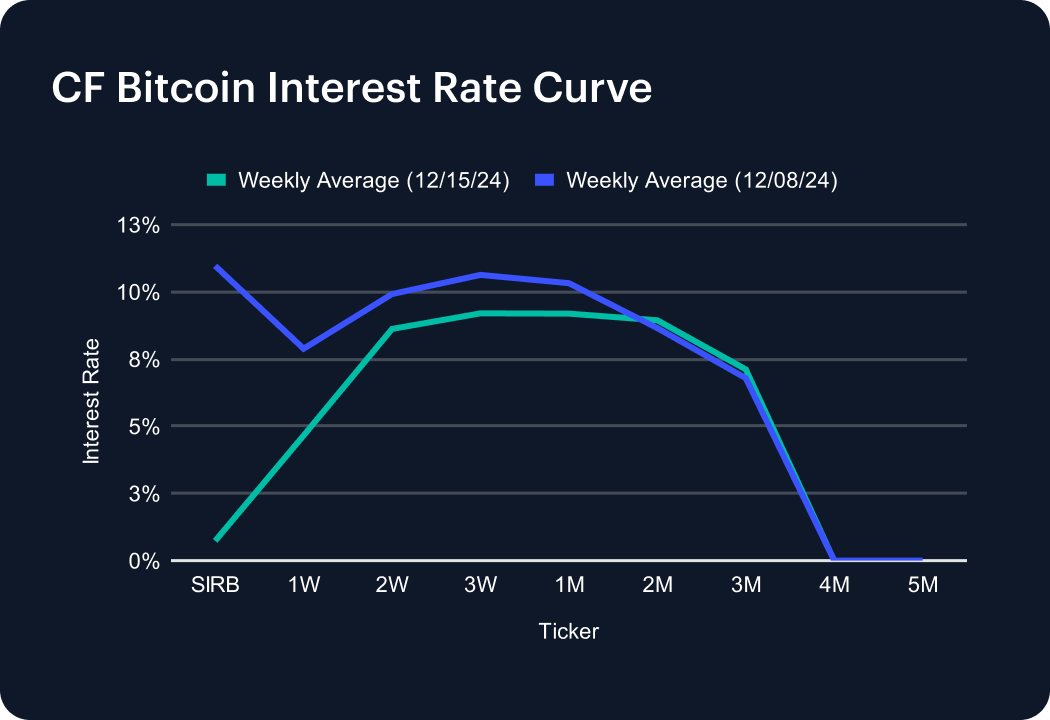
A significant contraction of the session rate from 10.97% to just 0.73% was among the most eye-catching moves across the structure over the week. The Fixed Maturity Futures Front Contract Annualised Basis model on our CF BIRC web page showed the CME Bitcoin basis moving back out towards long-run average highs; if not to its highest of the year, touching approximately 19.44% on Monday, December 16th. The declining trend in the CF BIRC structure was evident up the middle of the curve, where the 1-Month tenor ticked 0.29 of a percentage point higher to 8.94%. Aside from the 3.22 point slide at the 1-Week tenor, rates from 2-Week through 2-Month once again fell modestly; in the order of 1-2 points apiece, while the 3-Month edged 0.33 of a point higher. There were again no readings at the 4-Month and 5-Month tenors.
The information contained within is for educational and informational purposes ONLY. It is not intended nor should it be considered an invitation or inducement to buy or sell any of the underlying instruments cited including but not limited to cryptoassets, financial instruments or any instruments that reference any index provided by CF Benchmarks Ltd. This communication is not intended to persuade or incite you to buy or sell security or securities noted within. Any commentary provided is the opinion of the author and should not be considered a personalised recommendation. Please contact your financial adviser or professional before making an investment decision.
Note: Some of the underlying instruments cited within this material may be restricted to certain customer categories in certain jurisdictions.
Changes to the Token Market Price Benchmarks Series - Market Prices – 21 July 2026
The Administrator has confirmed changes to the Token Market Price Family for the period 14 July 2026 to 21 July 2026.

CF Benchmarks
Softer CPI Reprices July Hike Risk & Lifts Digital Assets
Digital assets extended their recovery over the past week as cooler US inflation prints repriced Fed expectations; the bid was broad across the large cap indices, growth factor leadership returned, stablecoin funding repriced lower, and stress stayed isolated in names hit by token-specific news.
Mark Pilipczuk
Notice of the Demising of CF Dai-Dollar Settlement Price and Spot Rate
The Administrator announces that it will demise the CF Dai-Dollar Settlement Price (DAIUSD_RR) and CF Dai-Dollar Spot Rate (DAIUSD_RTI) which are members of the CF Digital Asset Index Family.
CF Benchmarks
By clicking Accept, you consent to CF Benchmarks's use of cookies.
Visit Cookie Settings to learn how CF Benchmarks uses cookies and to adjust your preferences.