
Aug 18, 2025
Weekly Index Highlights, August 18, 2025
Market Performance Update
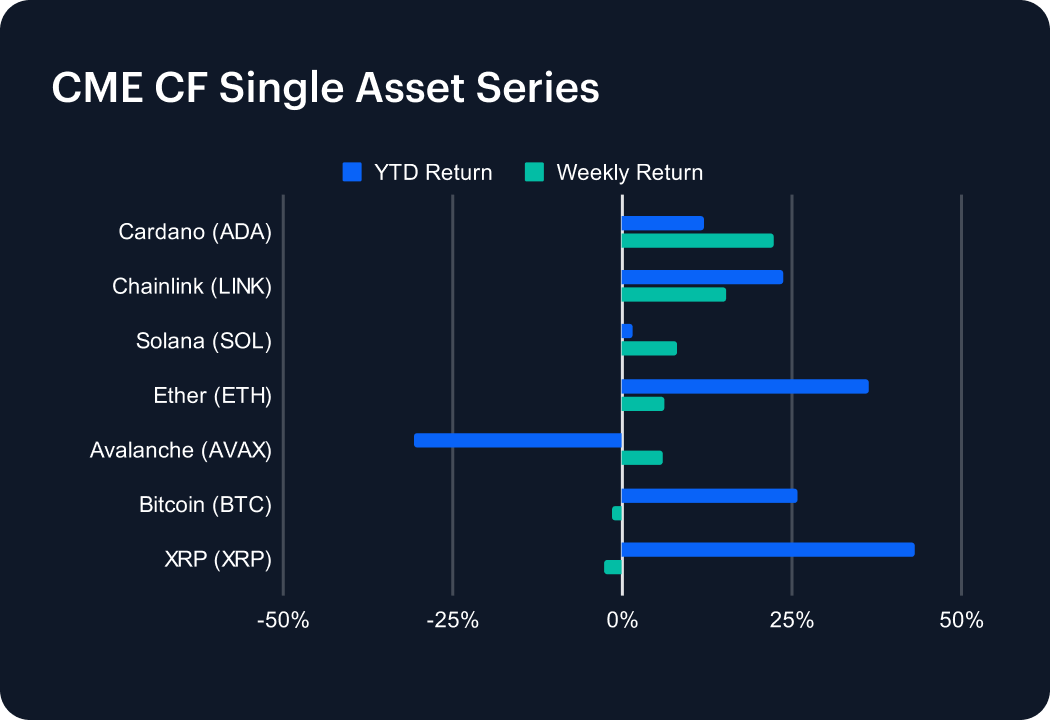
In another week of sharp moves, altcoins led the charge with outsized gains. Cardano stole the spotlight, soaring 22.26% to lift its year-to-date return into positive territory at 12.05%. Chainlink also impressed, adding 15.22% for a cumulative 23.81% gain in 2025. Solana climbed 8.00%, turning its performance marginally positive at 1.59% YTD, while Ether advanced 6.15%, cementing its leadership among majors with a robust 36.34% gain this year. Avalanche ticked higher by 6.03%, but remains the weakest link with a steep –30.84% drawdown YTD. On the downside, large-cap tokens lagged: Bitcoin slipped 1.45%, trimming its annual return to 25.93%, while XRP dropped 2.80%, though it still boasts a commanding 43.12% rally in 2025.
Sector Analysis
The DACS categories stayed broadly constructive, with standout gains across Settlement and Infrastructure. Programmable Settlement stole the spotlight as Cardano (ADA) surged 22.26%, quintupling the cohort’s 4.83% average, while Solana (8.00%) and Ethereum (6.15%) added depth to the rally. Specialized platform Sei (SEI) also impressed, climbing 12.83%. Infrastructure saw fireworks from Skale (SKL), which rocketed 66.67% versus a 6.54% sub-category average, while Arbitrum (ARB) followed with 18.44%. In Services, oracle leader Chainlink (LINK) vaulted 15.22%, far outpacing the 2.10% Utilities benchmark. Culture’s advance was steadier, with BAT (+8.62%) and IMX (+3.17%) topping the sub-category. Laggards included meme coins BONK (-6.63%) and PEPE (-3.45%), alongside Infrastructure stragglers HNT (-8.28%) and ZRO (-7.86%), underscoring selective weakness.
CF Staking Series
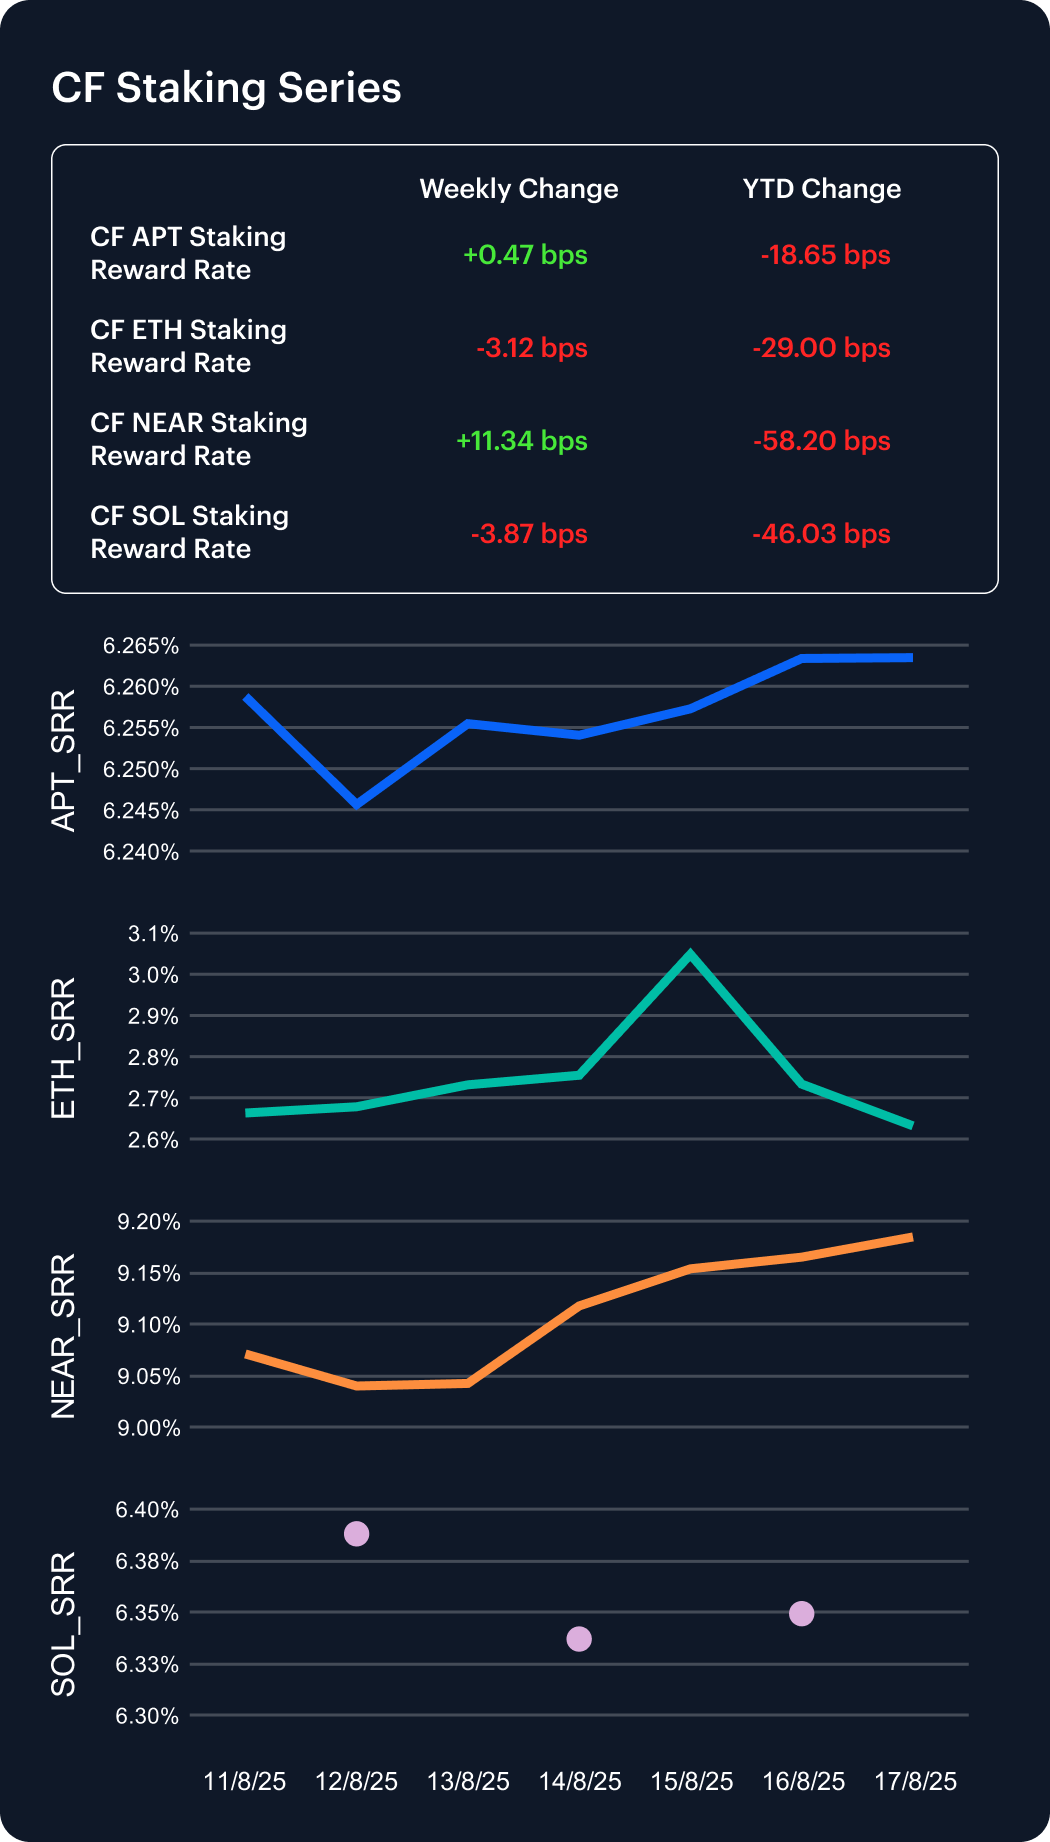
Staking rewards posted another mixed week as network dynamics and market flows drove dispersion. NEAR led the field, with its annualized reward rate climbing 11.34 bps to 9.18%, though it remains down 58 bps YTD. Aptos stayed the most stable, inching up 0.47 bps to 6.26%, leaving its year-to-date decline at just –18.65 bps (–2.89%). By contrast, Ethereum slipped 3.12 bps to 2.63%, extending its 2025 loss to –29 bps (–9.92%), the sharpest among majors. Solana eased 3.87 bps to 6.35%, with its annualized reward rate still off –46 bps YTD. These divergences highlight shifting validator economics, evolving inflation schedules, and varying levels of investor conviction across Proof-of-Stake ecosystems.
Market Cap Index Performance
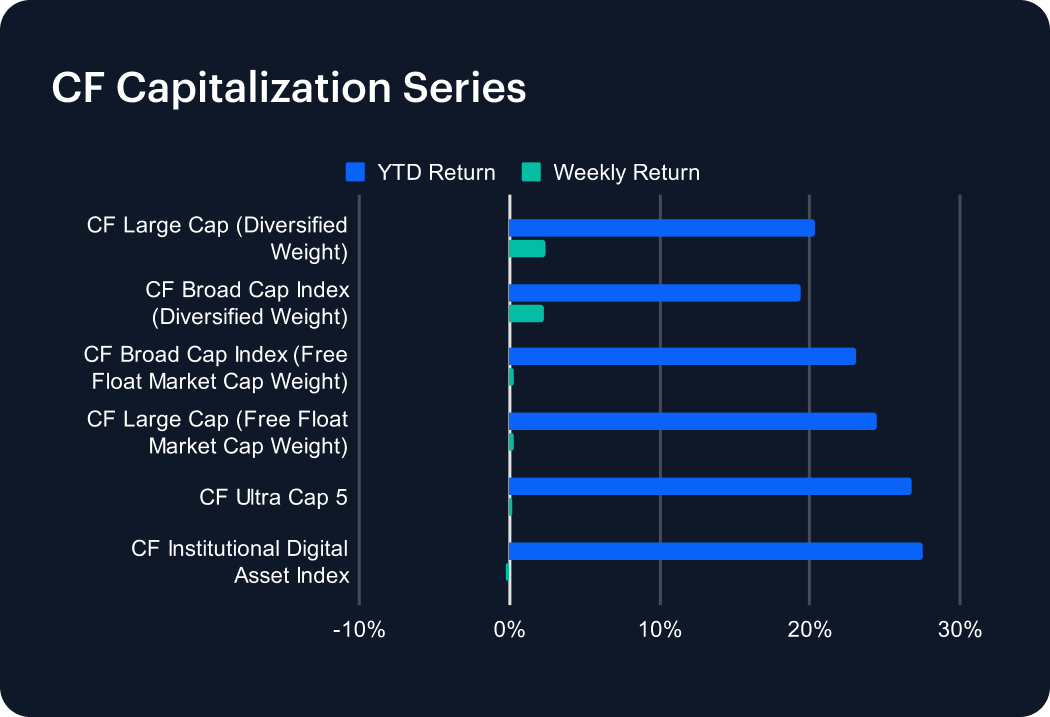
Last week saw momentum cool in the CF Capitalization Series, though the diversified-weighted indices still edged higher. The CF Large Cap (Diversified Weight) led with a 2.39% gain, lifting its year-to-date return to 20.35%, while the CF Broad Cap (Diversified Weight) added 2.27%, bringing its advance to 19.38%. Free-float benchmarks lagged, with the CF Broad Cap Index up just 0.30% (YTD 23.13%) and the CF Large Cap (Free Float) rising a muted 0.28% (YTD 24.49%). Among flagship gauges, the CF Ultra Cap 5 eked out 0.18%, extending its 2025 return to 26.76%, while the CF Institutional Digital Asset Index slipped 0.21%, though it still tops peers at 27.52% YTD. The week’s moves are consistent with leadership concentration and waning breadth in large-cap digital assets.
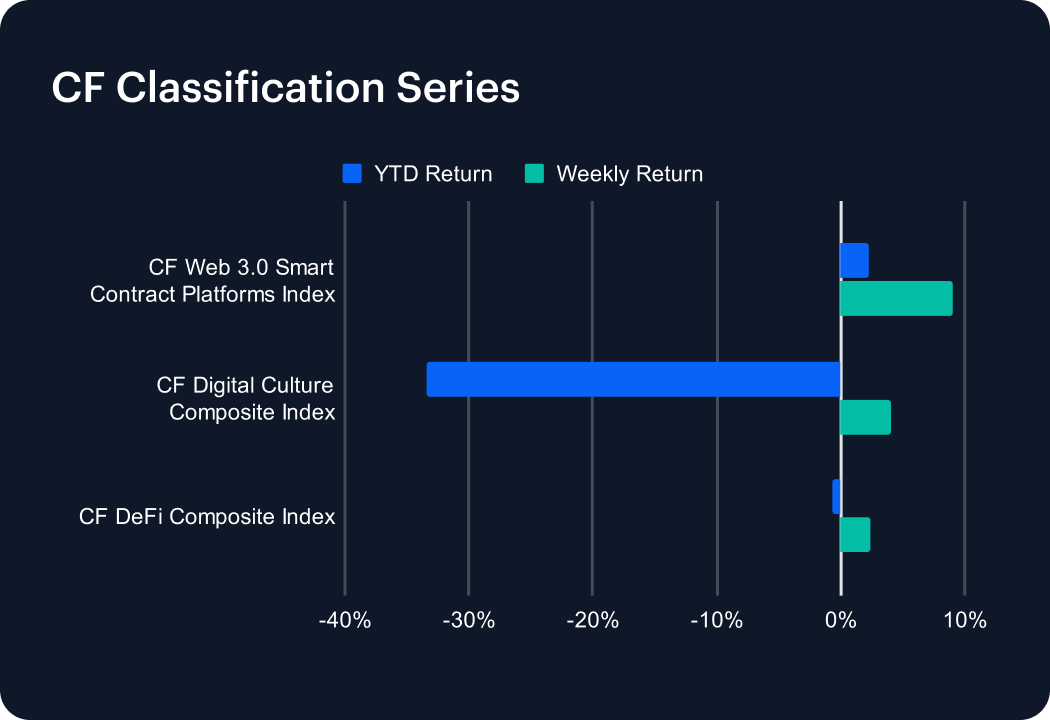
Classification Series Analysis
Last week delivered modest gains across the CF Classification Series, though far from the explosive rebounds seen earlier in the year. The CF Web 3.0 Smart Contract Platforms Index led with a 9.06% advance, pushing its 2025 return into positive territory at 2.26%. The CF Digital Culture Composite Index rose 4.00%, trimming losses but still deeply negative at –33.38% year to date. The CF DeFi Composite Index lagged with a 2.35% uptick, narrowing its deficit to just –0.74%. Despite the week’s improvement, these high-beta themes remain largely below prior peaks, highlighting uneven sentiment across digital asset verticals.
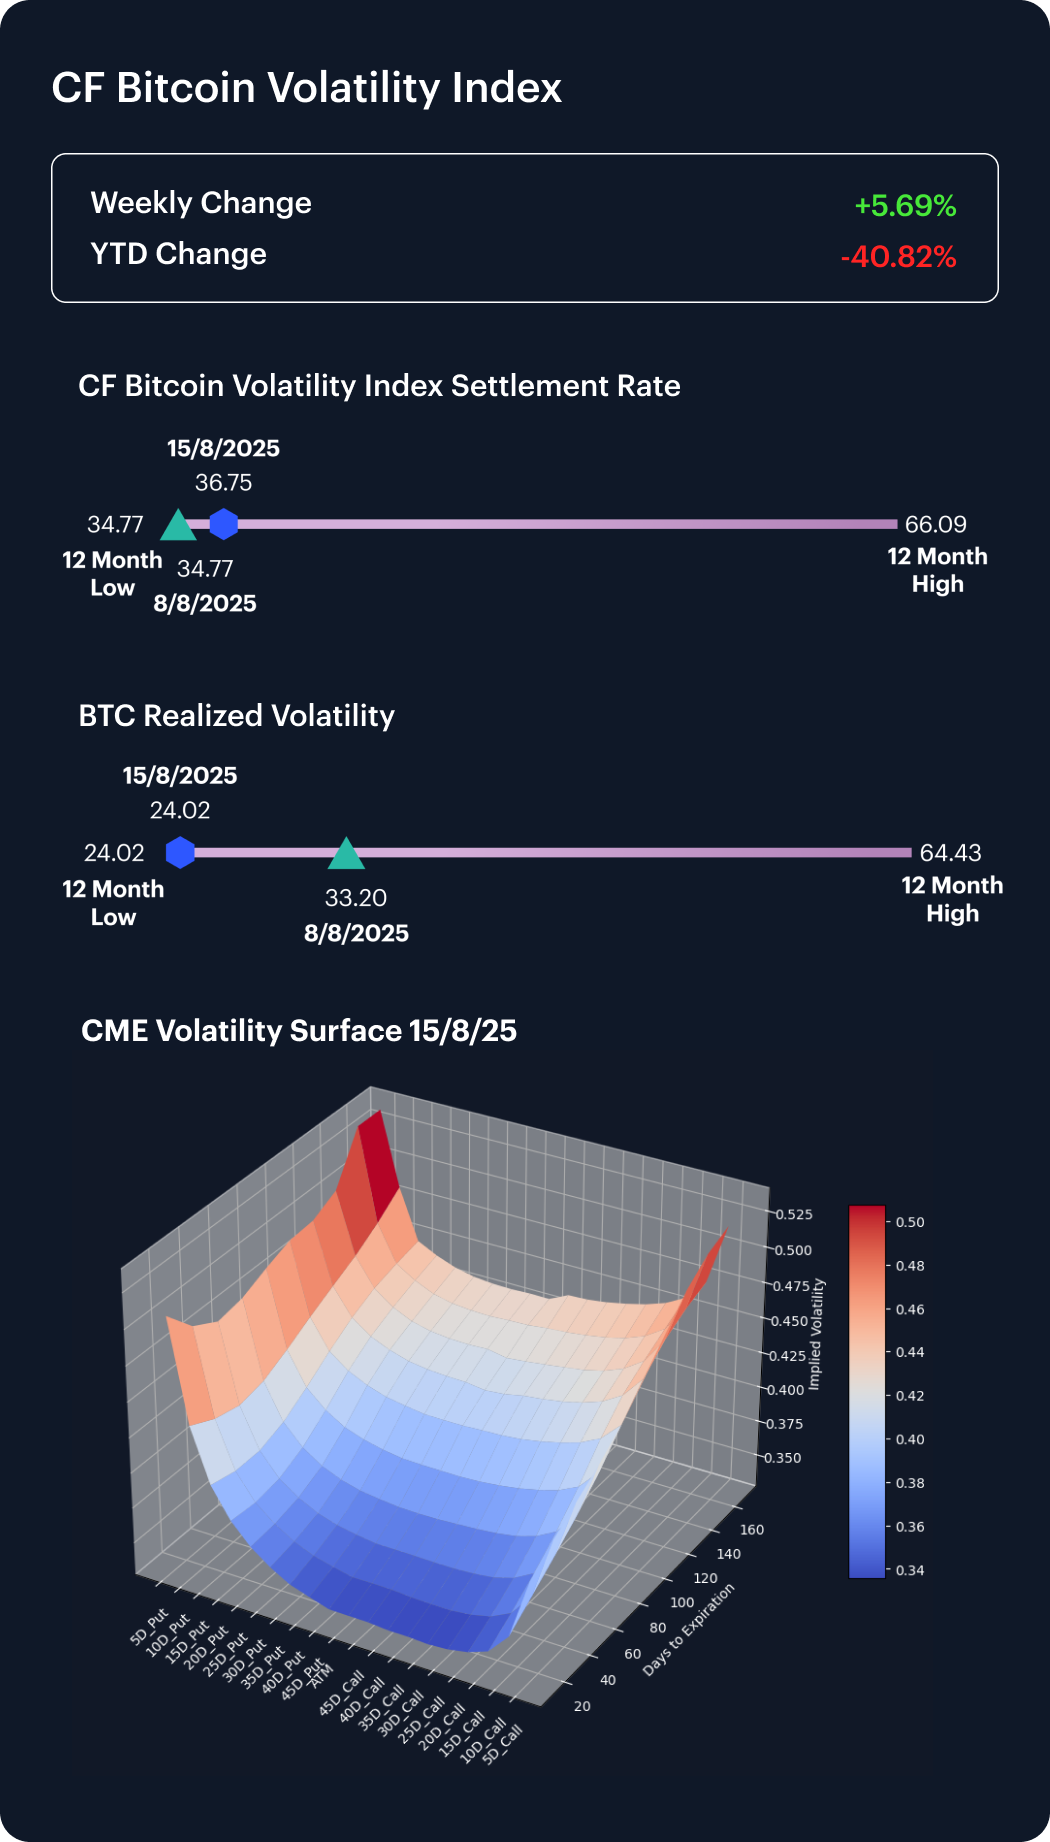
Volatility
The CF Bitcoin Volatility Index Settlement Rate (BVXS) rose 5.69% last week, climbing from a 12-month low of 34.77 to 36.75, though it remains 40.82% below its January level. Realized volatility fell sharply to 24.02 from 33.20 a week earlier, highlighting a disconnect between calmer spot moves and rising implied metrics. On the surface, skew flipped negative, with short-dated put IV climbing and long-dated puts now exceeding calls—a notable inversion that underscores heightened downside hedging demand. Convexity across maturities has also steepened, leaving near-term options soft while longer expiries continue to price in greater tail risk. The evolving structure suggests traders are recalibrating for asymmetric downside even as headline volatility remains historically subdued.
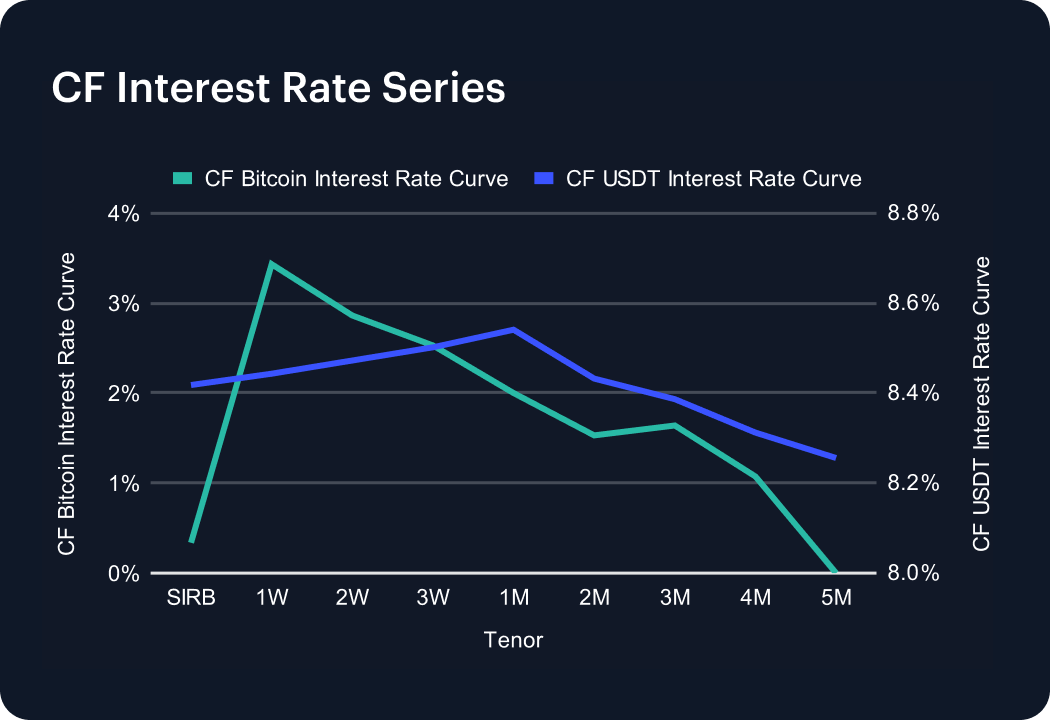
Interest Rate Analysis
The CF USDT Interest Rate Curve held firmly elevated last week, with funding consistently above 8% across maturities. Rates peaked at 8.54% at one month before easing to 8.26% by five months, leaving the curve modestly downward-sloping. Since this benchmark is constructed by applying USDT-USD funding spreads (derived from DeFi lending markets such as Aave and Compound) onto the U.S. dollar curve, the persistence of such high levels underscores structural borrowing demand for USDT liquidity rather than short-term volatility. The slight front-end premium suggests traders are willing to pay up for immediate stablecoin access, while the gentle softening further out implies markets expect conditions to normalize. Compared with the flatlining BTC funding curve, USDT dynamics highlight the differentiated role of stablecoins as leverage collateral.
The information contained within is for educational and informational purposes ONLY. It is not intended nor should it be considered an invitation or inducement to buy or sell any of the underlying instruments cited including but not limited to cryptoassets, financial instruments or any instruments that reference any index provided by CF Benchmarks Ltd. This communication is not intended to persuade or incite you to buy or sell security or securities noted within. Any commentary provided is the opinion of the author and should not be considered a personalised recommendation. Please contact your financial adviser or professional before making an investment decision.
Note: Some of the underlying instruments cited within this material may be restricted to certain customer categories in certain jurisdictions.
Changes to the Token Market Price Benchmarks Series - Market Prices – 21 July 2026
The Administrator has confirmed changes to the Token Market Price Family for the period 14 July 2026 to 21 July 2026.

CF Benchmarks
Softer CPI Reprices July Hike Risk & Lifts Digital Assets
Digital assets extended their recovery over the past week as cooler US inflation prints repriced Fed expectations; the bid was broad across the large cap indices, growth factor leadership returned, stablecoin funding repriced lower, and stress stayed isolated in names hit by token-specific news.
Mark Pilipczuk
Notice of the Demising of CF Dai-Dollar Settlement Price and Spot Rate
The Administrator announces that it will demise the CF Dai-Dollar Settlement Price (DAIUSD_RR) and CF Dai-Dollar Spot Rate (DAIUSD_RTI) which are members of the CF Digital Asset Index Family.
CF Benchmarks
By clicking Accept, you consent to CF Benchmarks's use of cookies.
Visit Cookie Settings to learn how CF Benchmarks uses cookies and to adjust your preferences.