
Apr 20, 2026
Weekly Index Highlights, April, 20, 2026
Market Performance Update
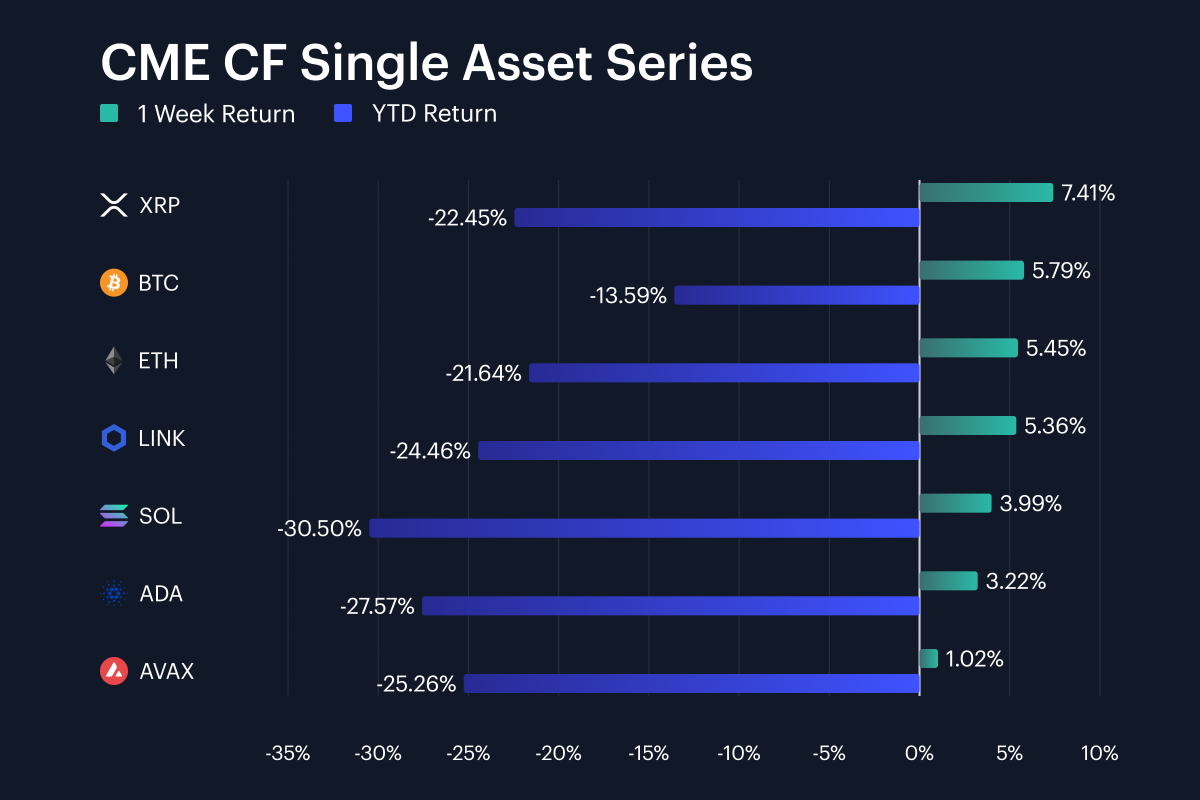
Digital assets rebounded over the recent week, though the backdrop of still-substantial year-to-date (YTD) drawdowns implies markets remain cautious of any full-blown recovery of sentiment, particularly as geopolitical conditions remain uncertain. XRP led the single-asset set with a 7.4% week-on-week (w/w) gain, while Bitcoin rose 5.8% and Ether 5.5%. Chainlink added 5.4%, Solana 4.0% and Cardano 3.2%, while Avalanche trailed at +1.0%. The weekly range across the basket was therefore +1.0% to +7.4%. Even so, every asset remained negative YTD, from Bitcoin at -13.6% to Solana at -30.5%; with Ether at -21.6%, XRP at -22.4% and Avalanche at -25.3%. The week did deliver a cross-asset bounce, with all seven names up between 1.0% and 7.4% w/w, but the move still reads more like a retracement inside a market where the YTD band remains -30.5% to -13.6% than the beginning of confirmed bull. Constructively, the spread from XRP at +7.4% to Avalanche at +1.0% was 6.40 percentage points (pp), providing evidence of moderate leadership. Furthermore, no asset in this set fell on the week.
Volatility Analysis
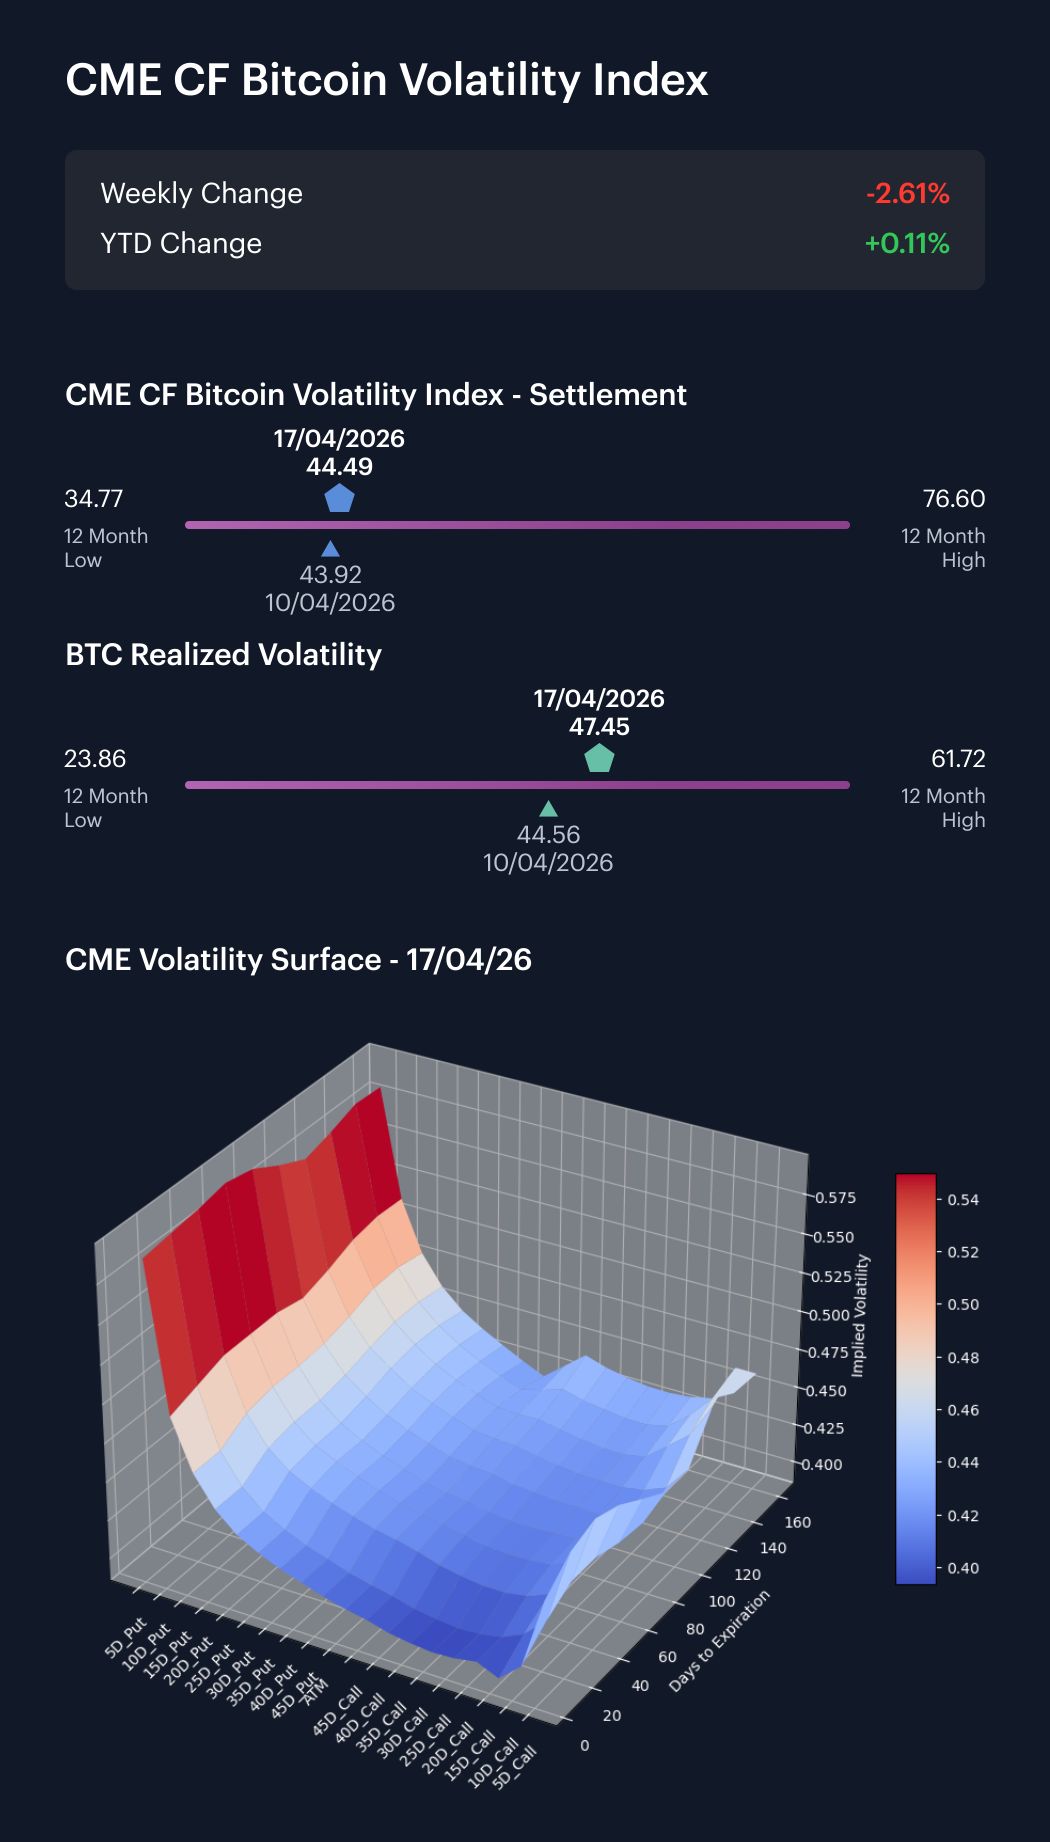
Bitcoin volatility stayed firm, though realized vol. continued to run above our implied vol. gauge. The CME CF Bitcoin Volatility Index – Settlement (BVXS) moved from approximately 43.92 on Friday, April 10th, to 44.49 on Friday, April 17th, a rise of 0.57 vol. points over the business week. Realized volatility rose faster, from around 44.56 to 47.45, a gain of about 2.90 vol. points. By the close on Friday, April 17th, realized sat some 2.96 vol. points above implied, wider than the 0.64 vol.-point gap at the start of that week. It’s worth noting BVXS’s Monday to Friday prints were 45.68, 45.21, 45.32, 44.67 and 44.49, while realized ran between 43.29 and 47.45. The surface was therefore inverted on four sessions of the five-session window, with the closing spread at -2.96 vol. points. The sign change from Monday’s +2.39 vol.-point implied premium to Friday’s -2.96 vol.-point closing spread shows how quickly delivered volatility overtook surface pricing. Likewise with Tuesday to Friday realized prints of 46.74, 46.21, 46.19 and 47.45, against BVXS at 45.21, 45.32, 44.67 and 44.49, delivered volatility ran hotter than implied for four straight sessions, underscoring that sentiment within this risk-trading market showed a tendency toward stability in the recent week.
Market Cap Index Performance
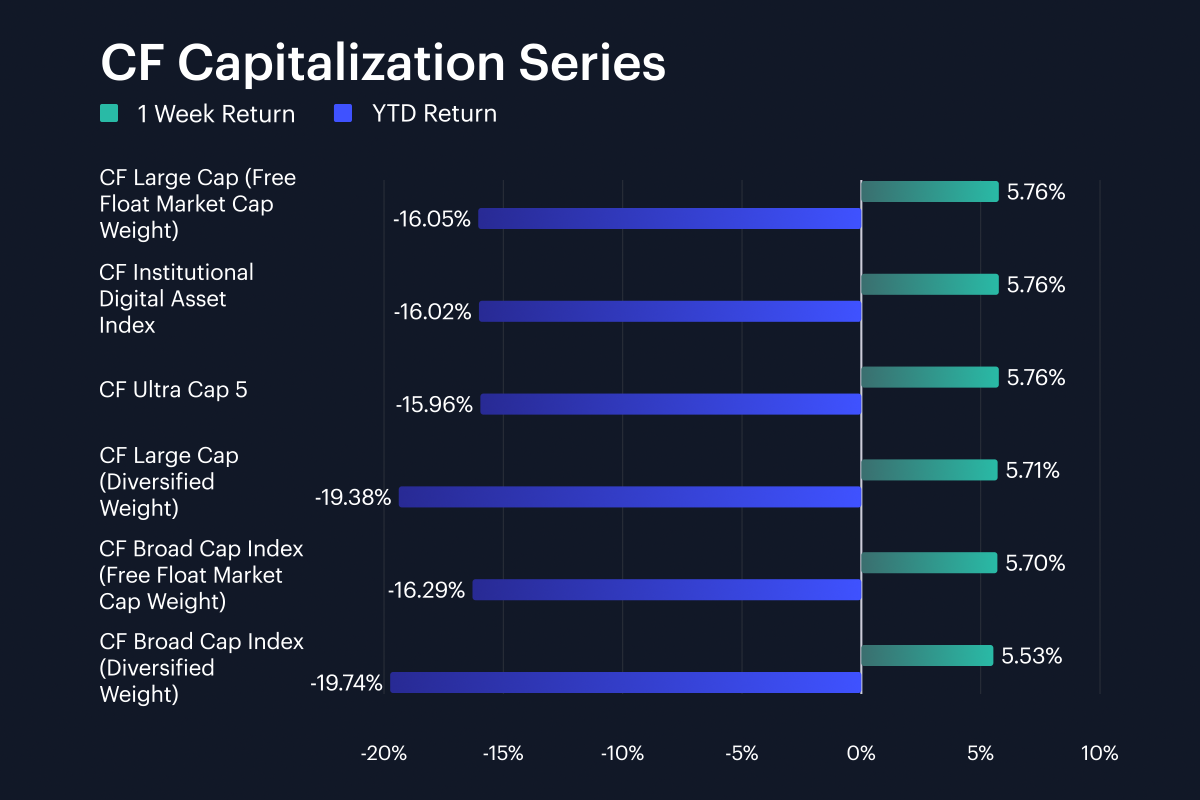
Capitalization benchmarks moved almost in lockstep. CF Ultra Cap 5 rose 5.76% w/w, CF Large Cap (Free Float Market Cap Weight) was +5.76%, and the CF Institutional Digital Asset Index also gained 5.76%. Meanwhile, CF Broad Cap Index (Free Float Market Cap Weight) returned 5.70%, while the diversified-weight large-cap and broad-cap measures gained 5.71% and 5.53%. The full six-index band was just 0.23 pp, from 5.53% to 5.76%, so the minutiae of index construction mattered less than the broad-based participation driving the rebound this week. This means the relative lag in the Broad Cap Index (Diversified Weight) was a nominal one, being only 0.23 pp behind Ultra Cap 5. YTD readings still show the damage underneath the week’s move though: the free-float indices sit at between -16.3% and -16.1% YTD, while the diversified indices are weaker at -19.7% and -19.4%. As well, Large Cap (Diversified Weight) at +5.71% for the week, sat just 0.01 pp above the free-float broad cap. The weekly cluster was therefore intact across weighting schemes on a weekly basis, with signs of relative differentiation only emerging on a look back over the year so far.
Factor Analysis
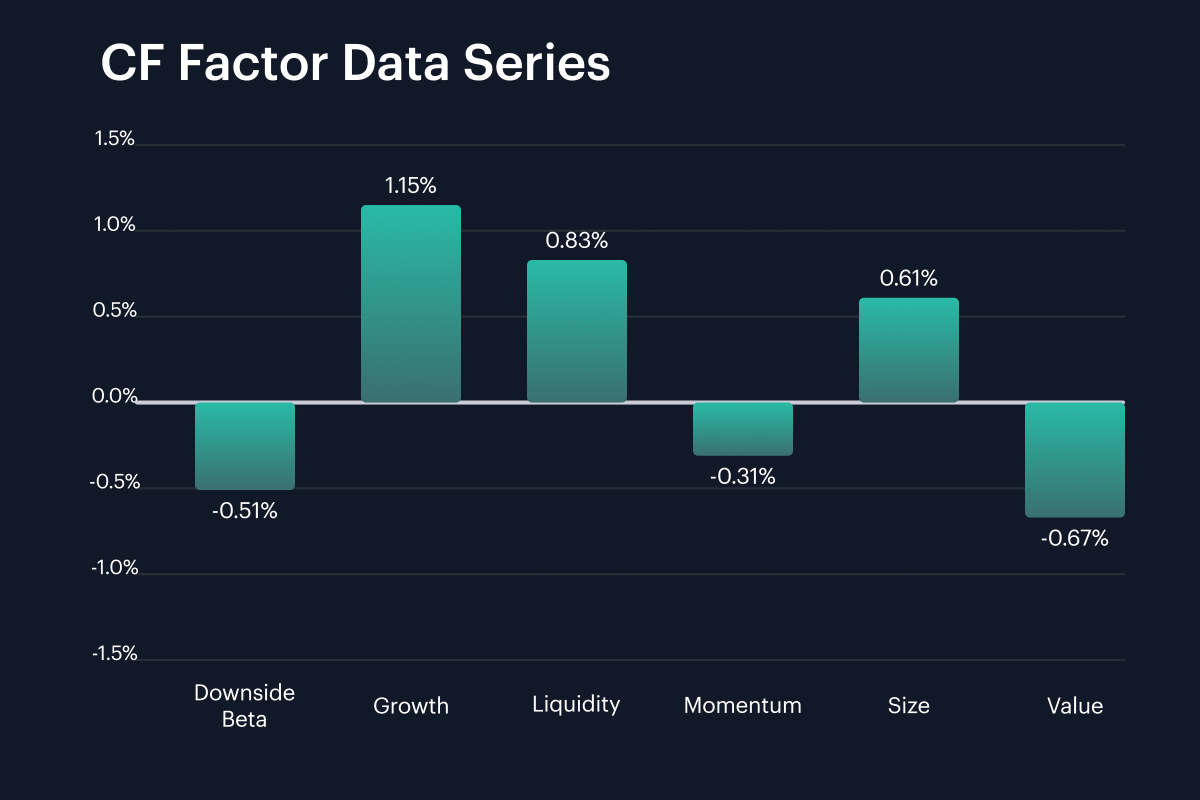
Factor returns improved against the prior week, although the rebound was uneven. Growth moved from -2.07%, in the week ending April 12th, to +1.15% in the week ending April 19th, a swing of 3.22 pp. The negative reading in Downside Beta narrowed from -1.83% to -0.51%, and Liquidity swung positive, moving from -0.49% to 0.83%, while Momentum also improved from -0.92% to -0.31%. Among weakeners, Size eased from 0.89% to 0.61%, and Value ticked from -0.50% to -0.67%. The current cross-factor range therefore ran from -0.67% to 1.15%, against minus 2.07% to plus 0.89% a week earlier. As such, the mix appeared to broadly favor growth and liquidity over the most recent week, with the largest positive swing sitting in Growth at +3.22 pp and the weakest current print still sitting in Value at -0.67%. Three of the six factors finished positive, at 1.15% for Growth, 0.83% for Liquidity and 0.61% for Size, while the other three stayed below zero.
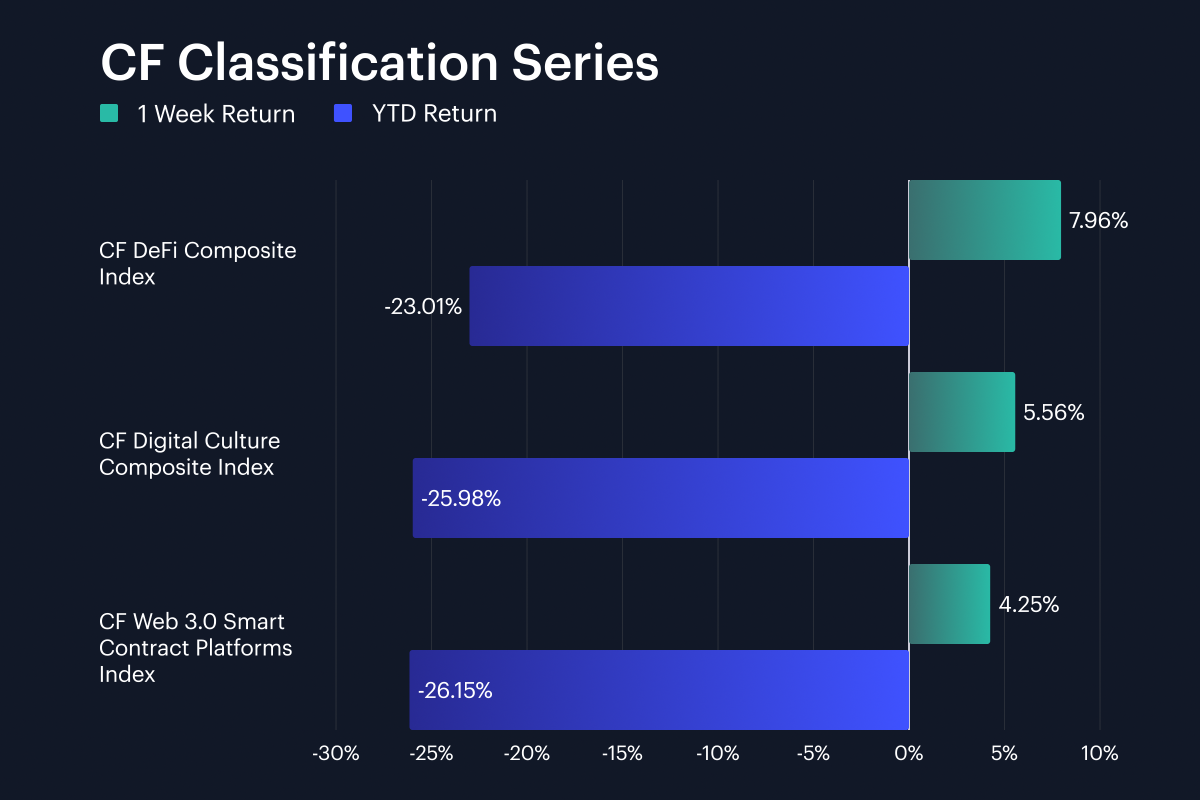
Classification Series Analysis
Across the CF Classification Series, the best weekly return came from the CF DeFi Composite Index at +7.96% w/w, followed by the CF Digital Culture Composite Index at +5.56% and the CF Web 3.0 Smart Contract Platforms Index at +4.25%. The spread from first to third was 3.71 pp. YTD, all three themes remain underwater, with DeFi at -23.0%, Digital Culture at -26.0% and the CF Web 3.0 Smart Contract Platforms Index at -26.2%. The week therefore brought a reopening of risk appetite inside the classification set, but the move looks selective and application-heavy: DeFi outperformed the Web 3.0 gauge by 3.71 pp, while Digital Culture still beat the platforms sleeve by 1.31 pp. Even after this week’s gains, no individual basket has recovered more than about a quarter of its YTD drawdown, with the YTD band still running from -26.2% to -23.0%. Meanwhile, Digital Culture’s 5.56% gain also sat 2.40 pp below DeFi, which keeps leadership concentrated in a single sleeve.
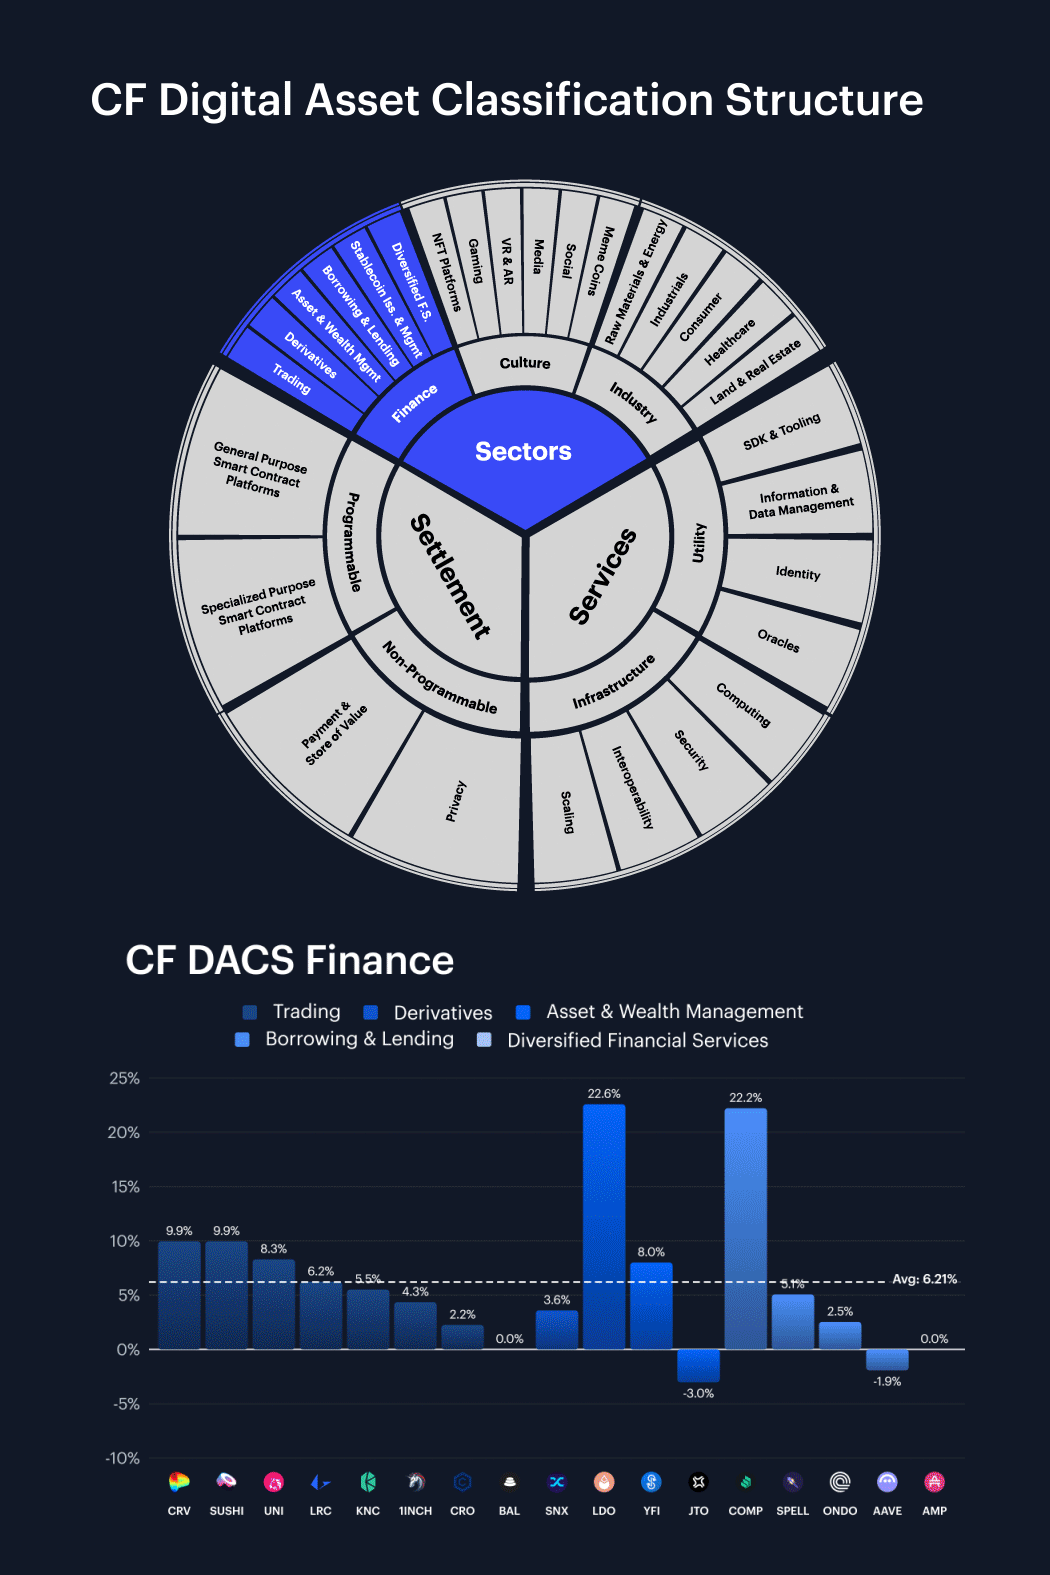
Sector Analysis
Across the top-level sleeves (Sub-Categories) denoted by our CF Digital Asset Classification Structure (CF DACS) taxonomy, Culture led with an average weekly return of 7.86%, while Programmable’s average lagged at 4.82%. That left the six-sleeve range at +4.82% to +7.86%, a dispersion of 3.04 pp. Culture drew support from APE at +19.7%, IMX at +12.0% and PRIME at +11.4%. Still, Programmable also contained strong pockets, with INJ at +13.0% and APT at +12.2%. However, NEAR at -0.7% and AVAX, with a relatively contained +1.0%, held the sleeve closer to the lower end. Finance also printed positive, +6.21%, aided by LDO at +22.6% and COMP at +22.2%, while being offset by JTO at -3.0% and AAVE at -1.9%. Infrastructure’s +5.63% looked calmer at the average level, yet the sleeve still spanned from TIA at +32.5% to ZRO at -14.7%, a gap of 47.18 pp. Looking at two key sleeve-average improvements then, Culture swung from -2.24% to 7.86%, while Programmable advanced from -2.42% to 4.82%, emblematic of the palpable recovery of overall sentiment.
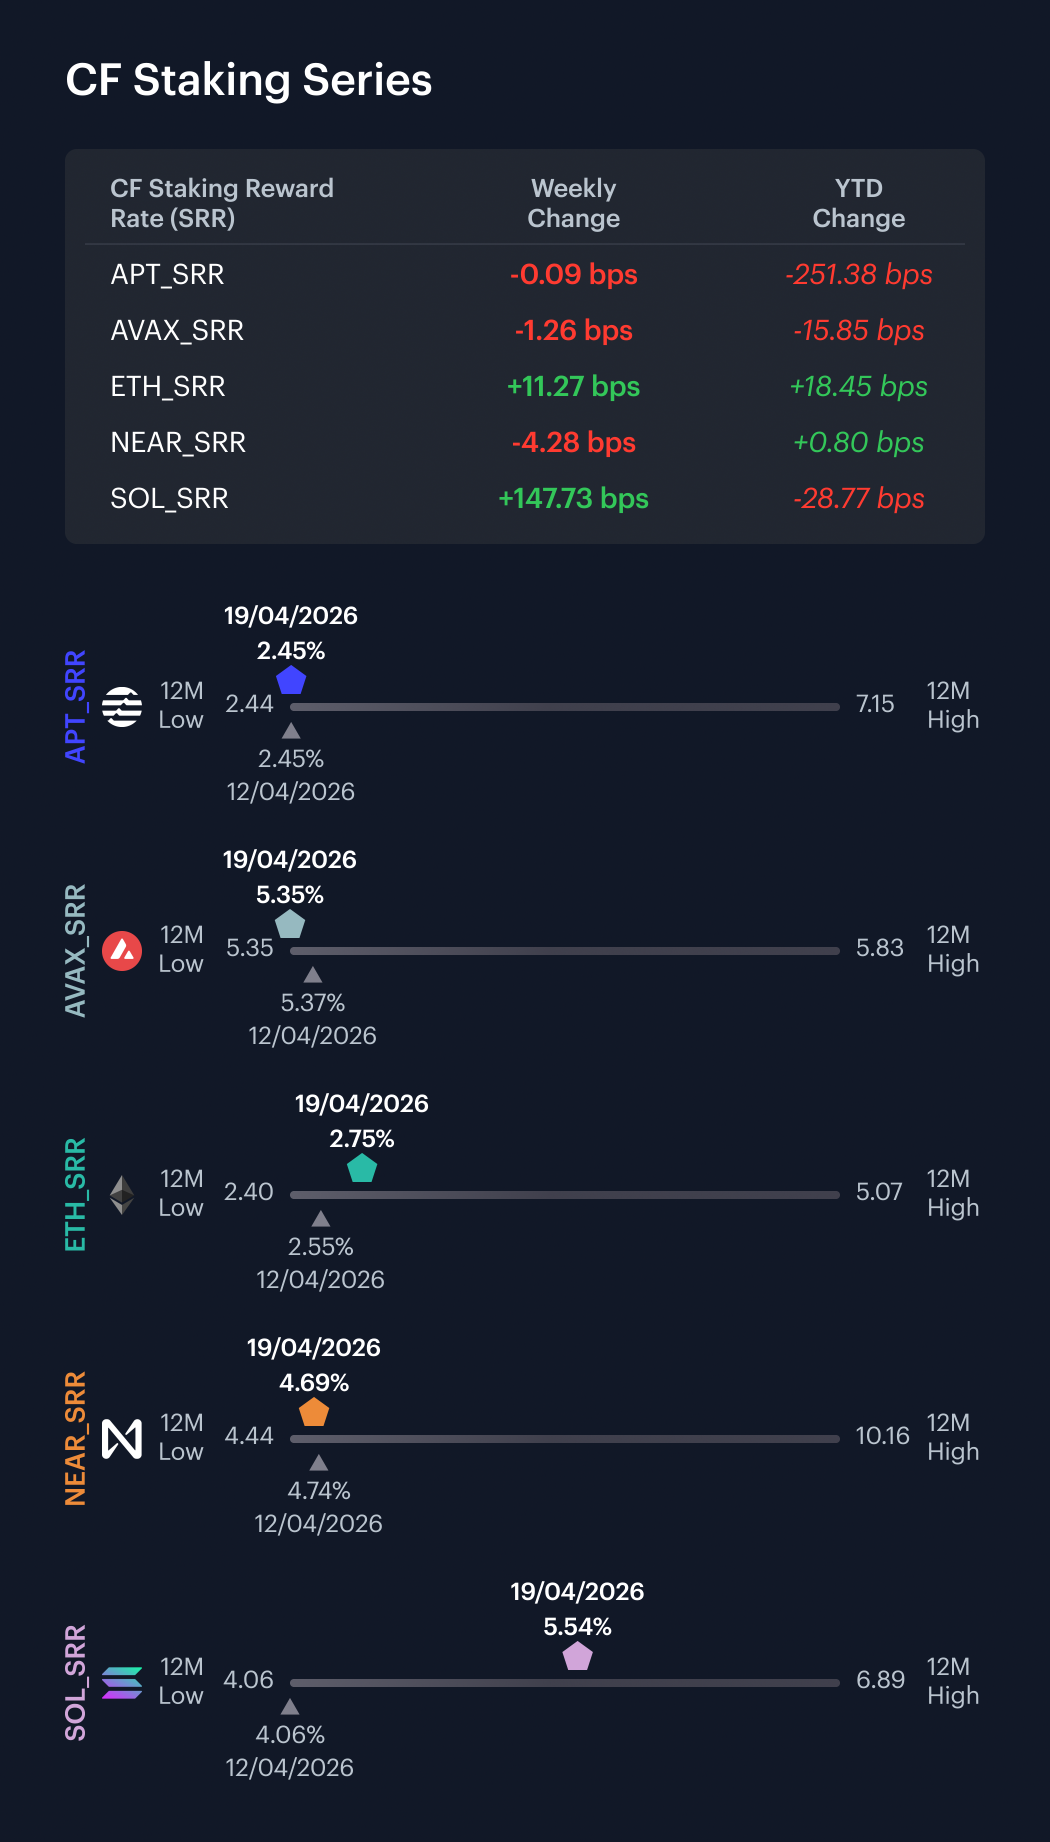
CF Staking Series
It was a relatively steady week within the CF Staking Series, though SOL was a relative outlier. Across the seven-session stretch of April 13th through April 19th, APT Staking returned -0.04% w/w, with its reward rate moving from 2.4500% to 2.4491%, a change of -0.09 bps. AVAX Staking returned -0.23% w/w, its reward rate ticking down from 5.3666% to 5.3540%, a change of -1.26 bps. ETH Staking returned 4.27% w/w, as its reward rate moved from 2.6403% to 2.7530%, a rise of 11.27 bps. NEAR Staking returned -0.90%, equating to a reward rate move from 4.7326% to 4.6898%, a change of -4.28 bps. Meanwhile SOL Staking returned 36.39% w/w. Its reward rate moved from 4.0596% to 5.5369%, a rise of 147.73 bps. Excluding SOL, the intra-week reward-rate band ran from -4.28 bps to +11.27 bps, so most of the complex stayed close to flat.
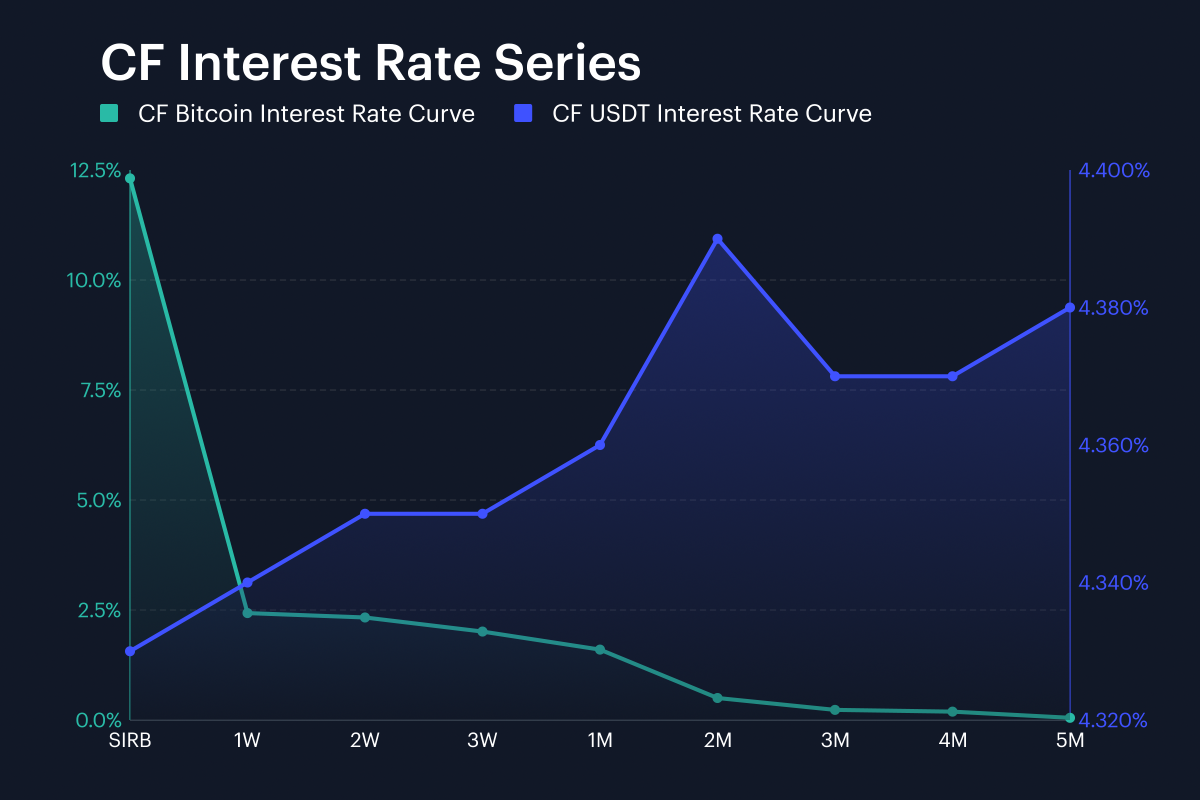
Interest Rate Analysis
Curves moved sharply higher across our CF Bitcoin Classification Structure (CF BIRC) overall, though Bitcoin’s was uneven across tenors. Its session interest rate (SIRB) jumped from 3.67% to 12.31%, a rise of 864.25 bps, though the 1W rate fell from 2.88% to 2.43%, down 45.04 bps; then the 3M tenor moved from 0.06% to 0.23%, up 16.96 bps. Meanwhile, the USDT curve upshift was close to uniform almost point for point: USDT SIRB rose from 2.69% to 4.33%, the 1W tenor went from 2.71% to 4.34%, and 3M from 2.79% to 4.37%, changes of 163.74 bps, 162.81 bps and 158.46 bps. Across both curves, tenor-by-tenor changes ran from -45.04 bps to 864.25 bps. As such, apart from the BTC SIRB jump, the message was a firmer USDT curve and a BTC curve that steepened through the belly, with BTC 2W and 3W up 67.85 bps and 60.78 bps, even as 1W fell. USDT 2W, 3W and 1M also rose 161.72 bps, 160.63 bps and 159.17 bps, which kept the lift tightly clustered beyond the front end.
The information contained within is for educational and informational purposes ONLY. It is not intended nor should it be considered an invitation or inducement to buy or sell any of the underlying instruments cited including but not limited to cryptoassets, financial instruments or any instruments that reference any index provided by CF Benchmarks Ltd. This communication is not intended to persuade or incite you to buy or sell security or securities noted within. Any commentary provided is the opinion of the author and should not be considered a personalised recommendation. Please contact your financial adviser or professional before making an investment decision.
Note: Some of the underlying instruments cited within this material may be restricted to certain customer categories in certain jurisdictions.
Changes to the Token Market Price Benchmarks Series - Market Prices – 21 July 2026
The Administrator has confirmed changes to the Token Market Price Family for the period 14 July 2026 to 21 July 2026.

CF Benchmarks
Softer CPI Reprices July Hike Risk & Lifts Digital Assets
Digital assets extended their recovery over the past week as cooler US inflation prints repriced Fed expectations; the bid was broad across the large cap indices, growth factor leadership returned, stablecoin funding repriced lower, and stress stayed isolated in names hit by token-specific news.
Mark Pilipczuk
Notice of the Demising of CF Dai-Dollar Settlement Price and Spot Rate
The Administrator announces that it will demise the CF Dai-Dollar Settlement Price (DAIUSD_RR) and CF Dai-Dollar Spot Rate (DAIUSD_RTI) which are members of the CF Digital Asset Index Family.
CF Benchmarks
By clicking Accept, you consent to CF Benchmarks's use of cookies.
Visit Cookie Settings to learn how CF Benchmarks uses cookies and to adjust your preferences.