
Apr 13, 2026
Weekly Index Highlights, April, 13, 2026
Market Performance Update
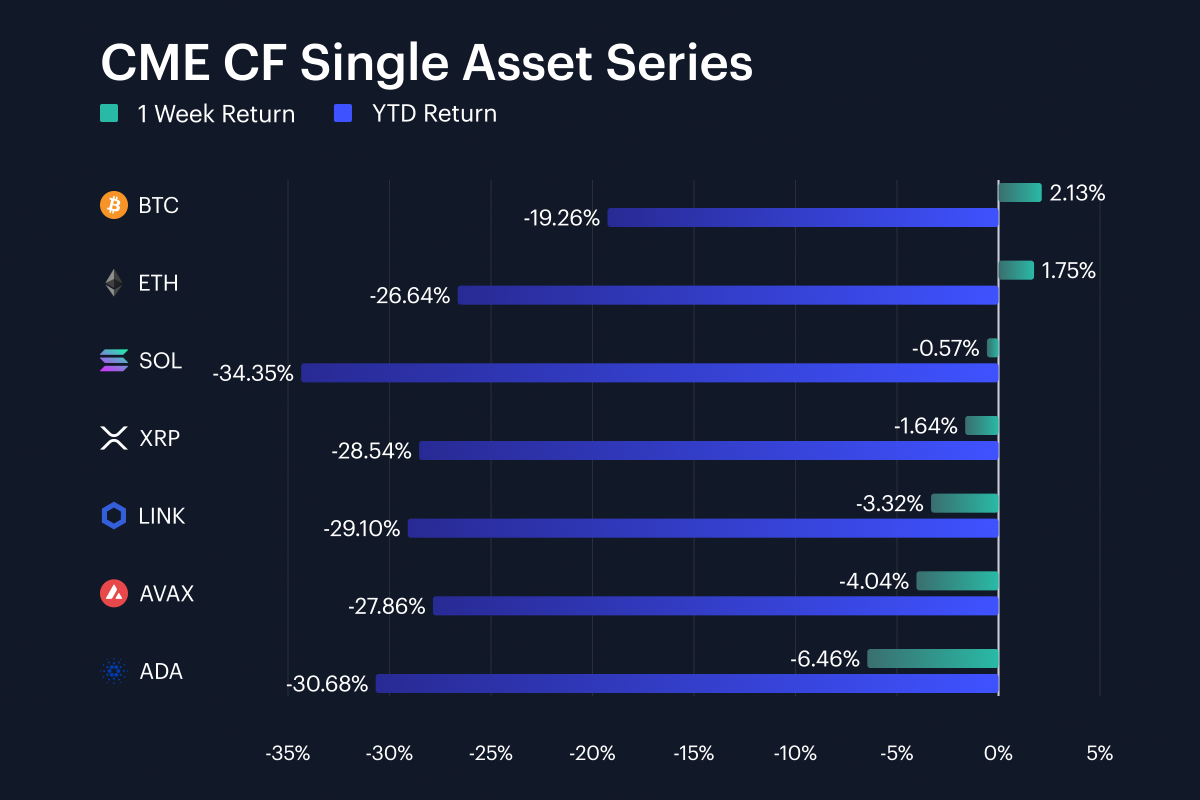
The high-beta crypto asset class reacted to the ongoing ambivalent geopolitical backdrop in appropriately guarded fashion in the week spanning April 6th through April 12th. Bitcoin rose 2.1% week-on-week (w/w) and Ether was up 1.7%, but the rest of the large-cap set failed to keep pace. Solana slipped 0.6%, XRP was -1.6%, Chainlink -3.3%, Avalanche -4.0%, and Cardano -6.5%. Meanwhile, year-to-date losses still ran from 19.3% in BTC to 34.4% in SOL. That left the seven-name basket spread across 8.6 percentage points, from Bitcoin’s gain to Cardano’s decline. Additionally, breadth was weak: only BTC and ETH finished higher, while five of the seven benchmark assets closed lower. The move higher in the headline market was therefore concentrated in the top of the complex. This split also matches the performance of CF Benchmarks’ capitalization index tiers (see the Market Cap Index Performance section below) where the strongest weekly gains again sat with the largest and most liquid exposures. All told, with BTC at +2.1%, ETH at +1.7%, and ADA at -6.5%, the past week reads as selective support for benchmark crypto with insufficient conviction to carry a broad follow-through of alt beta.
Volatility Analysis
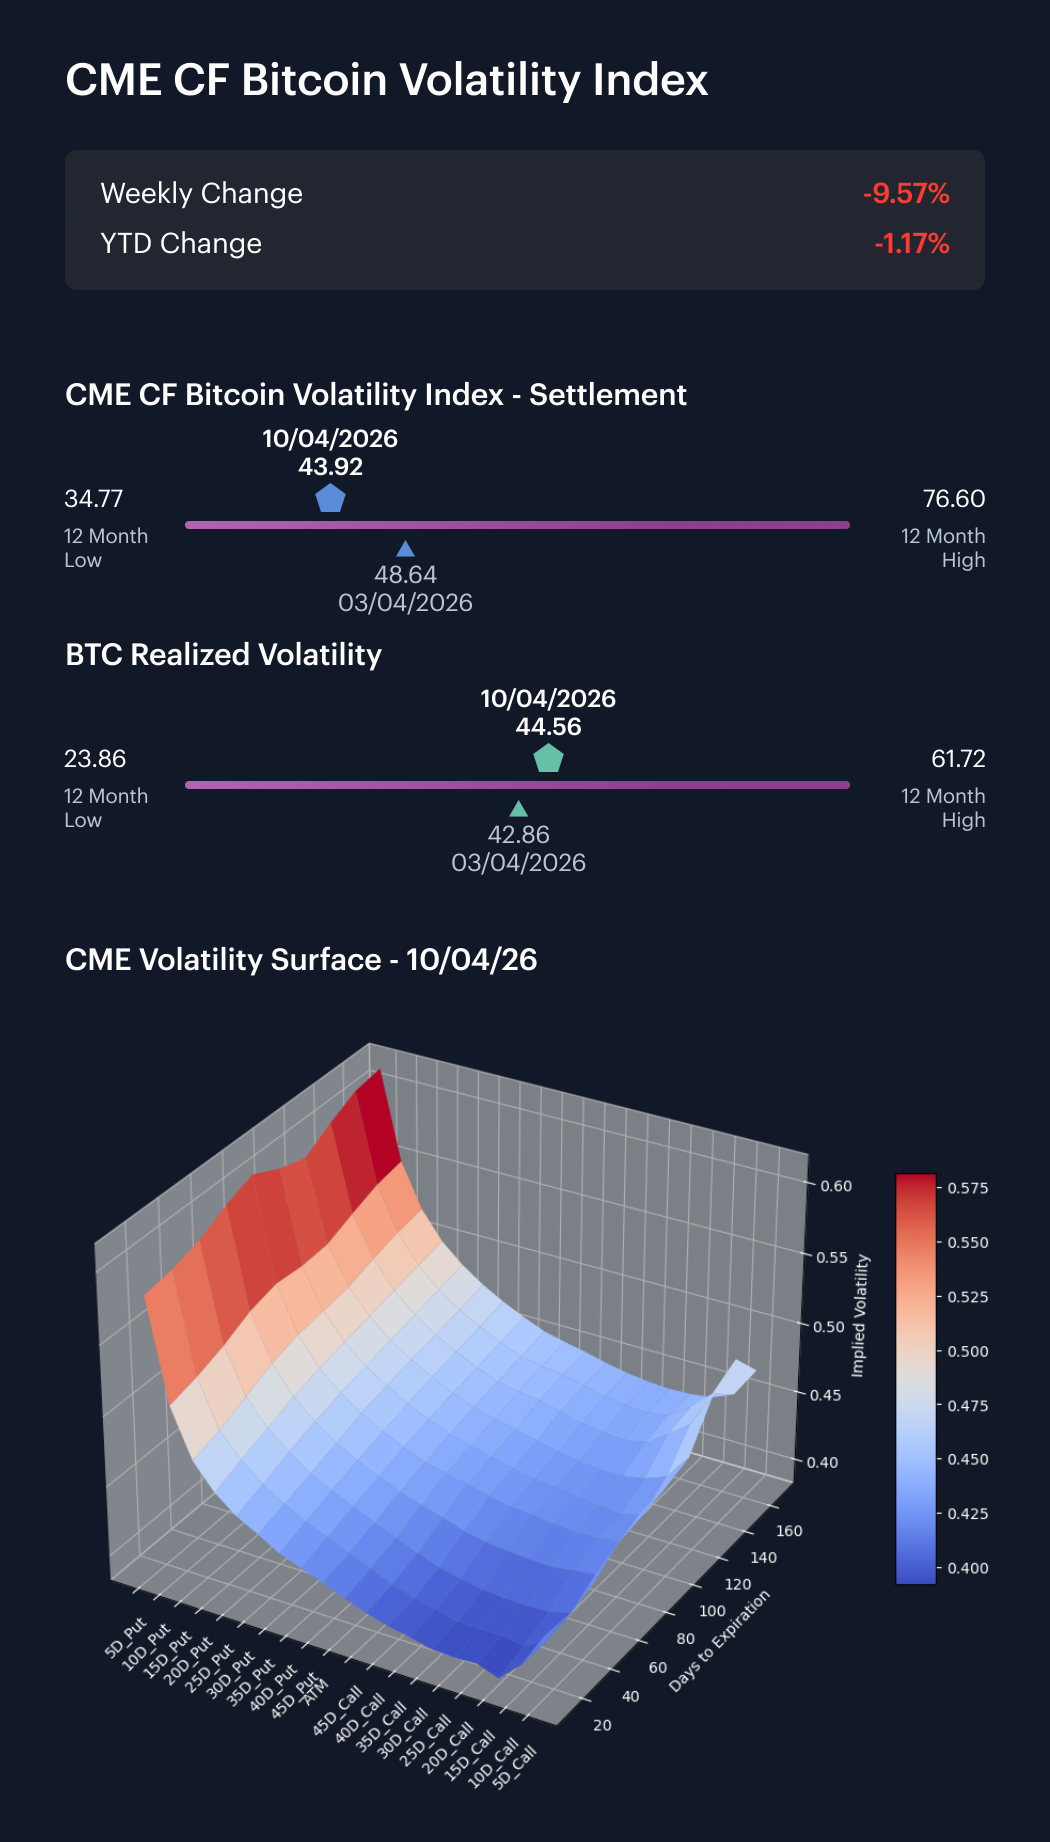
Bitcoin volatility eased in implied terms over the recent business week (April 6th through April 10th) even as realized volatility finished slightly higher. The CME CF Bitcoin Volatility Index – Settlement (BVXS) opened Monday, April 6th, at 48.57, and closed Friday, April 10th, at 43.92, a fall of 4.65 points; having printed 50.05 on the Tuesday. Realized volatility started the week at 42.35, peaked at 45.08, on Wednesday, and ended at 44.56, up 2.20 points from Monday. The spread therefore flipped over the course of the week. Implied started 6.22 points above realized, but by Friday it closed 0.64 points below it. The one-week summary block showed the same move, with BVX down from 48.64 to 43.92 while realized edged up from 42.86 to 44.56. Options pricing continued to sit in the mid-40s though, so this was no collapse in volatility expectations. All in, with realized closing at 44.56 and implied at 43.92, the premium seen a week earlier disappeared by the end of the week.
Market Cap Index Performance
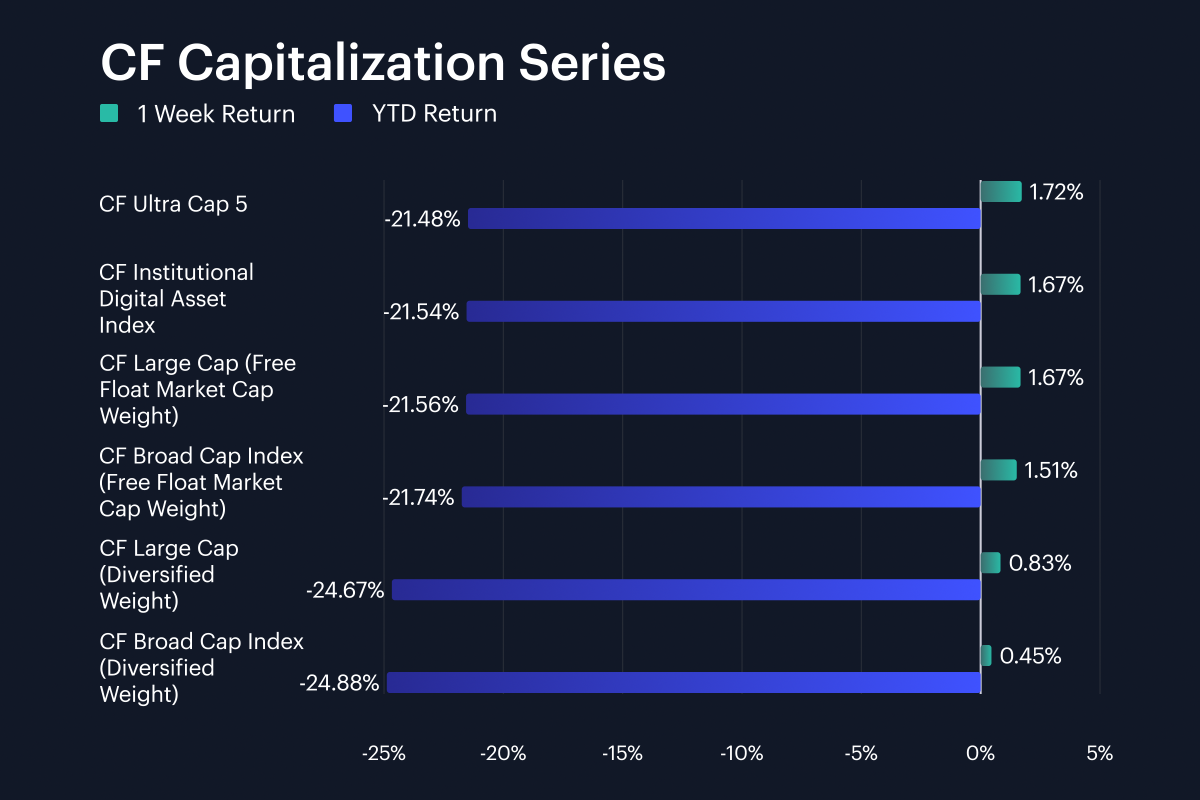
As mentioned earlier, market-cap indices finished the week higher across the board. With the gauge of the very largest-capitalized assets, CF Ultra Cap 5, outperforming though, leadership was concentrated in the biggest names. The CF Ultra Cap 5 rose 1.72% w/w, while the CF Large Cap Free Float index gained 1.67%, and the CF Institutional Digital Asset Index rose 1.67%. The CF Broad Cap Free Float index added 1.51%. Diversified weight indices lagged, with the CF Large Cap Diversified index up 0.83% and the CF Broad Cap Diversified index up 0.45%. That left the capitalization set in a 1.27 percentage point band, from 0.45% to 1.72%, and with year-to-date returns still negative across every index, ranging from -21.5% in Ultra Cap 5 to -24.9% in Broad Cap Diversified. The gap within the weekly band looks indicative. Broad Cap Diversified trailed Ultra Cap 5 by 1.27 percentage points and Broad Cap Free Float by 1.06 percentage points. So, with Broad Cap Diversified up 0.45% against Ultra Cap 5 at +1.72%, the rebound narrative fades as index construction moves away from the largest benchmark constituents toward broader exposure.
Factor Analysis
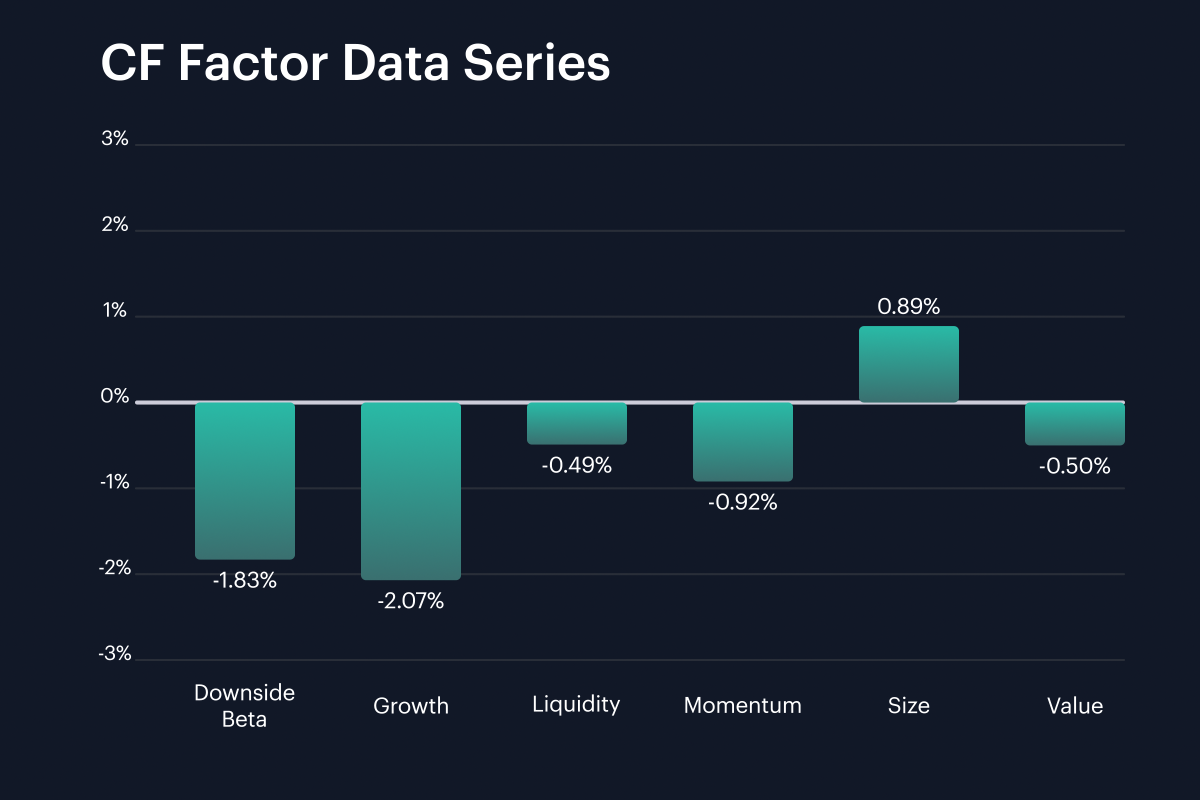
Factor returns lost much of the defensive and liquidity support that had been present a week earlier. Downside Beta moved from its prior 1.18% print to -1.83% in the recent week, a swing of -3.01 percentage points. Liquidity fell from 1.72% to -0.49%, down 2.21 percentage points, while Size stayed positive at 0.89%, but still dropped 2.17 percentage points from the prior week’s 3.06%. Growth narrowed its negative performance only slightly, from -2.22% to -2.07%, while weakness in Momentum deteriorated further, from -0.86% to -0.92%. The negative Value print narrowed more decisively though: from -1.99% to -0.50%. The current week’s factor range therefore ran from -2.07% in Growth to 0.89% in Size. A week ago, Downside Beta, Liquidity, and Size all finished positive. This week, Size was the only factor that remained clearly above zero. With Downside Beta at -1.83%, Liquidity at -0.49%, and only Size positive at 0.89%, the cross-section looked less defensive, less liquidity-led, and more subdued than it had in the prior week.
Classification Series Analysis
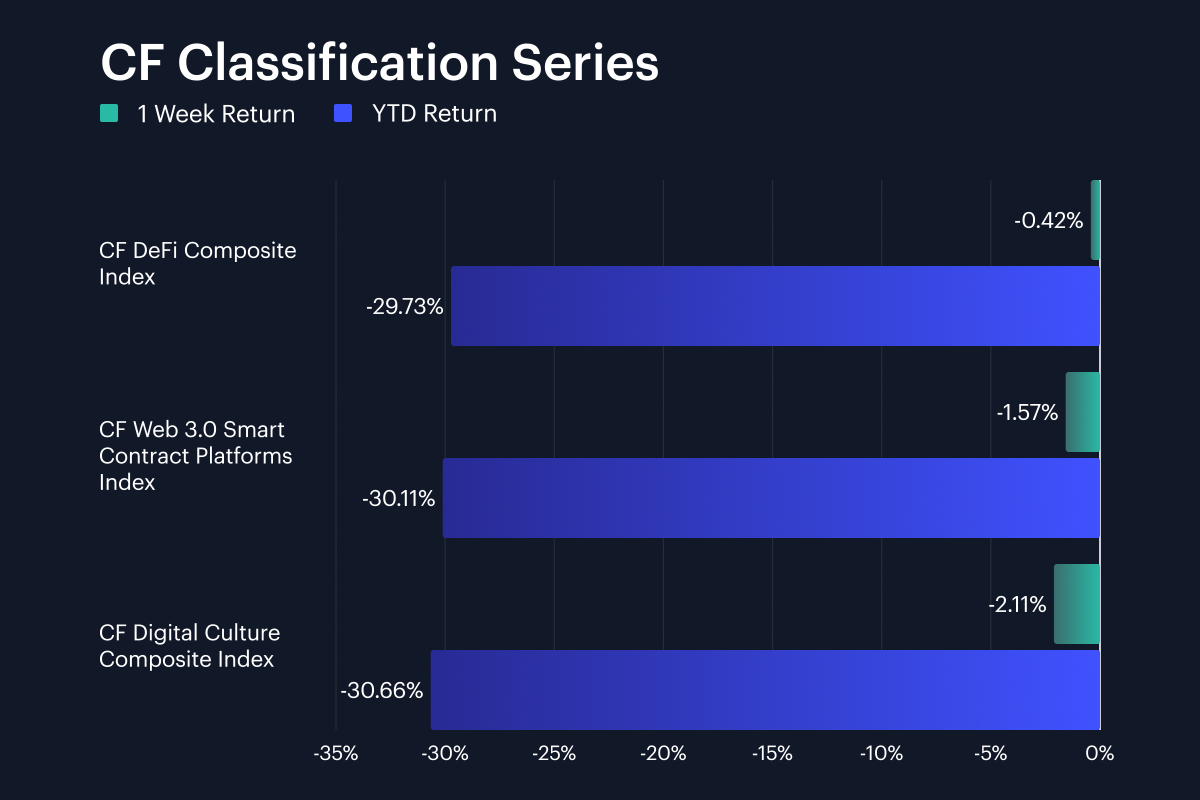
Across the CF Classification Series, DeFi held up best. The CF DeFi Composite Index fell 0.42% w/w, while the CF Web 3.0 Smart Contract Platforms Index lost 1.57% and the CF Digital Culture Composite Index fell 2.11%. That left DeFi 1.15 percentage points (pp) ahead of Web 3.0 and 1.69 percentage points ahead of Culture on the week. The ranking was clearer than the absolute move. DeFi nearly finished flat, whereas Web 3.0 still lost more than 1.5 pp and Culture more than 2.0 pp. Year-to-date returns remained heavy across all three themes, clustered between -29.7% and -30.7%, so the weekly ordering did not yet change the wider drawdown picture. Even so, the spread was wide enough to show where pressure eased first. With DeFi at -0.42%, Web 3.0 at -1.57%, and Culture at -2.11%, relative demand was firmer in DeFi than in the other two classification buckets.
Sector Analysis
Divergence showed up even more starkly in our CF Digital Asset Classification Structure (CF DACS) taxonomy than it did in our index tiers. Finance was the best performer among key Sub-Categories at -0.08% w/w, helped by COMP at +23.6%, JTO at +9.6%, and BAL at +7.1%, even though AAVE fell 7.6% and UNI -4.5%. Utility was the weakest Sub-Category at -3.78%, dragged by BICO at -8.9%, ENS at -3.5%, and LINK at -3.3%. Culture also stayed soft at -2.24%, while Infrastructure averaged -1.71%, Non-Programmable -2.08%, and Programmable -2.42%. The spread from Finance to Utility was therefore 3.70 percentage points. That’s materially wider than the 1.27 percentage point band seen in capitalization indices. Overall, Finance at -0.08% was close to flat, meaning that it was Utility at -3.78%, and Culture at -2.24%, that largely dragged the CF DACS average lower. With COMP at +23.6% on one side, and BICO at -8.9% on the other, we can interpret the week’s profile as indicating marked dispersion, with size a potential secondary driver.
CF Staking Series
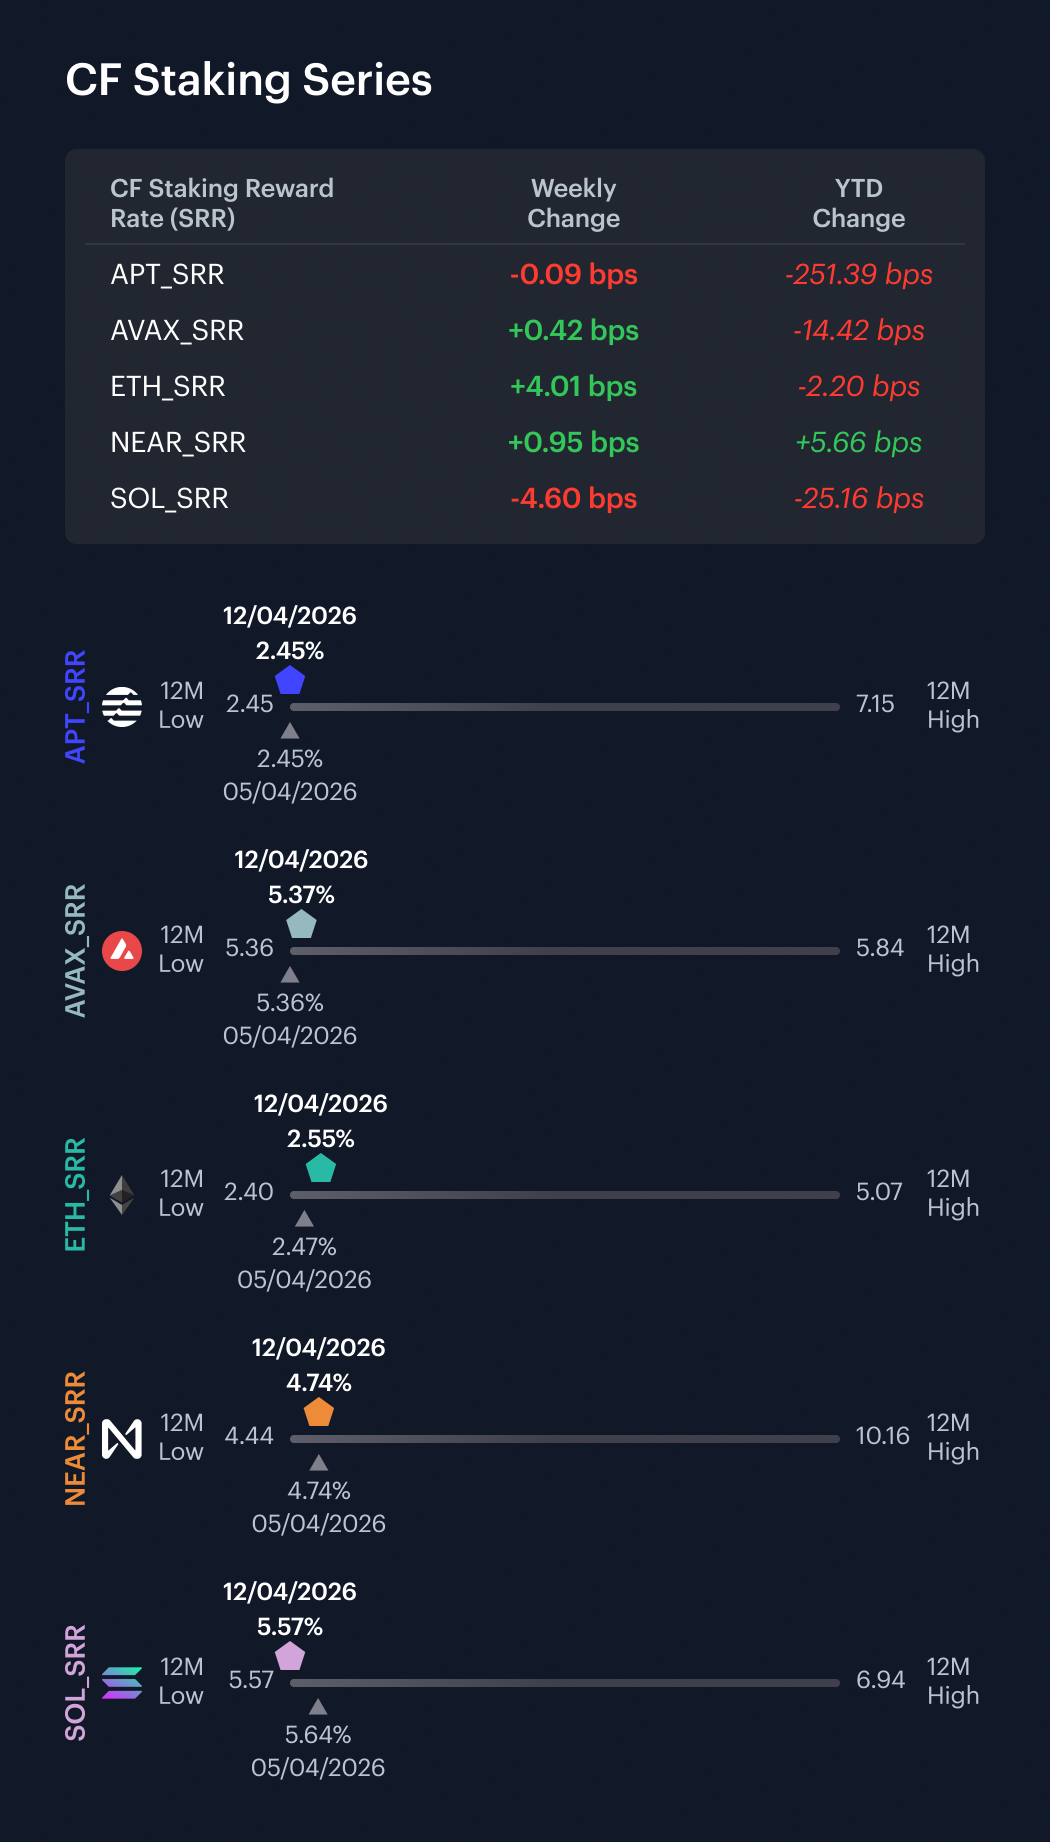
Moves in the CF Staking Series were tight in the stretch between April 6th and April 12th, apart from ETH’s. ETH Staking outshone its series peers, returning 1.60% w/w, equating to a reward rate move of 4.01 bps, from 2.5064% to 2.5465%. The rest of the staking assets in our coverage posted lackluster or negative showings. APT Staking returned -0.04% w/w, as its reward rate moved -0.09 bps, from 2.4499% to 2.4490%. AVAX Staking returned 0.08%, in step with its reward rate moving 0.42 bps, from 5.3641% to 5.3683%. NEAR Staking returned 0.20%, as its reward rate moved 0.95 bps, from 4.7289% to 4.7384%. SOL Staking reflected even clearer weakness, falling 0.82%, as its reward rate moved -4.60 bps, from 5.6190% to 5.5730%. Across the set, intra-week reward-rate changes ran from -4.60 bps to 4.01 bps. All told, the complex was stable overall. But with ETH Staking returning 1.60%, with a move of 4.01 bps, it was the only name where both return and reward-rate direction clearly stood out.
Interest Rate Analysis
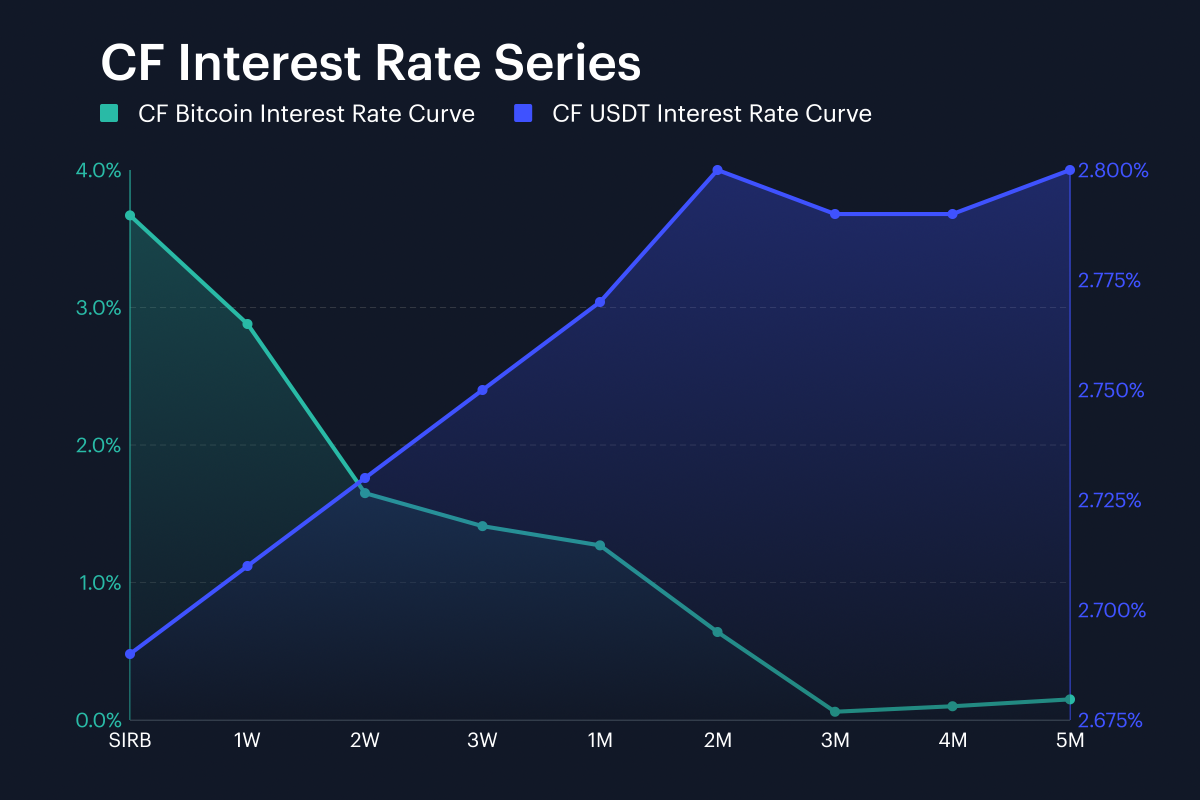
Funding conditions were split sharply between Bitcoin and USDT in our CF Bitcoin Interest Rate Curve (CF BIRC) complex. BTC’s session rate (SIRB) tumbled from 16.85% in the prior week to 3.67% in the most recent one, a drop of 1,318.14 bps. The 1-Week tenor also fell, easing from 3.64% to 2.88%, down 76.37 bps, while the 3-Month rate was nearly unchanged at 0.06%, up just 0.21 bps. USDT broadly moved the other way. USDT’s SIRB rose from 2.47% to 2.69%, up 22.32 bps, 1W increased from 2.49% to 2.71%, and 3M moved from 2.53% to 2.79%, up 22.91 bps and 25.75 bps. The cross-curve change band therefore ran from -1,318.14 bps to 25.75 bps. All that represents a clear message in the front end. With BTC SIRB reset from 16.85% to 3.67% while USDT SIRB rose from 2.47% to 2.69%, the two curves moved apart in shape even as both stayed positive.
The information contained within is for educational and informational purposes ONLY. It is not intended nor should it be considered an invitation or inducement to buy or sell any of the underlying instruments cited including but not limited to cryptoassets, financial instruments or any instruments that reference any index provided by CF Benchmarks Ltd. This communication is not intended to persuade or incite you to buy or sell security or securities noted within. Any commentary provided is the opinion of the author and should not be considered a personalised recommendation. Please contact your financial adviser or professional before making an investment decision.
Note: Some of the underlying instruments cited within this material may be restricted to certain customer categories in certain jurisdictions.
Changes to the Token Market Price Benchmarks Series - Market Prices – 21 July 2026
The Administrator has confirmed changes to the Token Market Price Family for the period 14 July 2026 to 21 July 2026.

CF Benchmarks
Softer CPI Reprices July Hike Risk & Lifts Digital Assets
Digital assets extended their recovery over the past week as cooler US inflation prints repriced Fed expectations; the bid was broad across the large cap indices, growth factor leadership returned, stablecoin funding repriced lower, and stress stayed isolated in names hit by token-specific news.
Mark Pilipczuk
Notice of the Demising of CF Dai-Dollar Settlement Price and Spot Rate
The Administrator announces that it will demise the CF Dai-Dollar Settlement Price (DAIUSD_RR) and CF Dai-Dollar Spot Rate (DAIUSD_RTI) which are members of the CF Digital Asset Index Family.
CF Benchmarks
By clicking Accept, you consent to CF Benchmarks's use of cookies.
Visit Cookie Settings to learn how CF Benchmarks uses cookies and to adjust your preferences.