
Feb 24, 2023
The CF Rolling CME Bitcoin Futures Index
The institutional on-ramp for strategic bitcoin exposure.
Introduction
The CF Rolling CME Bitcoin Futures Index unlocks an on-ramp to institutional caliber exposure for investors who may face certain regulatory constraints that prevent direct investing into spot-bitcoin. For the first time ever, there is a representative index that can effectively provide a strategic (or long-term) allocation to bitcoin price performance, without the need to invest into bitcoin itself. Our index provides an accurate replication of the returns of holding physical, or spot bitcoin, by utilizing underlying derivatives that are both scalable and regulated. This is done through listed CME Bitcoin Futures contracts which are settled to our flagship CME CF Bitcoin Reference Rate (BRR) and cleared on the world’s largest derivatives marketplace, the Chicago Mercantile Exchange (CME). This transparent methodology is robust enough for even the largest institutional investors who wish to create the best possible financial products for their clients.
Key take aways from this report:
- Diversified investors who have allocated and maintained a relatively small strategic allocation to bitcoin have witnessed sizeable outperformance and alpha generation, with only a marginal increase to the portfolio’s overall risk characteristics.
- The current regulatory landscape does not allow for direct bitcoin exposure in some of the largest global markets. Our rolling index provides a scalable solution through a growing liquidity complex for gaining exposure to bitcoin through the world’s most premier derivatives venue.
- We break down the mechanics of our rolling futures index and highlight how products or strategies that utilize our rolling futures index should anticipate replicable performance that can closely track the performance of spot-bitcoin over long time horizons.
Strategically Allocating to Bitcoin
Enhancing long-term returns through bitcoin
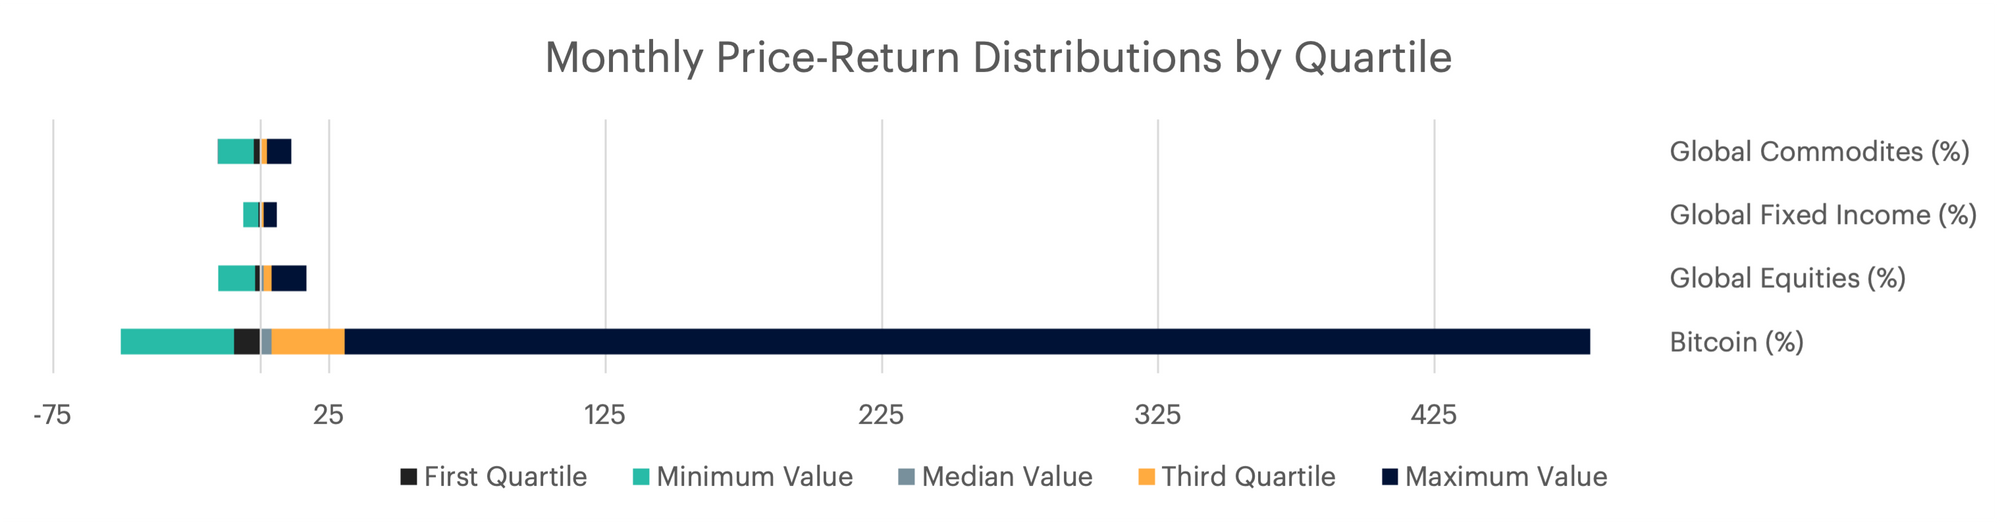
Bitcoin’s return profile can best be summarized as asymmetrically positive, especially when comparing it to other traditional asset classes. Despite its reputation for being volatile and experiencing large drawdowns, longer-term holders of bitcoin have witnessed more positive outcomes that have outweighed negative returns in comparison. Over the past 10 years, median monthly returns of Bitcoin have averaged approximately 4%, which is almost four times higher than that of global equities. Taking a closer look, the third-quartile of monthly returns for bitcoin has been even more asymmetrical in comparison to equity returns (+ 26.4% vs +2.7%, respectively). When comparing negative outcomes, bitcoin has seen monthly negative returns exceed other traditional risky assets. However, the consistently positive monthly return distributions have helped investors who have long time horizons.
Rightsizing your bitcoin allocation
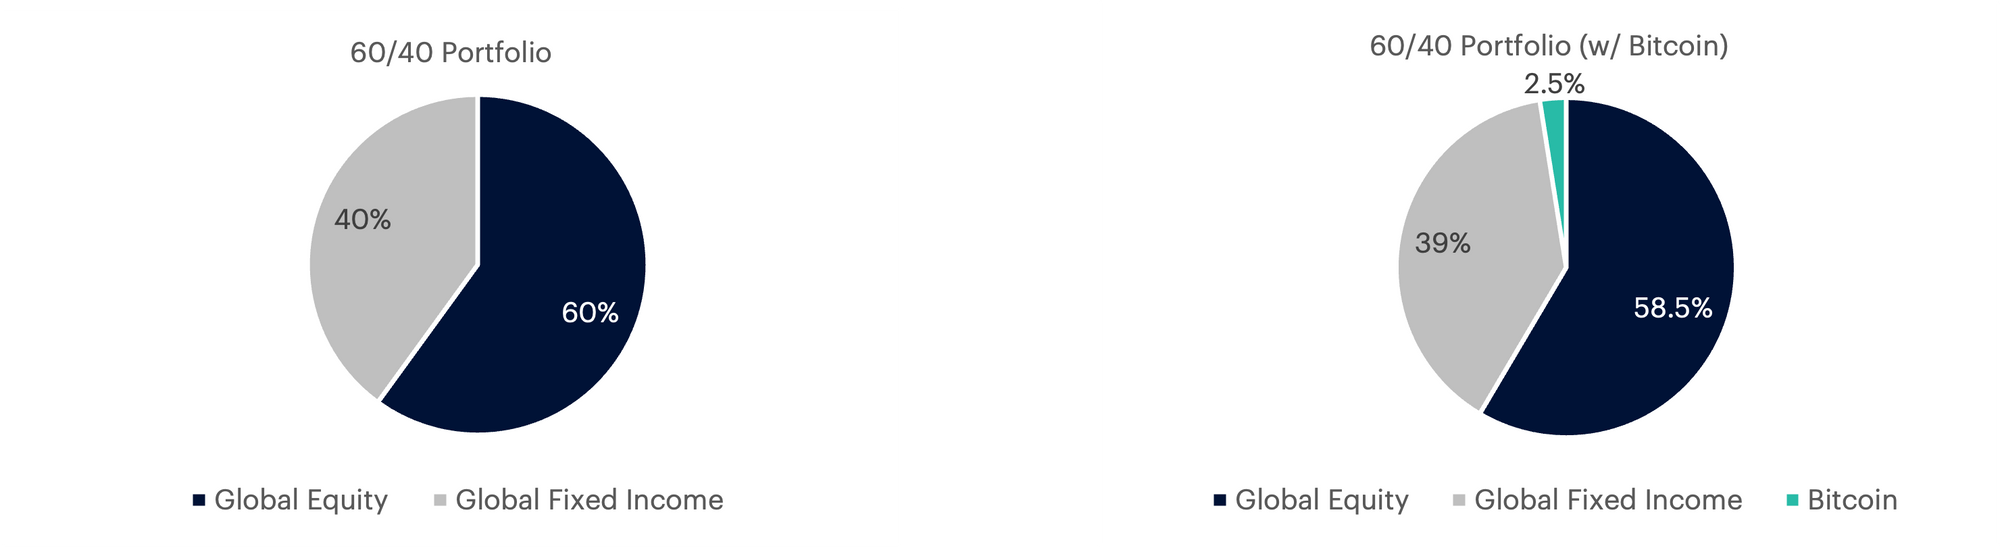
One of the main challenges for investing into bitcoin is deciding exactly the right size for your initial investment, and subsequently, how to maintain your exposure going forward. As highlighted previously, bitcoin as an asset has experienced outsized gains, along with periods of sizable drawdowns. Therefore, an investor can choose to allocate a portion that is large enough to provide a material positive contribution to their portfolio, but small enough to make sure that the client and overall portfolio can weather periods of volatility. In the following example, we demonstrate that only a small amount (+2.5%) is sufficient for a globally diversified investor to participate in long-term price appreciation while maintaining a risk profile that is largely unchanged.
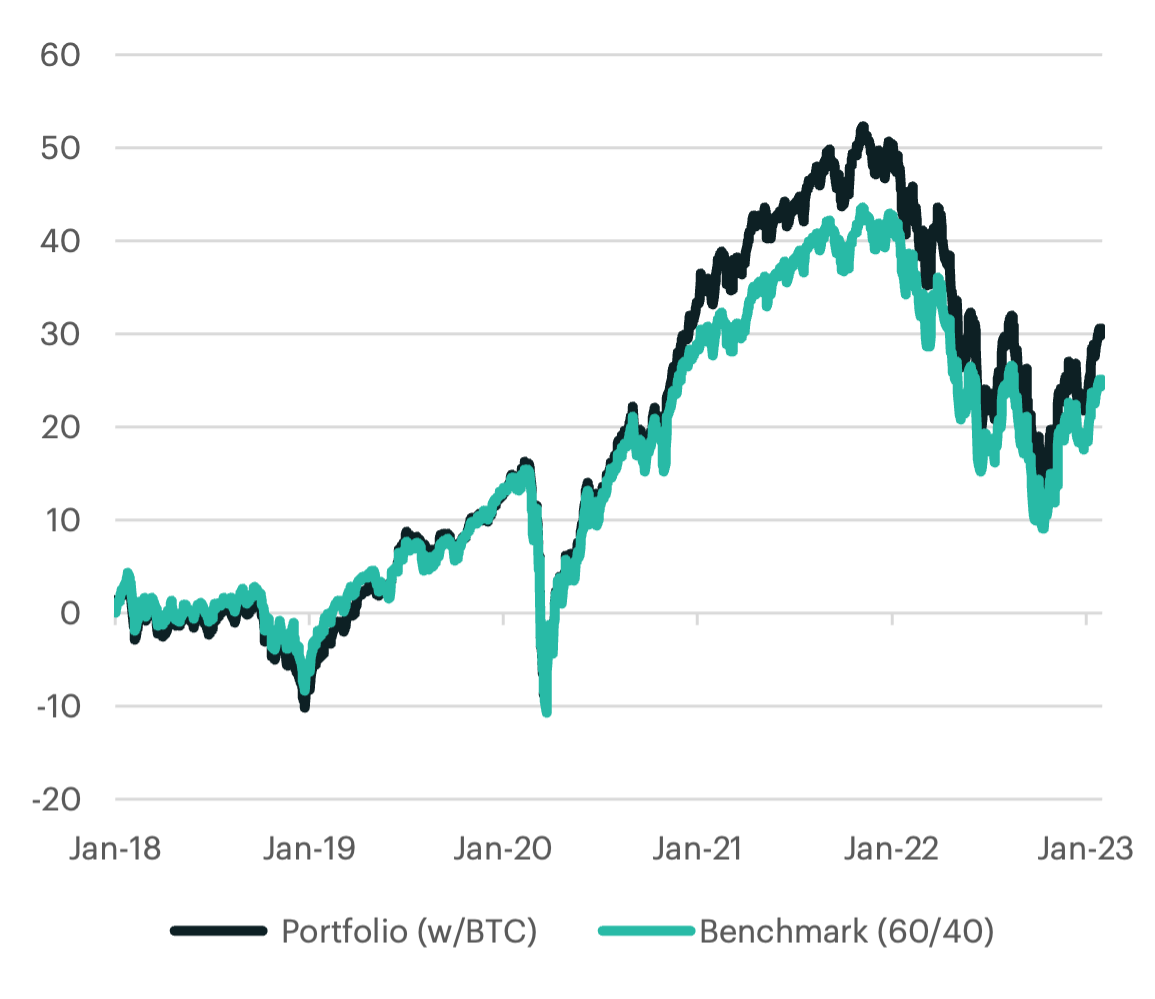
Portfolio impacts: holding bitcoin through time
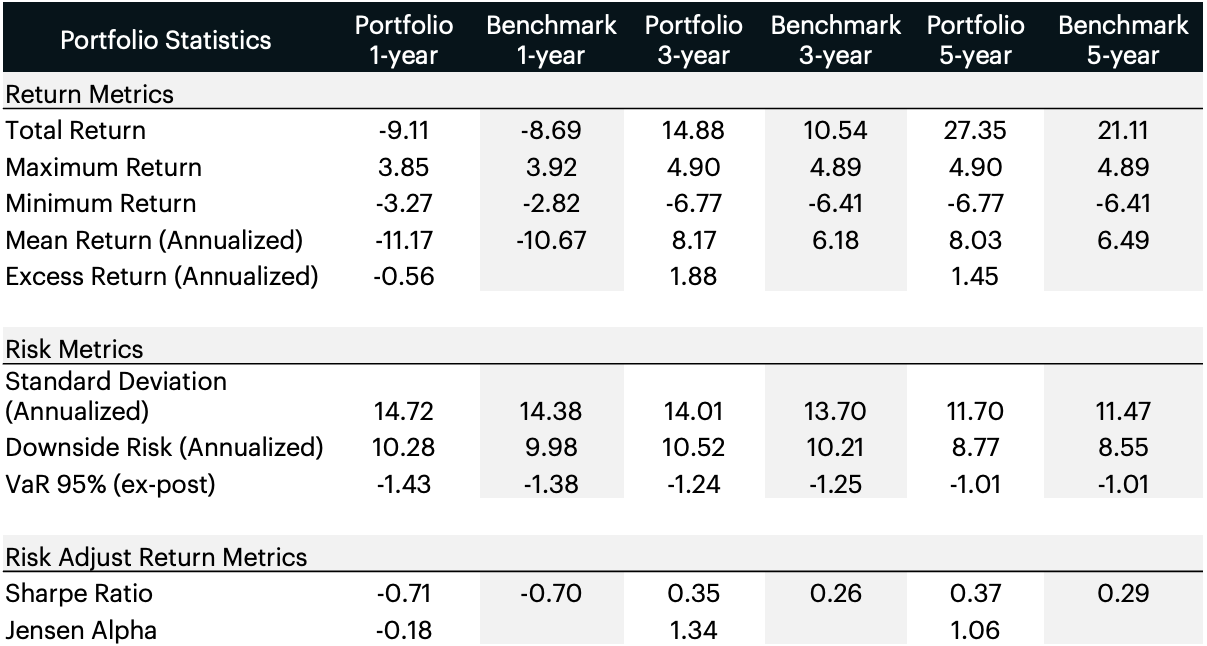
The positive asymmetry of bitcoin’s return profile can make a sizable impact on a balanced portfolio over time. Our analysis illustrates that only a 2.5% allocation has increased longer-term (3yr & 5yr) returns with only marginal increase to the overall risk of the portfolio. When maintaining exposure to bitcoin through the past 5-years, our hypothetical portfolio has added over 6% of additional absolute performance, or 1.5% annualized. Lastly, if we account for risk adjusted performance, the bitcoin portfolio has experienced over a 27% increase in performance as measured by the Sharpe Ratio.
Navigating Regulatory Uncertainty with CME Futures
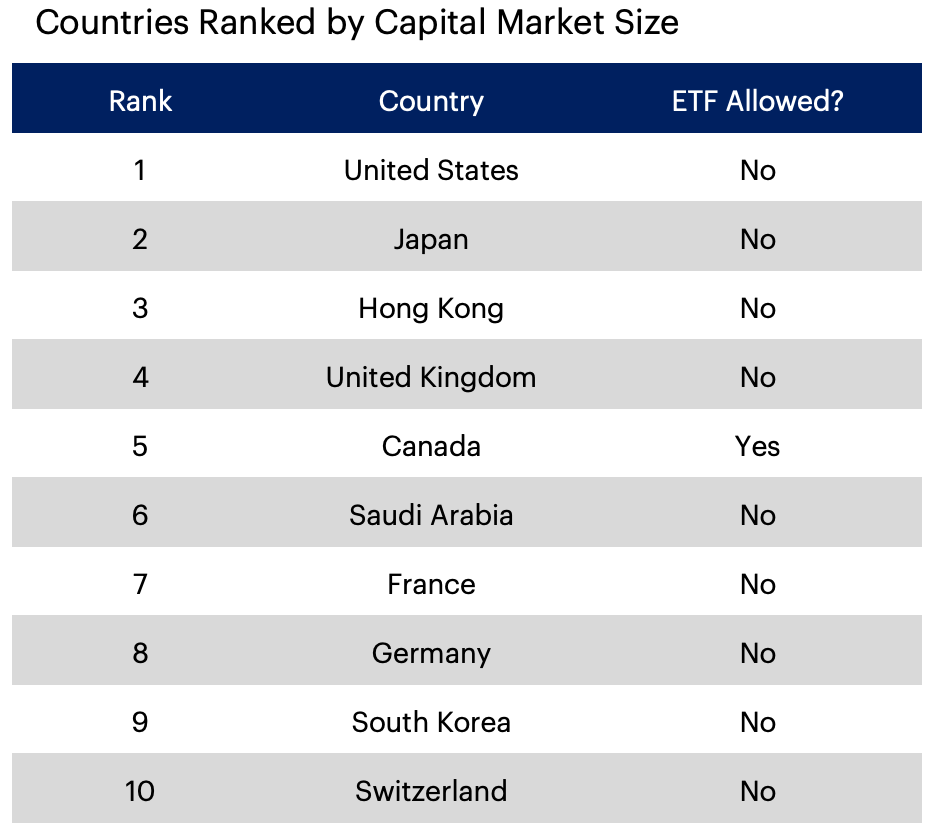
Regulatory landscape: which countries allow spot bitcoin funds?
Spot bitcoin ETFs continue to face a series of regulatory issues. In the U.S. for example, the Securities and Exchange Commission has cited concerns of market integrity and lack of liquidity which could lead to price manipulation. As well, the financial regulator that will lead oversight of digital assets hasn’t been decided. Meanwhile, there is no official consensus as to whether cryptos should be considered commodities or not. Needless to say, these concerns have prevented any open-ended funds to receive a nod of approval, despite the incredible demand by the investing public.
In other countries, only one of the top-ten largest capital markets does not have restrictions on spot bitcoin ETFs. Meanwhile, demand for reliable ETF product that tracks the price of Bitcoin remains high. Our rolling futures index was designed to deliver a viable solution for institutional investors to create a product that is not only efficient and scalable, but most importantly, can be approved in jurisdictions where restrictions remain for spot bitcoin products.
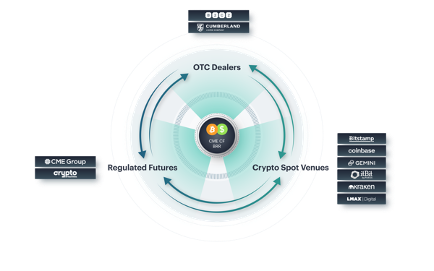
The BRR Liquidity Complex: from BRR to end-client portfolio
To fully understand how our CF Rolling CME Bitcoin Futures Index is both scalable and replicable, one must understand the BRR Liquidity complex. Starting with the CME CF Bitcoin Reference Rate (BRR), which is a once-a-day benchmark index price for Bitcoin that aggregates trade data from multiple bitcoin-USD markets operated by major cryptocurrency exchanges that conform to the CME CF Constituent Exchange Criteria. This reference rate is what powers the world’s most institutionally traded, fully regulated futures contracts on the Chicago Mercantile Exchange. From here, derivatives, such as futures, that reflect pricing for bitcoin can be bought and sold in unlimited quantities through the BRR and OTC dealers. As illustrated, these fully regulated derivatives create a liquidity feedback loop which can then be utilized by institutional investors to gain accurate and replicable exposure to bitcoin and ultimately be packaged into end user-products (such as ETFs).
Institutional adoption trend unlocks scalable replication
The recent wave in institutional adoption for bitcoin futures can be measured by the growth of total open interest. Since early 2020, the upward trend has remained structurally intact despite the recent bear market cycle. The total number of futures contracts held by market participants has climbed from approximately 4K to over 18K over this time period.
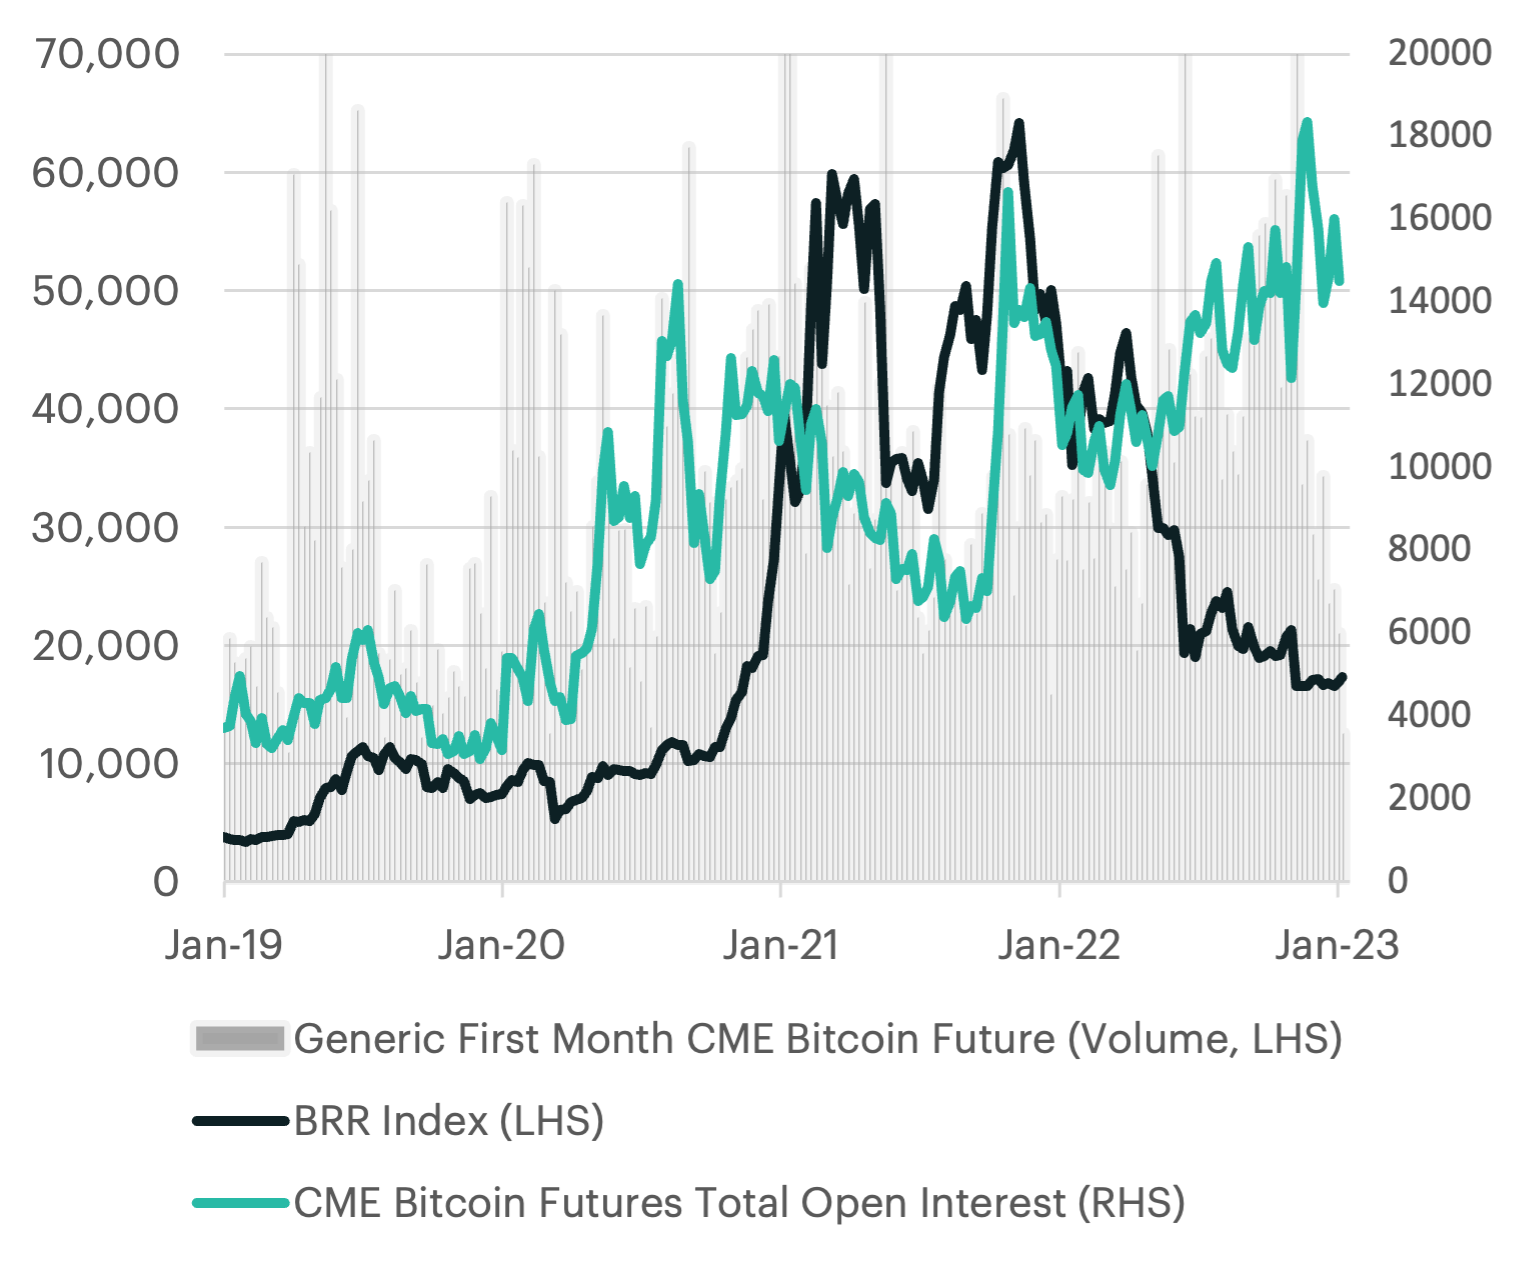
Meanwhile, total trading volume for the current (or most prompt) month has also remained persistently adequate throughout the recent drawdown in bitcoin prices. This empirically demonstrates that institutional demand growth for bitcoin exposure through the CME has yet to be influenced by cyclical price movements. Therefore, investors that choose to use the CF CME Rolling Futures Index will have already experienced growth of liquidity and market depth through the growth of CME’s Bitcoin Futures and the BRR liquidity complex.
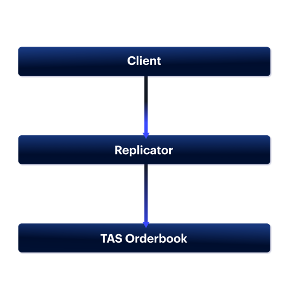
Minimizing operational risks with CME’s TAS
By fully executing on the CME, asset managers will be able to manage their operational risk using the CME Group’s Trading at Settlement (TAS) system. TAS is an order book that allows trade execution at a specified spread to the settlement prices at any time during regular trading hours. This allows users to reduce uncertainty around settlement levels; allowing asset managers an easier way to manage slippage costs during all hours of the trading session.
Below we will highlight some example use cases:
- ETF or ETP issuers: TAS can help facilitate easier creation and redemption by securing a specified spread to net-asset-values.
- Banks and OTC dealers: will have the ability to replicate our CF Rolling CME Futures Index for clients, while reducing pricing uncertainty and mitigating position risk.
Understanding CF Rolling Bitcoin Futures
How does the CF Rolling CME Bitcoin Futures Index work?

The mechanics behind our CF Rolling CME Futures Index can be illustrated above. Here we can see the portfolio allocation broken out over the last 12 months by the most prompt (or present month’s contract), the subsequent month (N+1), and lastly, the month that follows or (N+2). Throughout each month, as the current month’s contract approaches its expiration, our index will exit out of the expiring futures contracts to buy more of the following month’s contract (N+1) and initiate a position into the next subsequent month’s futures contract (N+2). The roll period varies but it typically occurs a few days before the final Friday of each month. Lastly, the transaction costs of rolling into the next contract can vary depending on market conditions and pricing differentials between the expiring contract and the subsequent contracts. Our index largely mitigates these costs by primarily maintaining its largest holding in the promptest futures contract. We will dive deeper into this topic next.
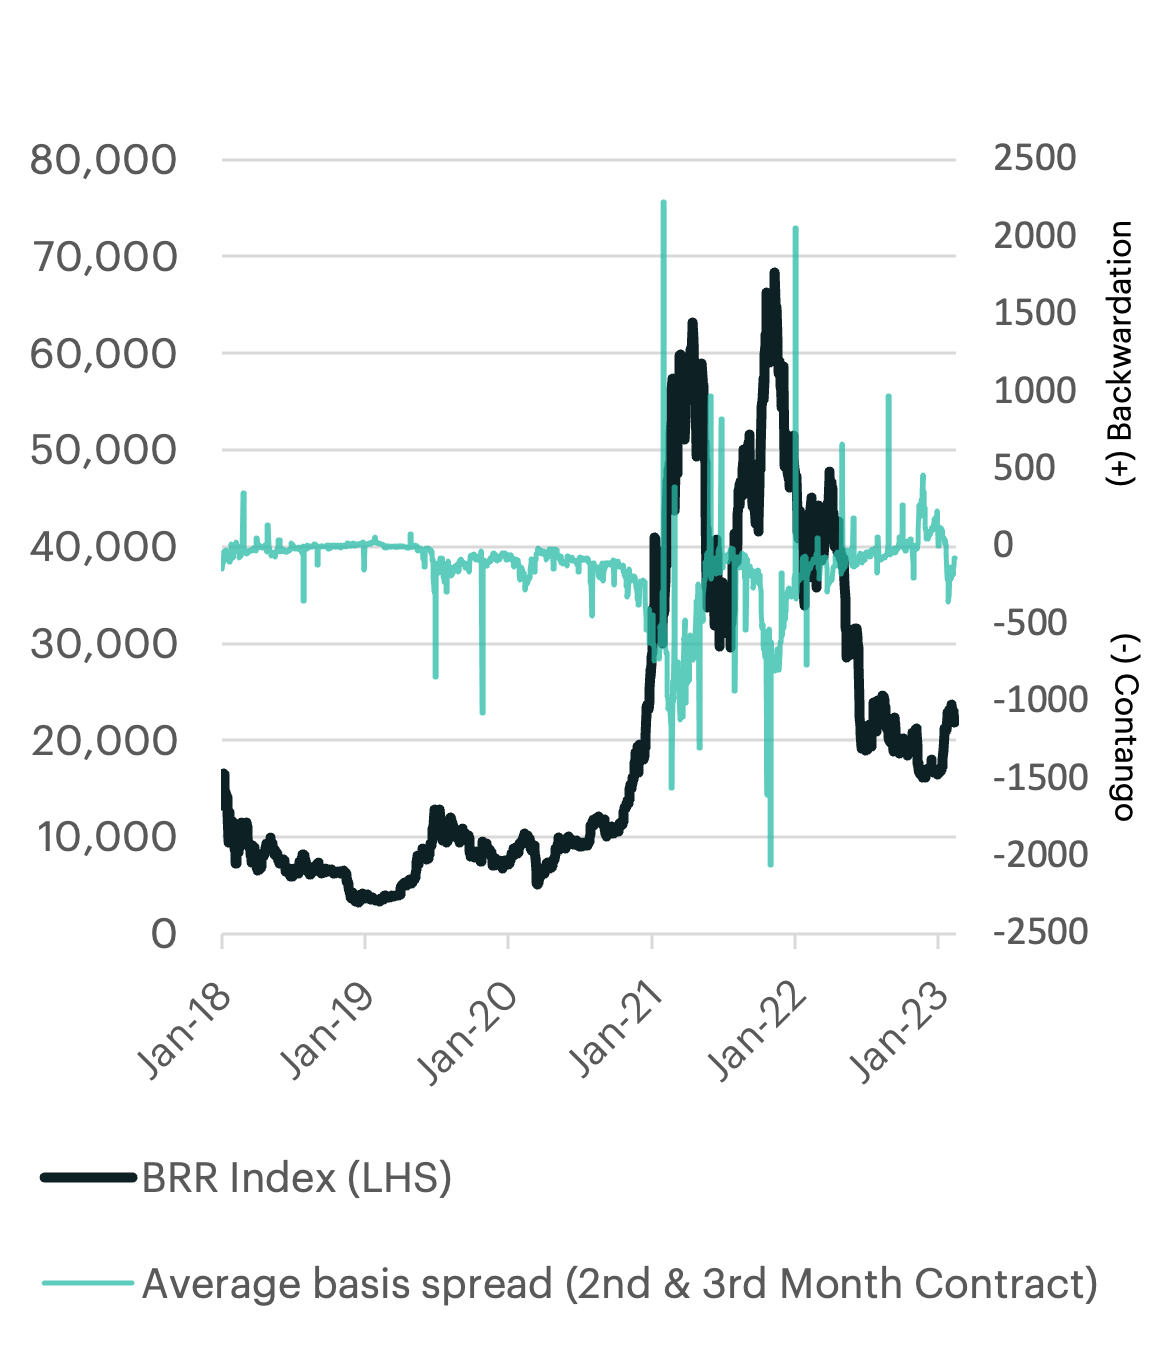
Dissecting term structures: from contango to backwardation
The term structure of a futures curve can be categorized by practitioners as either being in backwardation (downward sloping) or contango (upward sloping). Bitcoin futures have on average experienced a structurally upward slope (or contango) dynamic, which is associated with having a negative roll (or carry cost). Unlike commodity futures, cash-settled futures contracts that derive their prices from equity, bond, or currency markets are primarily impacted by the collateral yield that denotes the price (i.e., the underlying risk-free rate), which typically fully explains term structure differences. The higher the collateral yield, the steeper the contango (or vice versa).
Bitcoin futures are also cash-settled derivative instruments. However, differences in the future’s term structure has historically been heavily influenced by price sentiment and volatility. For example, during the price rallies that began in late 2020 and mid 2021, excessive bullish price sentiment and upside volatility resulted in a steepening of the futures curve, which temporarily increased the carrying cost of our index. However, during periods of downside price action and volatility, we can see this dynamic reverse to some degree, thus providing some positive carry opportunities. While it is possible that the market dynamics that prevail in other cash-settled futures markets may one day impact bitcoin futures, it has yet to be seen. Next, we will take a deeper dive into our index’s performance over time.
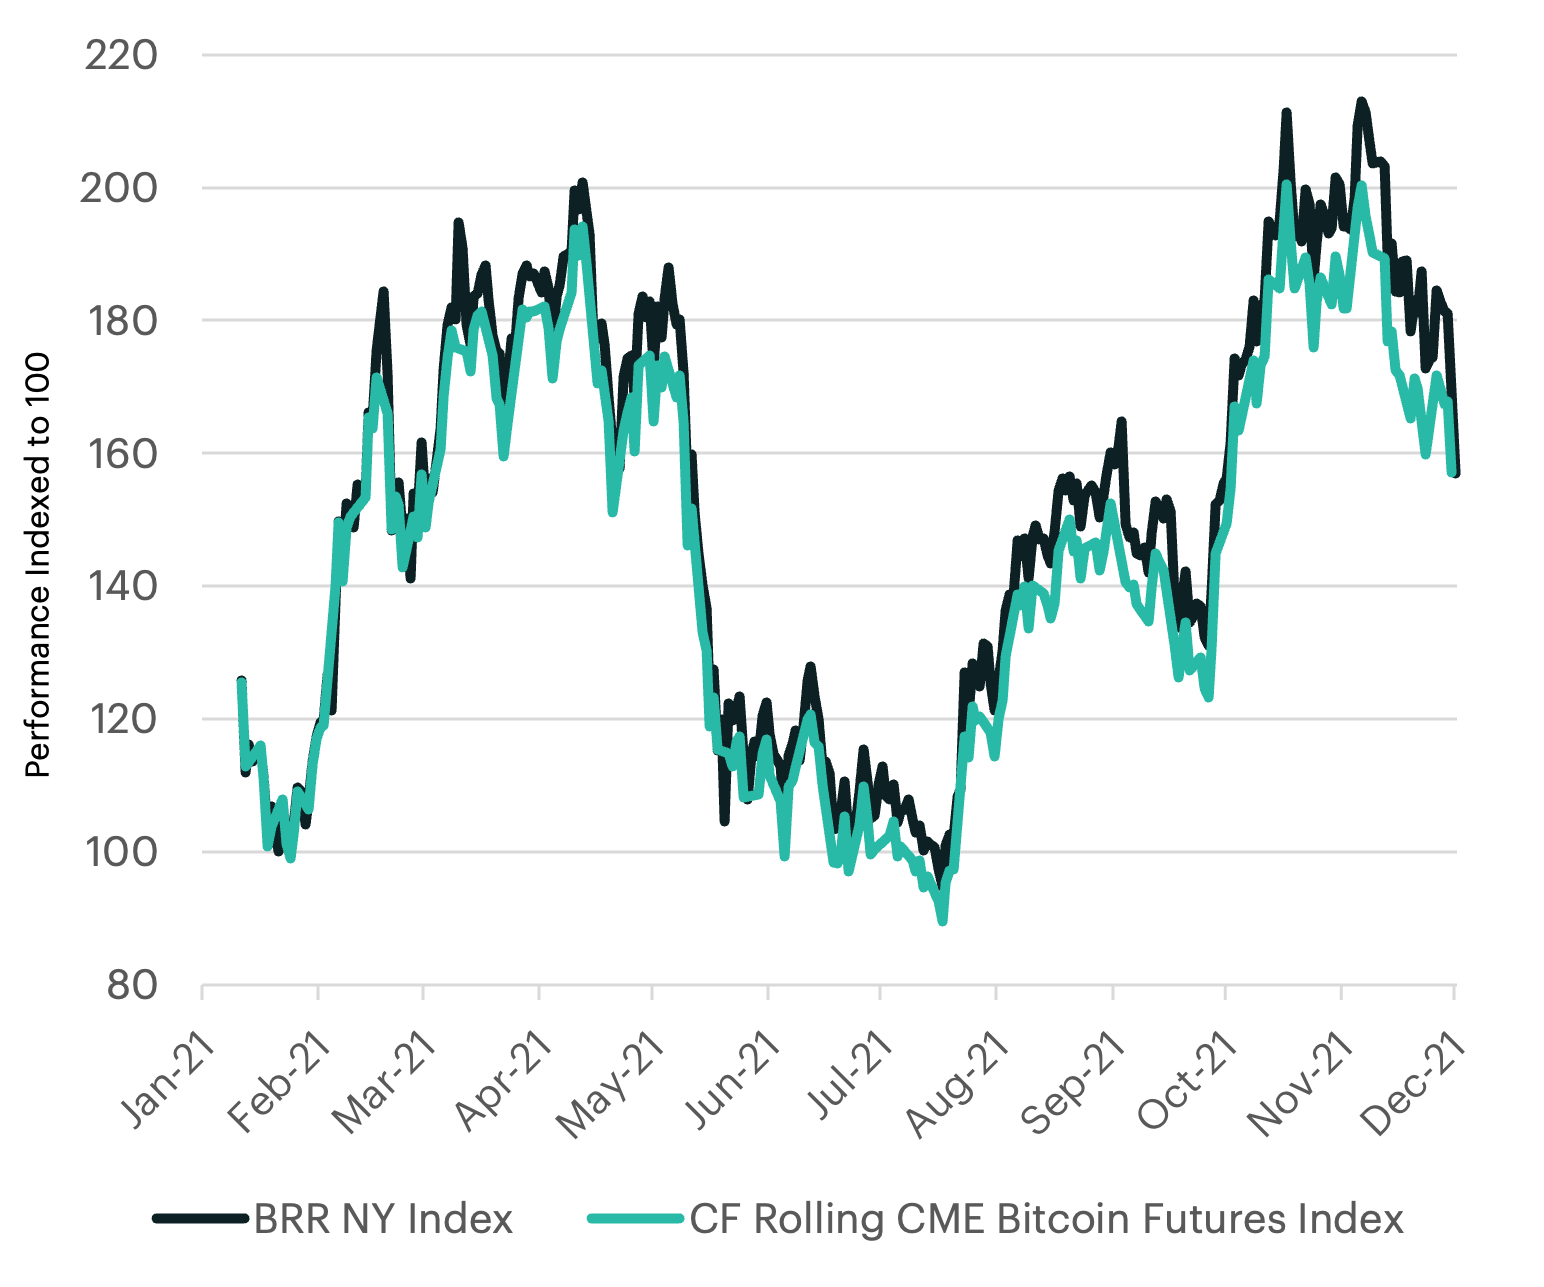
Rolling futures over a bull market
The overall performance of our rolling futures index can be impacted by the costs of executing the roll that facilitates its perpetual exposure to bitcoin’s spot price. In this analysis, we will compare both a bullish and a bearish market environment to determine how the term structure of bitcoin futures can impact overall performance.
During periods of exceptionally strong performance, we have observed temporary underperformance due to steeper contango. The illustration highlights that gap in performance has historically been short-lived, and future variables, such as the continued growth and maturity of bitcoin futures, may diminish the cost of carry over time. As previously mentioned, our index is optimized to mitigate the increase of carry costs by maintaining most of the portfolio allocation in the promptest month contract. This results in a daily average tracking error of just 5.3 bps for CF Rolling CME Bitcoin Futures against spot bitcoin (BRR NY Index).
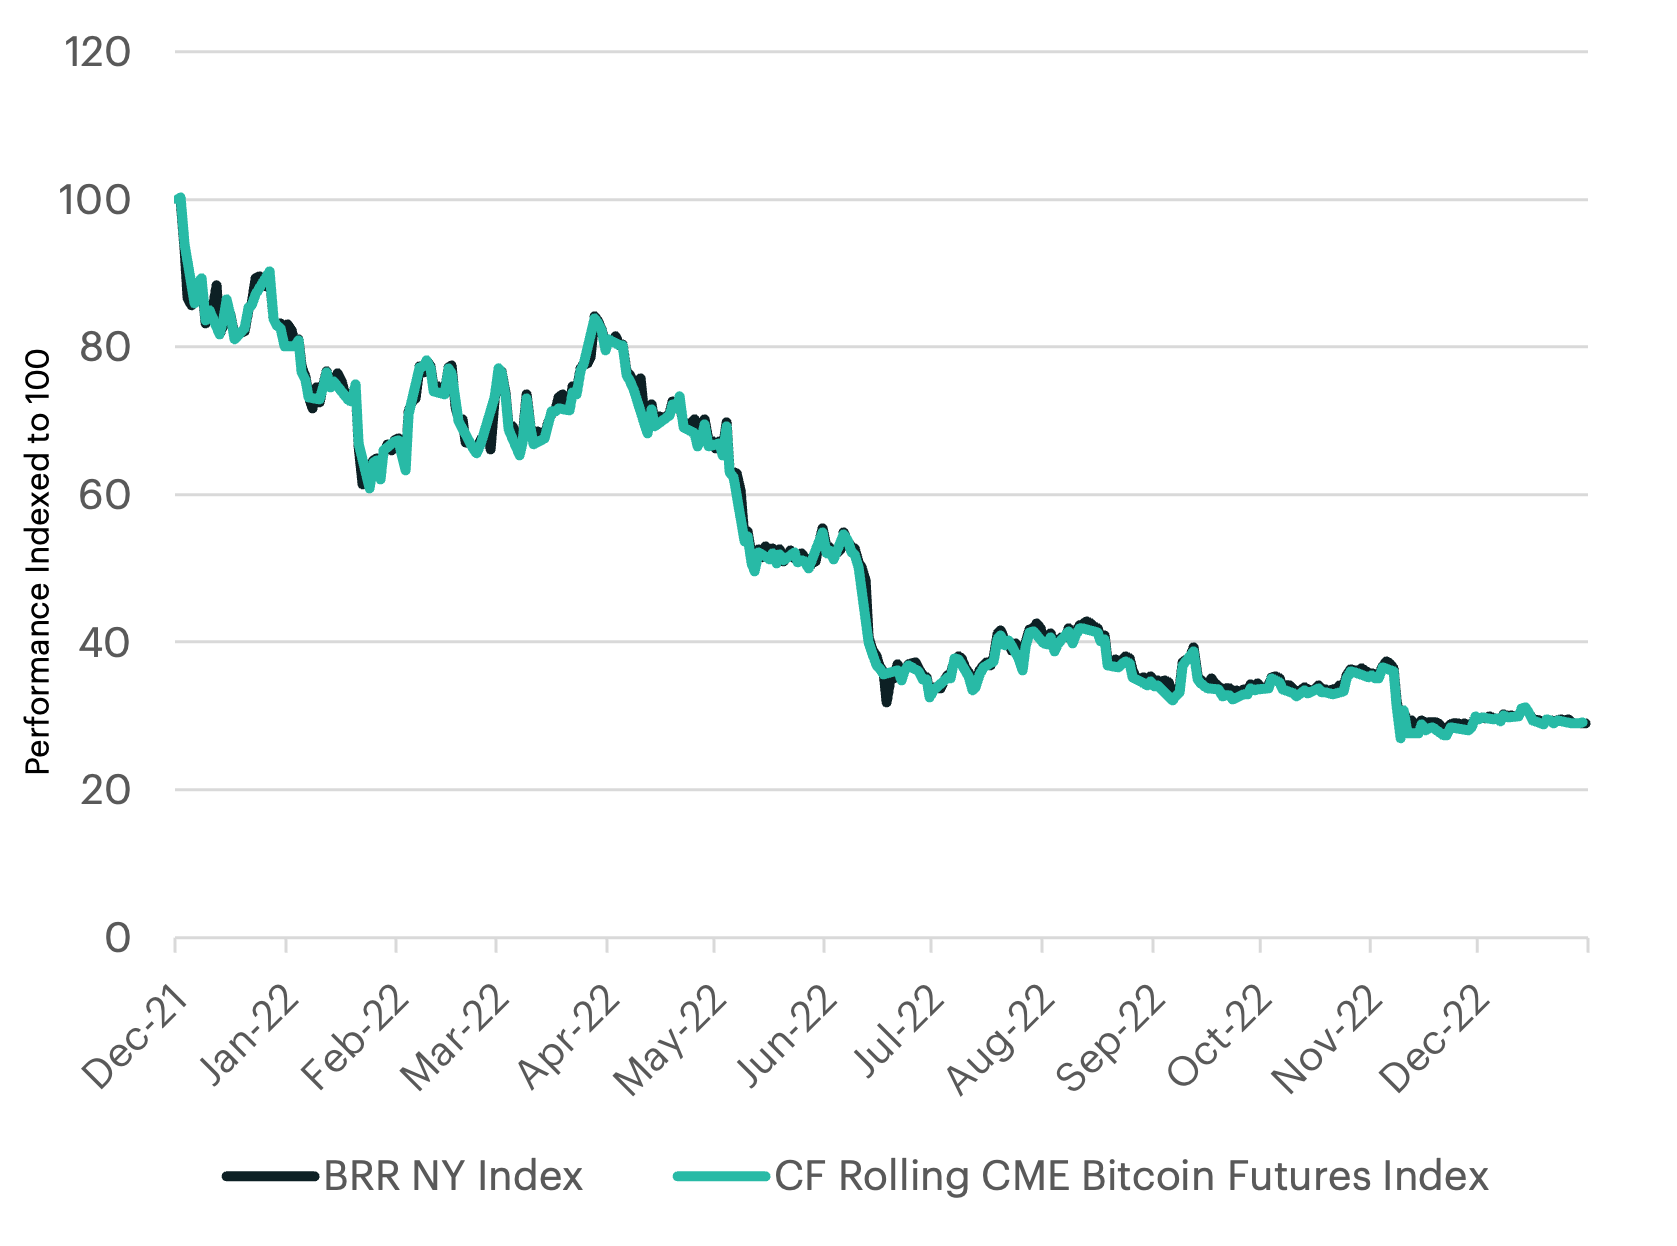
Rolling futures over a bear market
When comparing the performance of our CF Rolling CME Bitcoin Futures Index to spot bitcoin over a bear market cycle, one should expect an even closer relationship. As previously mentioned, price sentiment has historically impacted the cost of rolling into the subsequent contracts, and bearish sentiment has typically reduced roll costs. In other words, the bitcoin futures’ term-structure becomes flatter; even entering backwardation at times.
This dynamic is advantageous for executing the roll of our futures index. Over this observed window, the index’s average daily tracking error fell to just 0.1 bps, which is indicative of a reduction in carrying costs. At times, the positive carry from a backwardated futures curve slightly cushioned some of the steeper price declines of spot bitcoin, which allowed for the CF Rolling CME Bitcoin Futures Index slightly outperform spot bitcoin over this time period.
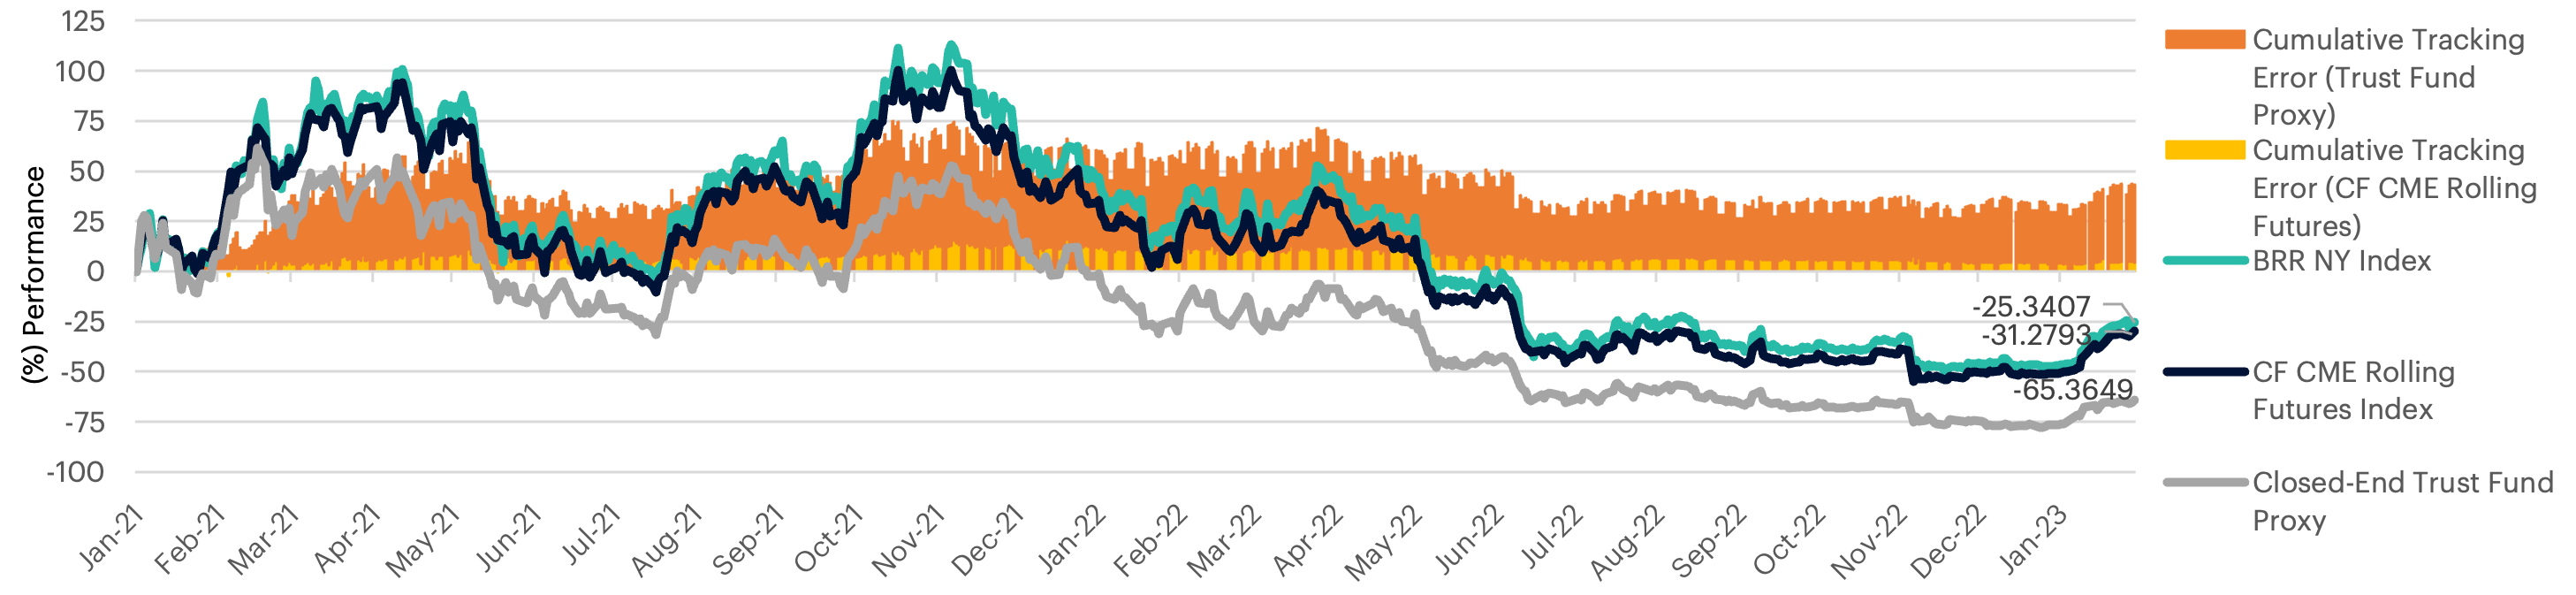
In summary: rolling futures for the long-run
Investors have faced a series of practical challenges in trying to gain practical bitcoin exposure until now. One popular option in the U.S. has been to utilize a closed-end trust fund structure that can trade on the secondary market. However, closed-end funds are constrained in their share redemption or creation processes, which has historically led to shares of the fund to price at significant discounts or premiums to the underlying value of the fund. Since its January 2021 inception, we can compare our CF Rolling CME Futures Index to our flagship CME CF Bitcoin Reference Rate (or BRR) and a market leading closed-end fund to see the longer-term results through various market cycles. In summary, the CF Rolling CME Futures Index may be temporarily impacted by additional costs of carry during periods of extreme upside price volatility, but over time, the index maintains a relatively tight tracking error, especially when compared to the alternative closed-end fund structure (which has seen deviations as high as +60%). Therefore, investors who face certain regulatory challenges to strategically investing into spot bitcoin now have a viable index that is replicable through fully-regulated financial instruments.
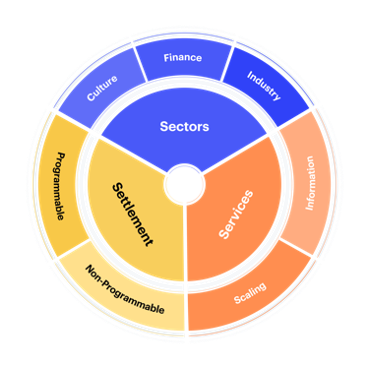
Appendix: CF Digital Asset Classification Structure
The CF Digital Asset Classification Structure (CF DACS) classifies coins and tokens based on the services that the associated software protocol delivers to end users, grouping assets by the role they play in delivering services to end users. The CF DACS powers CF Benchmarks' sector composite and category portfolio indices and allows users to perform attribution analysis to better understand the fundamental drivers of returns within their digital asset portfolios.
Additional Resources
For more information about our CF Benchmark indices and our methodologies, please visit the respective web links below:
- CF Diversified Large Cap Index
- CF DeFi Composite Index
- CF Web 3.0 Smart Contract Platforms Index
- CF Digital Culture Composite Index
- CF Blockchain Infrastructure Index
- CF Cryptocurrency Ultra Cap 5 Index
- CF Broad Cap Index - Market Cap Weight
- CF Broad Cap Index - Diversified Weight
Contact Us
Have a question or would like to chat? If so, please drop us a line to:
The information contained within is for educational and informational purposes ONLY. It is not intended nor should it be considered an invitation or inducement to buy or sell any of the underlying instruments cited including but not limited to cryptoassets, financial instruments or any instruments that reference any index provided by CF Benchmarks Ltd. This communication is not intended to persuade or incite you to buy or sell security or securities noted within. Any commentary provided is the opinion of the author and should not be considered a personalised recommendation. Please contact your financial adviser or professional before making an investment decision.
Note: Some of the underlying instruments cited within this material may be restricted to certain customer categories in certain jurisdictions.
Factor Friday - June 19, 2026
The drawdown stalled this week: the Market factor fell just 0.40% after last week's 7.77% drop, and leadership rotated out of defensives back into fundamentals. Growth led at +2.54% and Value at +2.15%, while Size held the year-to-date top spot. Momentum stayed the weakest factor.

Mark Pilipczuk
Suspension of Contributed Exchanges from Certain Token Market Price Benchmarks
The Administrator announces the suspension of Contributed Exchanges from Certain Token Market Price Benchmarks detailed below
CF Benchmarks
Changes to the Token Market Price Benchmarks Series - Market Prices – 16 June 2026
The Administrator has confirmed changes to the Token Market Price Family for the period 09 June 2026 to 16 June 2026.
CF Benchmarks
By clicking Accept, you consent to CF Benchmarks's use of cookies.
Visit Cookie Settings to learn how CF Benchmarks uses cookies and to adjust your preferences.