
Sep 11, 2022
Quarterly Attribution Analysis: CF DeFi Composite Index
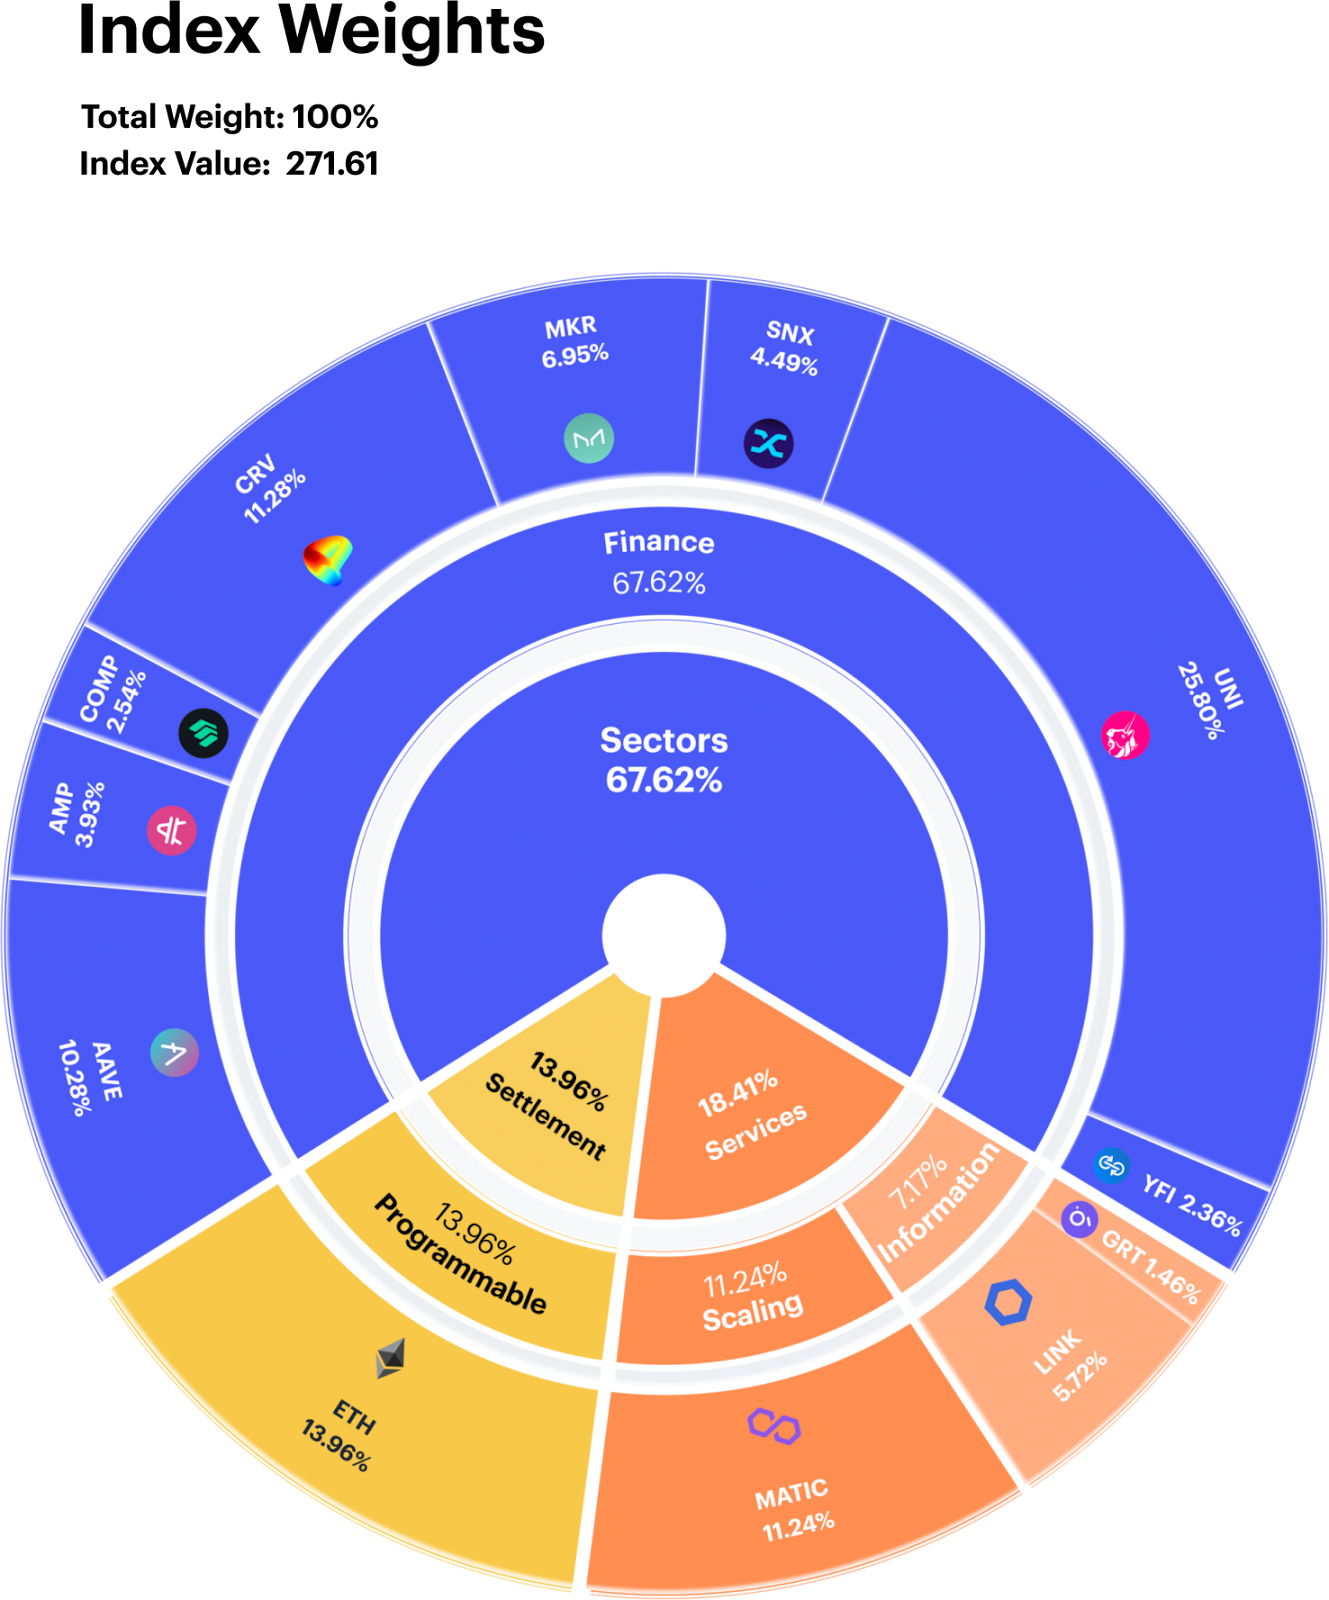
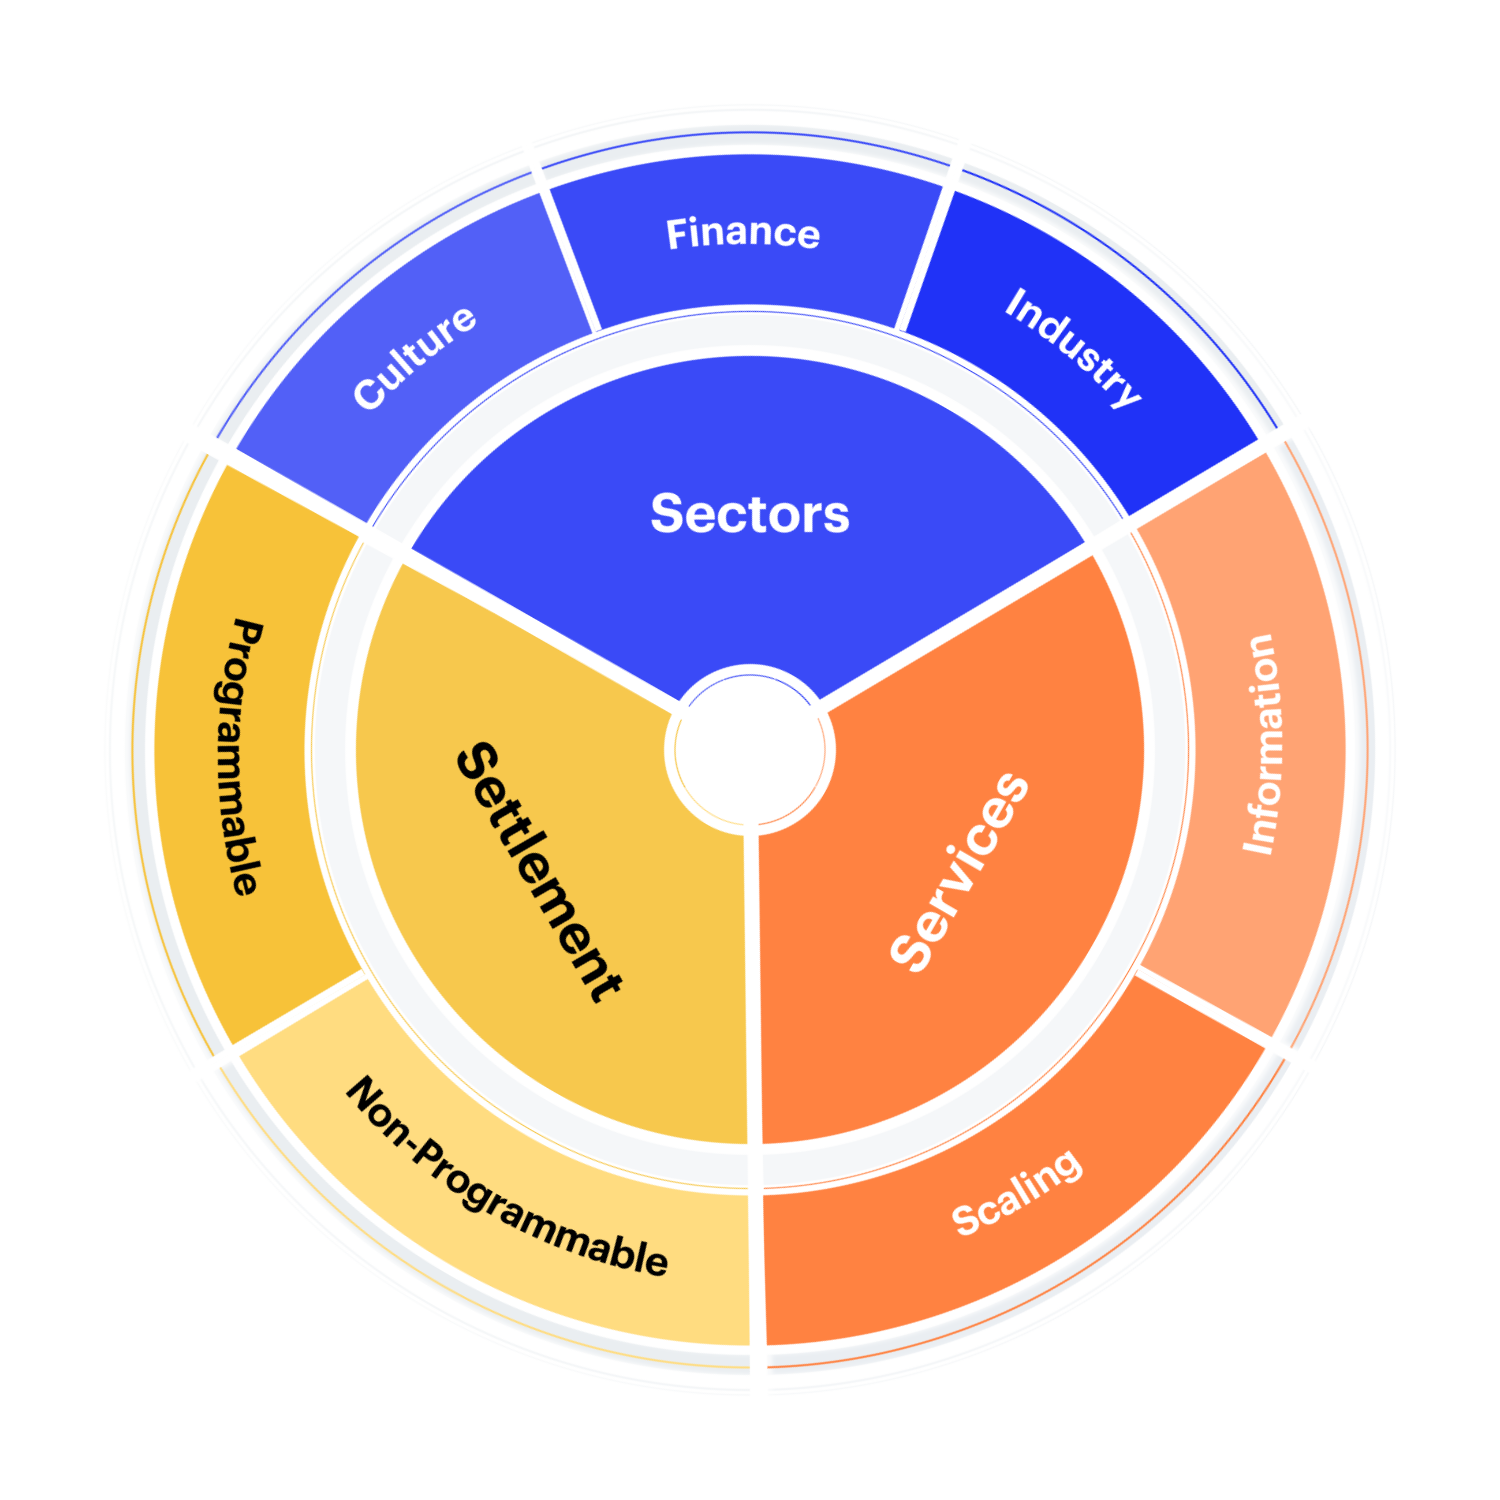
The CF DeFi Composite Index - is a liquid, investible benchmark portfolio index that tracks the return performance of decentralised financial services, commonly referred to as "DeFi". The index is comprised of three distinct sub-portfolios of fixed weight that represent the components of blockchain architecture that are required to deliver decentralised financial services to individual and institutional end users; DeFi Applications, Services and Settlement Blockchains. Digital assets are classified in accordance with the CF Digital Asset Classification Structure (DACS) for sub-portfolio eligibility.
DeFi Stumbles on Macro and Regulatory Headwinds
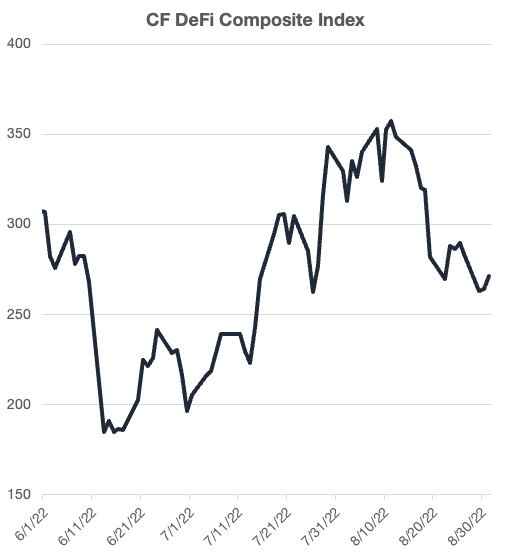
The challenging macroeconomic environment continued for digital assets: inflation remained at multi-decade highs, central banks made sizeable policy rate increases, and global growth has begun to stall. Meanwhile, the CF DeFi Composite Index has fallen -11.6% over the course of our most recent rebalancing period. Markets have remained vulnerable to increases in central bank policy rates that has led to a tightening of financial conditions in an effort to stymie inflation in most developed market economies. Although this dynamic has been visible across most risky assets, such as equities, the naturally higher volatility in the digital asset space has amplified downside price action.
From a regulatory standpoint, the Securities and Exchange Commission (SEC) has narrowed their attention on declaring a series of tokens as se
curities. Combined, these headwinds were met with a new bullish catalyst stemming from the upcoming Ethereum Proof-of-Stake (PoS) upgrade (or “merge”). The surprise announcement reversed the negative price trend and lifted the index into positive territory for most of the second half of the period.
Scaling Stands Out
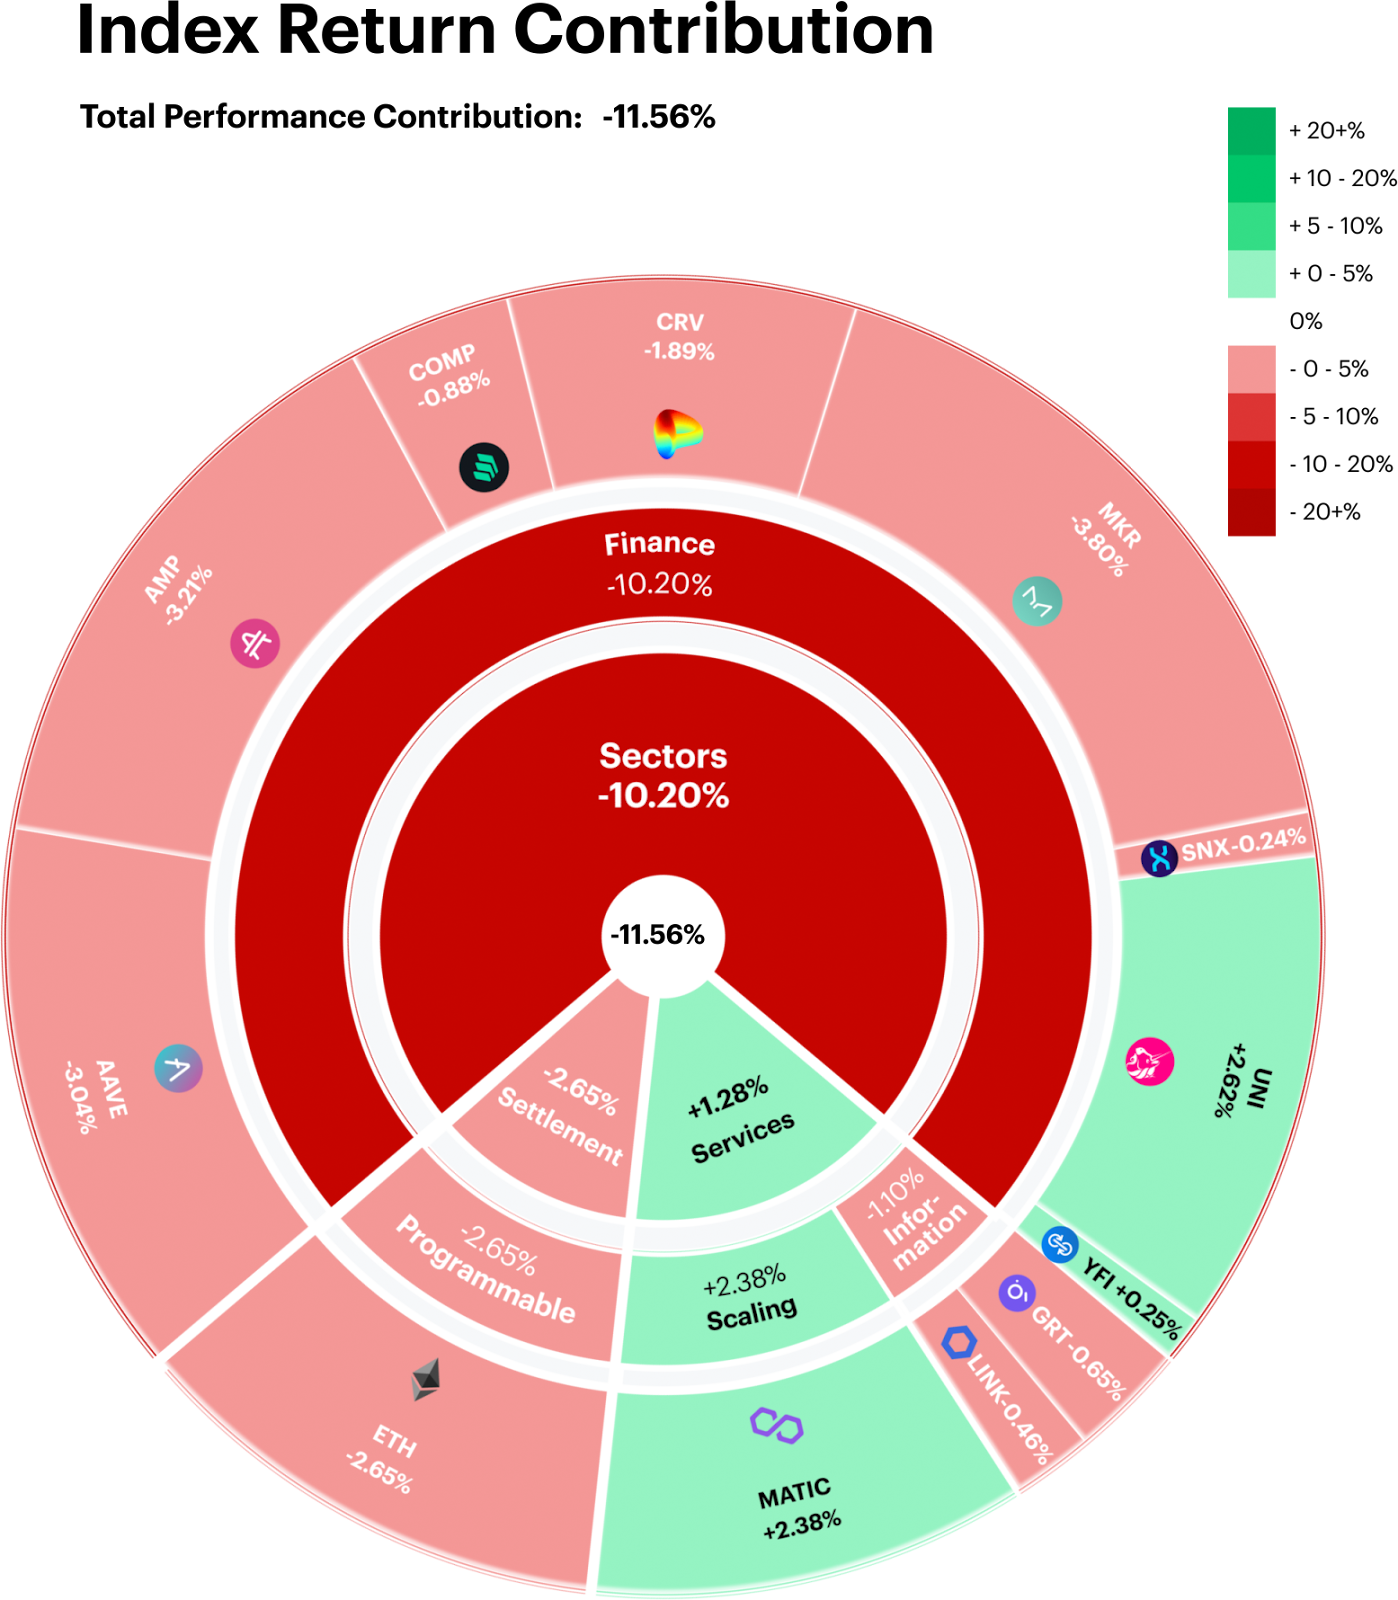
Despite the added tailwinds from the upcoming ETH blockchain upgrade, our DeFi index fell -11.6%. The Level 2 headline segment (Finance) contributed the most (-10.2%) to the index’s decline, with AMP and AAVE contributing to over half of the segment’s total figure.
Meanwhile, the level 2 Scaling segment provided over 230 bps points of positive performance. However, overall segment breadth remained shallow as the MATIC token was solely responsible for contributing all of this positive performance.
Regulatory Risks take Focus
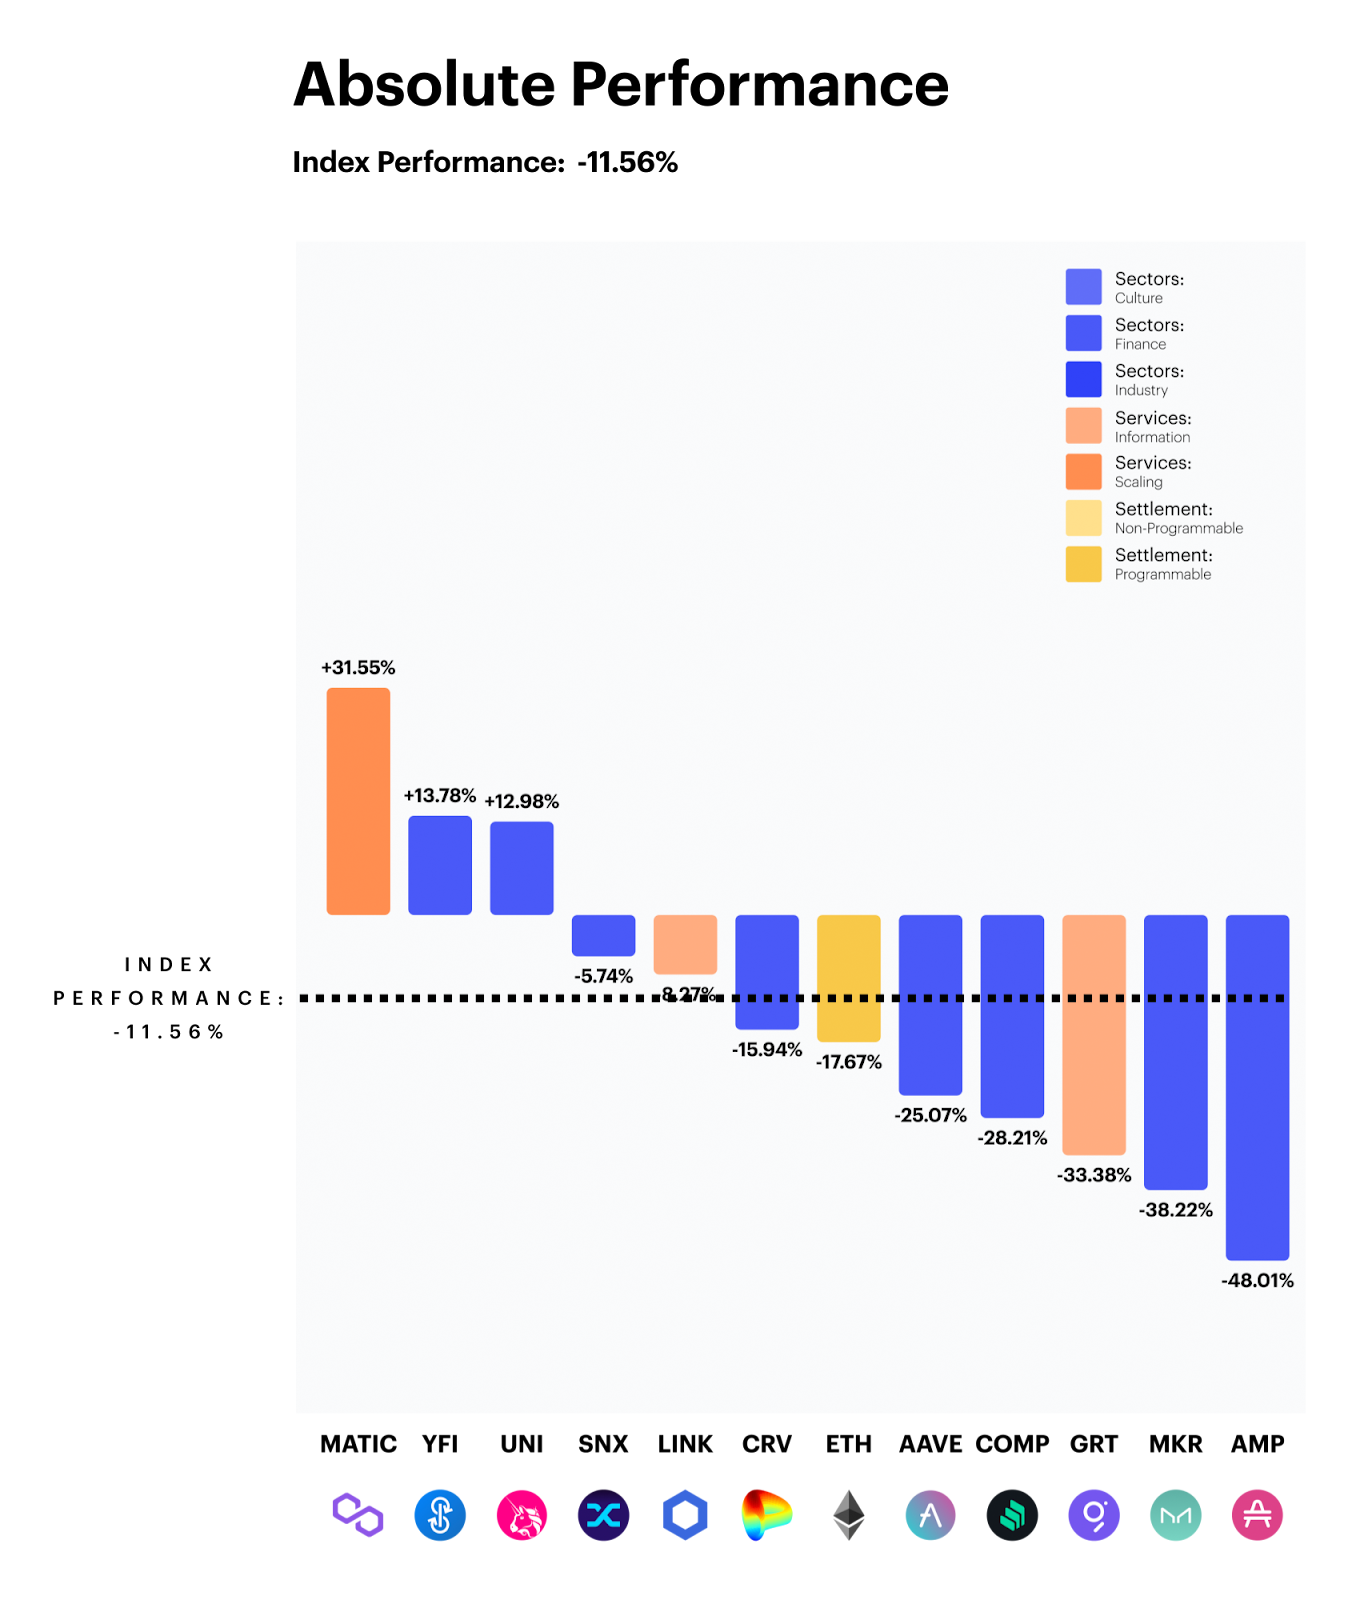
Crypto investors are no strangers to the regulatory challenges that frequently present themselves in the space. Last month, The SEC classified AMP and eight other tokens as securities in a case involving insider trading. The token now trades approximately -30% lower than its previous pre-securitization range, finishing the rebalance period down -48% overall. (These circumstances have deemed AMP ineligible for constituency moving forward.) Investor sentiment has soured due to the fear of higher regulatory standards required for trading securities (as opposed to commodities or digital tokens). COMP and AAVE saw this negative sentiment spill-over with the tokens falling -28% and -25%, respectively. The circumstances have deemed AMP ineligible for constituency moving forward.
Matic, an Ethereum Layer 2 solution, finished up over +31%, and was the top performer in the index. Investors believe that upcoming “Merge” of the Ethereum blockchain will accelerate institutional use-cases. Lastly, UNI and YFI also also caught wind of the merge-momentum, each rallying over 12%.
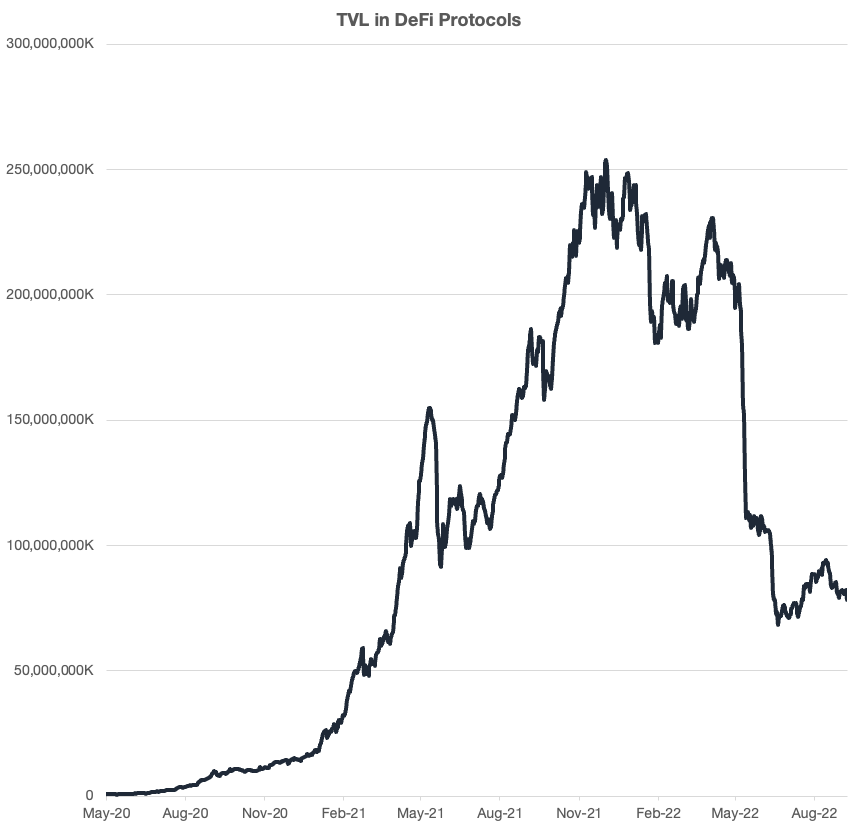
TVL Stabilizes Post Terra
A common metric for measuring the size of the of DeFi market is total value locked (or TVL), which sums the total amount of USD that is currently deposited in DeFi Protocols. By this measure, the market size peaked in late 2021 at just over of $250B. During this period, the crypto bull market led to an exponential increase in developer and investor activity into the space. TVL remained relatively stable until the collapse of the Terra Blockchain and its widely used stablecoin (UST) which sent the DeFi segment into a tailspin this past June.
Protocol locked values have since began to settle in around $50B area. This increase in stability, along with the positive relative price momentum found in the segment’s tokens is creating a more constructive outlook which should lead to added confidence for investors and developers to return back into the DeFi space again.
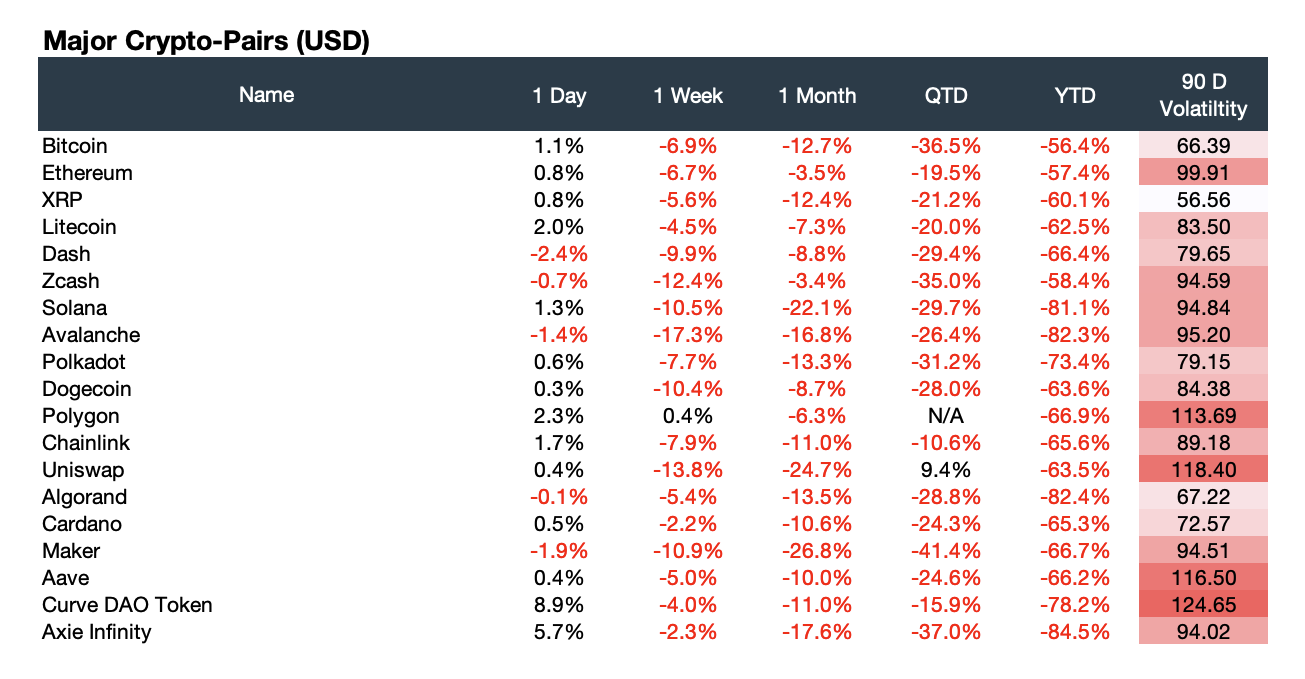
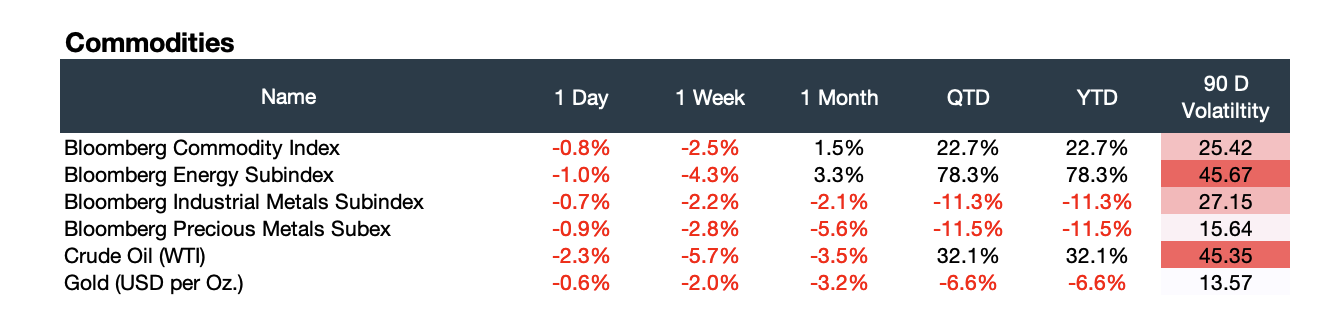
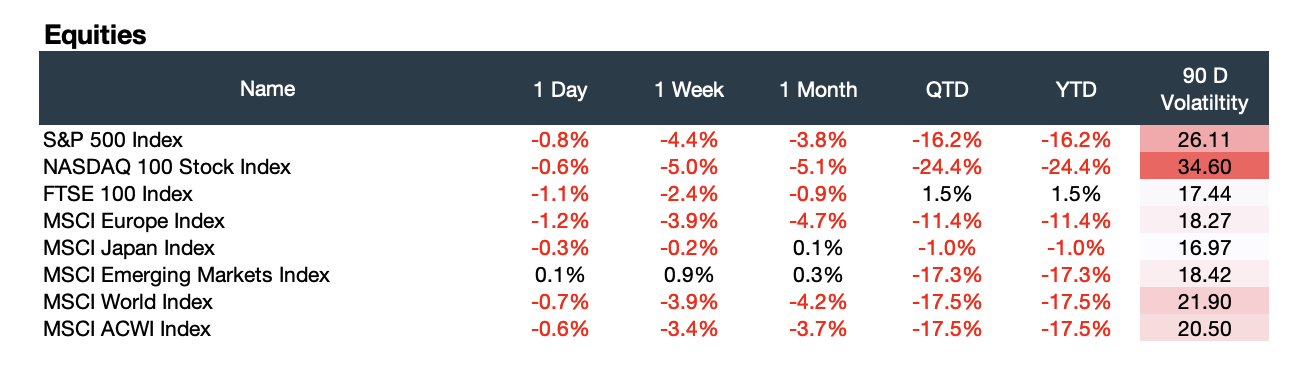
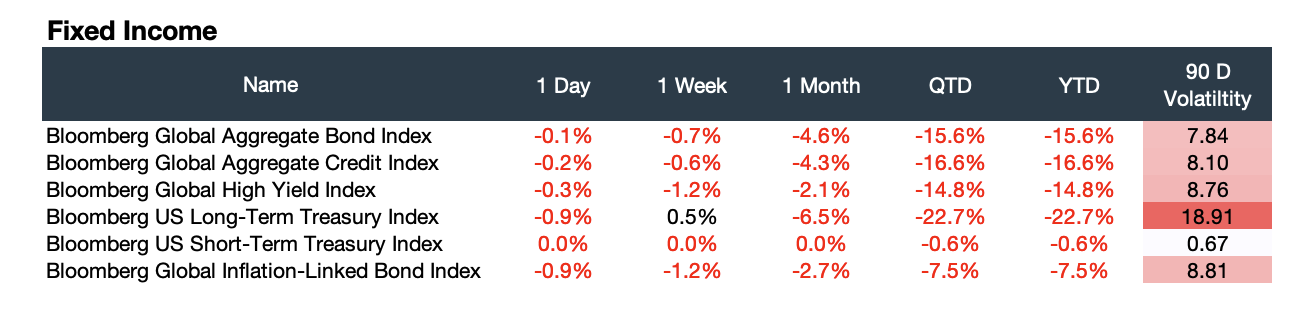
Appendix: Market Performance Overview

Appendix: CF Digital Asset Classification Structure
The CF Digital Asset Classification Structure (DACS) classifies coins and tokens based on the services that the associated software protocol delivers to end users, grouping assets by the role they play in delivering services to end users. The CF DACS powers CF Benchmarks' sector composite and category portfolio indices and allows users to perform attribution analysis to better understand the fundamental drivers of returns within their digital asset portfolios.
Additional Resources
For more information about our CF Benchmark indices and our methodologies, please visit the respective web links below:
- CF Diversified Large Cap Index
- CF DeFi Composite Index
- CF Web 3.0 Smart Contract Platforms Index
- CF Digital Culture Composite Index
- CF Blockchain Infrastructure Index
- CF Cryptocurrency Ultra Cap 5 Index
Contact Us
Have a question or would like to chat? If so, please drop us a line to:
The information contained within is for educational and informational purposes ONLY. It is not intended nor should it be considered an invitation or inducement to buy or sell any of the underlying instruments cited including but not limited to cryptoassets, financial instruments or any instruments that reference any index provided by CF Benchmarks Ltd. This communication is not intended to persuade or incite you to buy or sell security or securities noted within. Any commentary provided is the opinion of the author and should not be considered a personalised recommendation. Please contact your financial adviser or professional before making an investment decision.
Note: Some of the underlying instruments cited within this material may be restricted to certain customer categories in certain jurisdictions.
Changes to the Token Market Price Benchmarks Series - Market Prices – 21 July 2026
The Administrator has confirmed changes to the Token Market Price Family for the period 14 July 2026 to 21 July 2026.

CF Benchmarks
Softer CPI Reprices July Hike Risk & Lifts Digital Assets
Digital assets extended their recovery over the past week as cooler US inflation prints repriced Fed expectations; the bid was broad across the large cap indices, growth factor leadership returned, stablecoin funding repriced lower, and stress stayed isolated in names hit by token-specific news.
Mark Pilipczuk
Notice of the Demising of CF Dai-Dollar Settlement Price and Spot Rate
The Administrator announces that it will demise the CF Dai-Dollar Settlement Price (DAIUSD_RR) and CF Dai-Dollar Spot Rate (DAIUSD_RTI) which are members of the CF Digital Asset Index Family.
CF Benchmarks
By clicking Accept, you consent to CF Benchmarks's use of cookies.
Visit Cookie Settings to learn how CF Benchmarks uses cookies and to adjust your preferences.