
Oct 01, 2025
Fed Easing & SEC Progress Counter Seasonal Weakness
Key takeaways for the month
September 2025 bucked its historical trend of negative price performance, supported by a series of regulatory and macro catalysts. The Fed delivered its first rate cut of the year, reducing rates by 25 bps to 4.00–4.25% and citing rising labor market risks, though forward guidance remained cautious and less definitive than markets had anticipated. The SEC approved generic listing standards for commodity-based trust shares, streamlining the path to list crypto ETPs beyond BTC and ETH. CME announced options on Solana and XRP futures for October, extending institutional-grade positioning and hedging tools. Despite choppy price action, fund flows remained robust at $3.8B for the month, with investor appetite picking up after the FOMC and strong focus on Bitcoin.
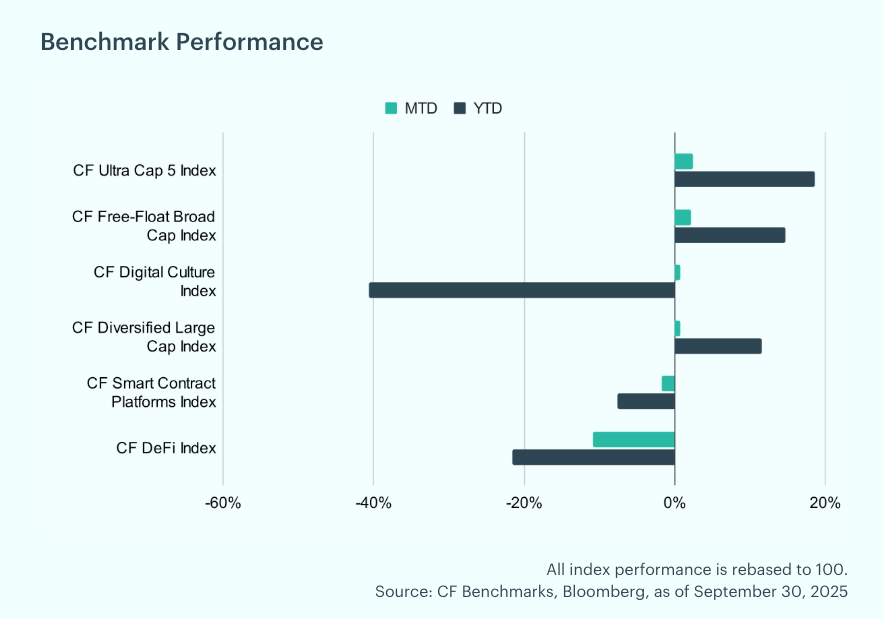
Mega-Cap Strength Returns: Digital asset performance returned to favoring larger-cap tokens again, with the CF Ultra Cap 5 Index leading September's gains, rising 2.41% for the month and lifting its year-to-date return to +18.62%. The CF Free-Float Broad Cap Index added 2.17% (YTD +14.72%), and the CF Diversified Large Cap Index rose 0.70% (YTD +11.60%), while the CF Digital Culture Index edged up 0.78% (YTD −40.59%). Higher-beta cohorts lagged: the CF Smart Contract Platforms Index fell 1.75% (YTD −7.59%), and the CF DeFi Index declined 10.89% (YTD −21.55%). Overall, September favored liquid mega-caps, while DeFi and smart contract names underperformed.
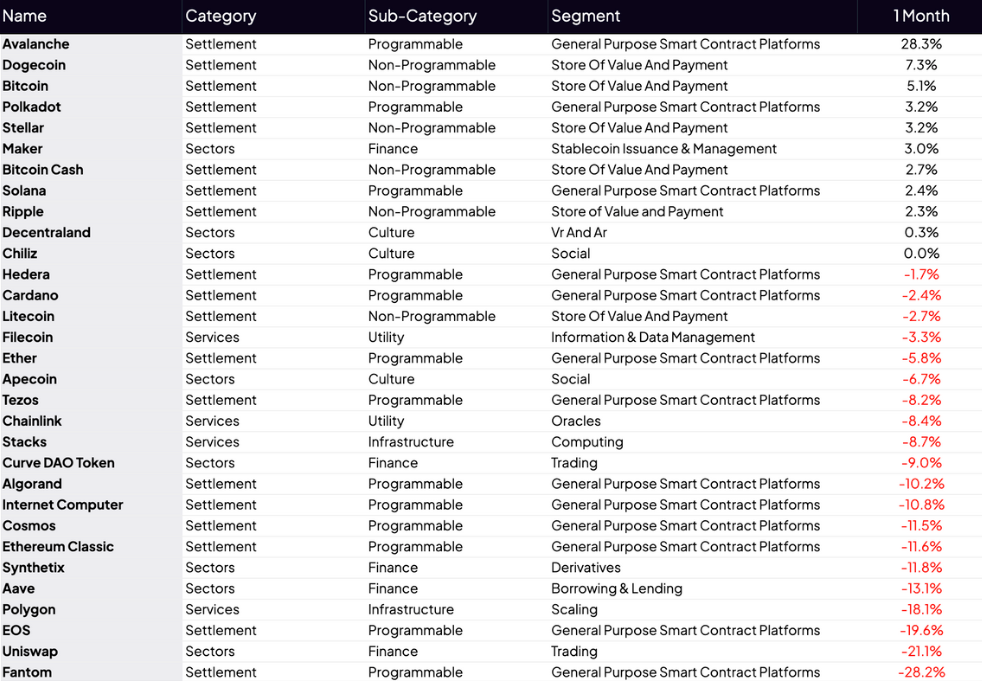
Individual Movers: Avalanche surged 28.3% in September, driven by institutional initiatives including the launch of treasury vehicles to accumulate AVAX. Dogecoin jumped 7.3%, driven by renewed memecoin momentum and optimism around the ETF launch in late September. Fantom slumped 28.2%, weighed down by weak fundamentals and capital outflows. Uniswap fell 21.1%, despite ongoing protocol upgrades and expansion into new chains.
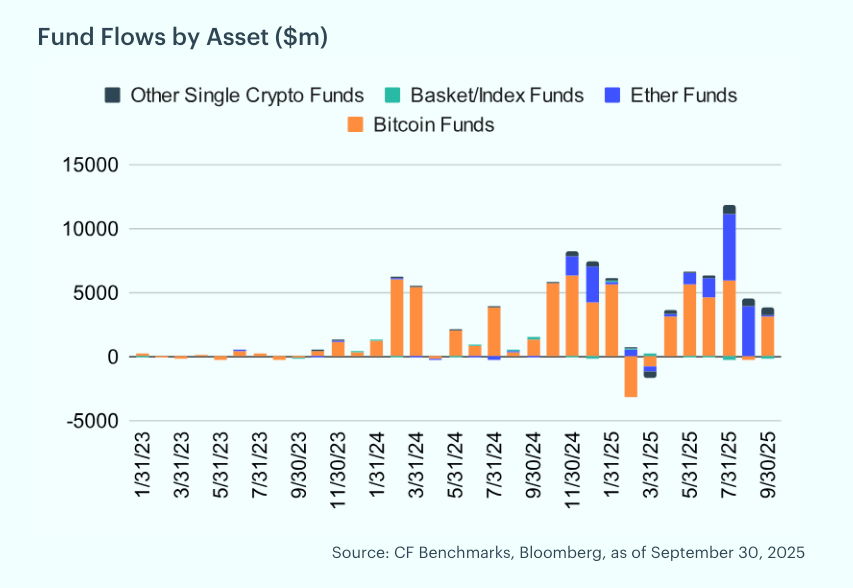
Bitcoin Dominates Monthly Inflows: September saw continued inflows into digital asset funds, with investors allocating roughly $3.8 billion. Bitcoin accounted for the lion’s share at $3.2 billion, while Ether lagged with a more modest $79 million. Regionally, North America dominated activity, recording net inflows of about $4.6 billion, compared to Europe’s $330 million, highlighting the relative strength of U.S. investor demand.
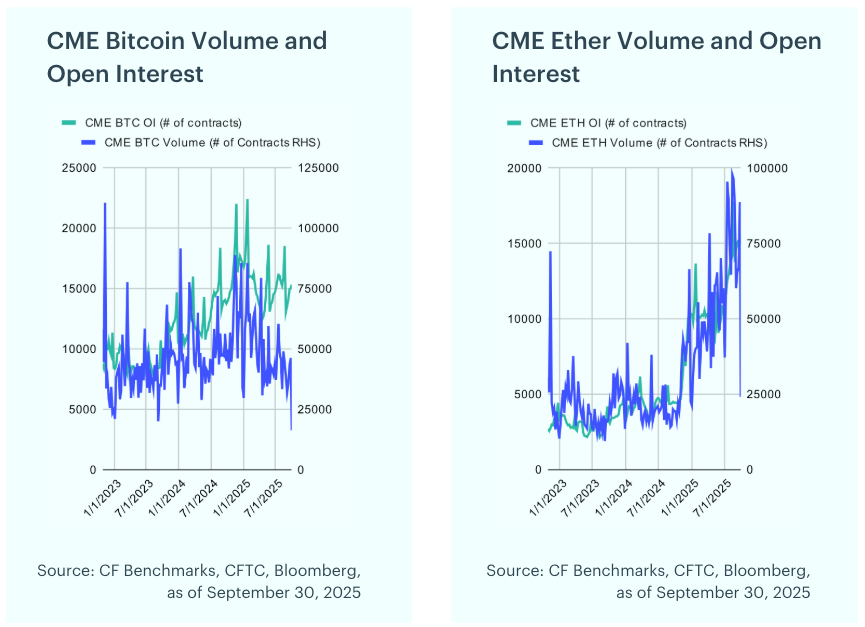
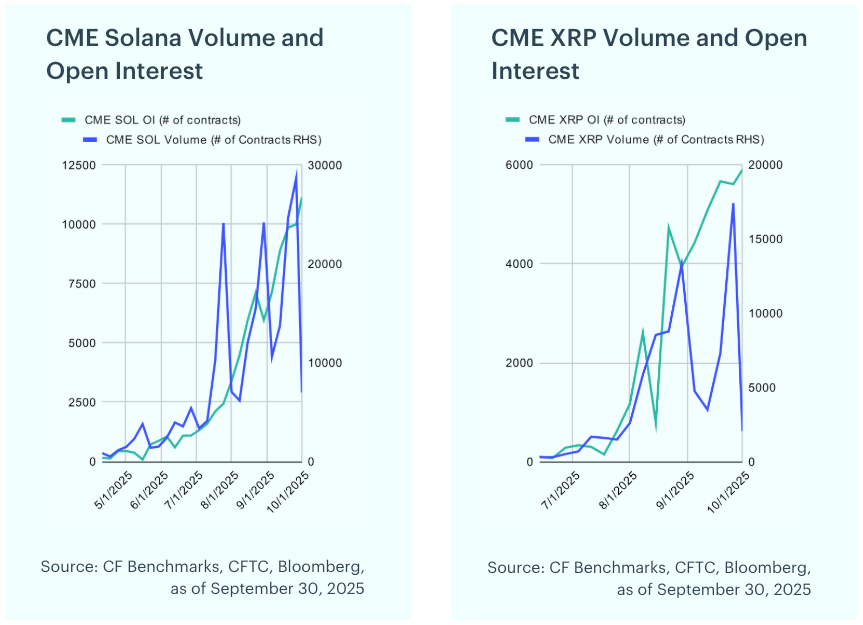
SOL and XRP Futures Lead Open Interest Growth: Bitcoin futures saw strong growth in September, with open interest rising 17.5% from 13,501 to 15,336 contracts. Ether futures also gained momentum, with open interest climbing 13.2% to a record 15,607 contracts, supported by robust trading activity that peaked at 88,733 contracts at month-end. Meanwhile, Solana and XRP futures posted substantial expansion amid heightened investor interest: Solana’s open interest surged 86.6% to 11,146 contracts, with volumes exceeding 24,000 contracts, while XRP’s open interest jumped 50.1% to 5,901 contracts, accompanied by a material increase in trading volumes.
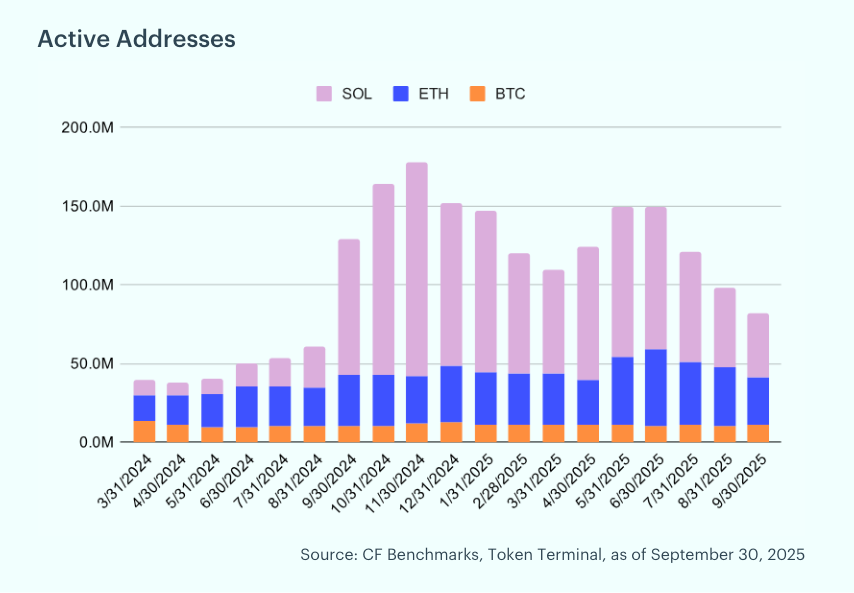
On-Chain Activity Moderates; Bitcoin Holds Steady: Bitcoin’s active addresses in September grew slightly to 10.7 million from 10.5 million in August (1.6%), signaling steady network activity. Ethereum saw a sharp pullback, with active addresses falling from 37.3 million to 30.6 million (-17.8%), reflecting weaker on-chain engagement. Solana experienced the steepest drop, as active addresses declined from 50.0 million to 40.9 million (-18.2%).
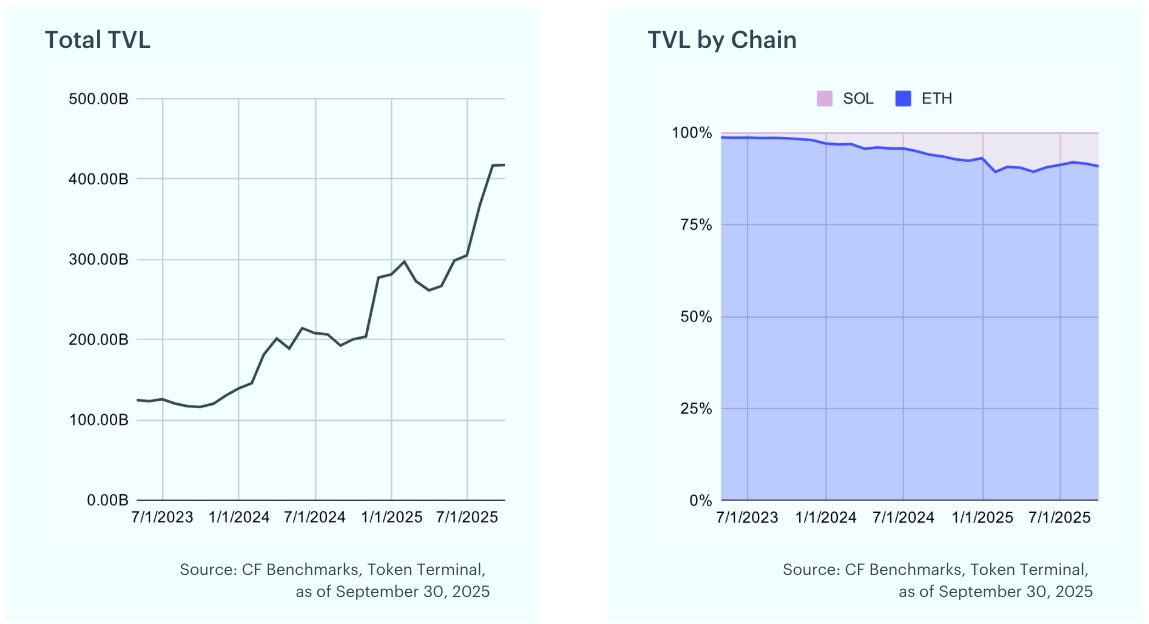
DeFi Growth Pauses at $417B: Total Value Locked (TVL) in DeFi measures the total assets deposited in decentralized finance protocols, expressed in USD. It is a key indicator of the health and growth of the DeFi ecosystem. Over the past month, TVL in DeFi protocols rose just 0.1%, reaching approximately $417 billion. Growth stalled as Ether and Solana pulled back following their recent rally.
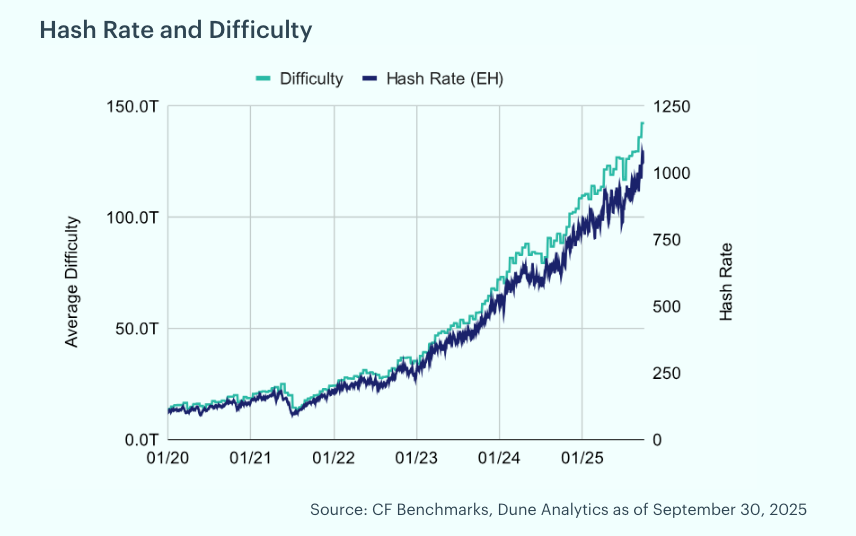
Hash Rate Reaches Record Levels: Bitcoin’s hash rate grew significantly in September, rising 9.7% to 1050 exahashes per second. Mining difficulty, which measures the computational effort required to mine a new block and adjusts to maintain consistent block creation times, increased by 5.1% after a period of faster block times in late September. The next difficulty adjustment, expected in the mid October, is currently projected to be a 0.8% increase.
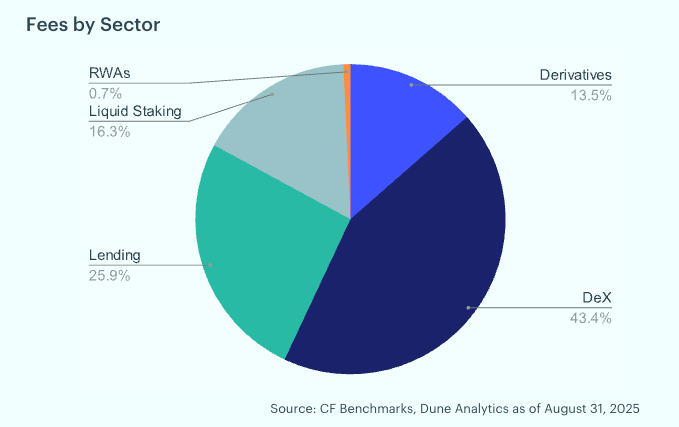
Ethereum Fees Decline 10% as DEX Activity Remains Dominant: Examining Ethereum’s total fees and their sector breakdown offers insight into the use cases driving network revenue. Ethereum layer-1 fees declined 9.7% month-over-month, falling to $35.9 million in September from $39.8 million in August. Decentralized exchanges generated the largest share at 44.7%, followed by lending protocols at 22.7% and liquid staking at 14.7%. Derivatives contributed 17.5%, while real-world asset tokenization accounted for just 0.7%, highlighting the continued dominance of DEX activity in fee generation.
To read the complete report, kindly click on the provided link (or click here to view a PDF version). Additionally, please do not forget to subscribe to our latest news and research for the most relevant institutional insights on digital assets and the top digital assets by market cap.
The information contained within is for educational and informational purposes ONLY. It is not intended nor should it be considered an invitation or inducement to buy or sell any of the underlying instruments cited including but not limited to cryptoassets, financial instruments or any instruments that reference any index provided by CF Benchmarks Ltd. This communication is not intended to persuade or incite you to buy or sell security or securities noted within. Any commentary provided is the opinion of the author and should not be considered a personalised recommendation. Please contact your financial adviser or professional before making an investment decision.
Note: Some of the underlying instruments cited within this material may be restricted to certain customer categories in certain jurisdictions.
Hawkish Fed & Geopolitical Fragility Broaden Drawdown
A hawkish Fed, a 4.2% CPI print, and fragile Iran diplomacy drove a broad, steep drawdown across digital assets in June. Every CF Benchmarks index fell, fund outflows hit a 2026 high near $4.1 billion, and investors stayed defensive as rate-cut hopes faded and the war premium lingered.

Mark Pilipczuk
Changes to the Token Market Price Benchmarks Series - Market Prices – 30 June 2026
Changes to the Token Market Price Benchmarks Series - Market Prices – 30 June 2026.
CF Benchmarks
Implied Volatility Premiums Rise as Macro Risks Loom
Digital assets fell across the board last week as a hotter inflation print and steady ETF outflows met a risk-off market. The decline was uniform, with little to separate large caps; only a value tilt and two DeFi names held up as implied volatility rebuilt a premium.
Mark Pilipczuk
By clicking Accept, you consent to CF Benchmarks's use of cookies.
Visit Cookie Settings to learn how CF Benchmarks uses cookies and to adjust your preferences.