
Jun 19, 2026
Factor Friday - June 19, 2026
Factor Friday: The Drawdown Stalls as Fundamental Factors Take the Lead
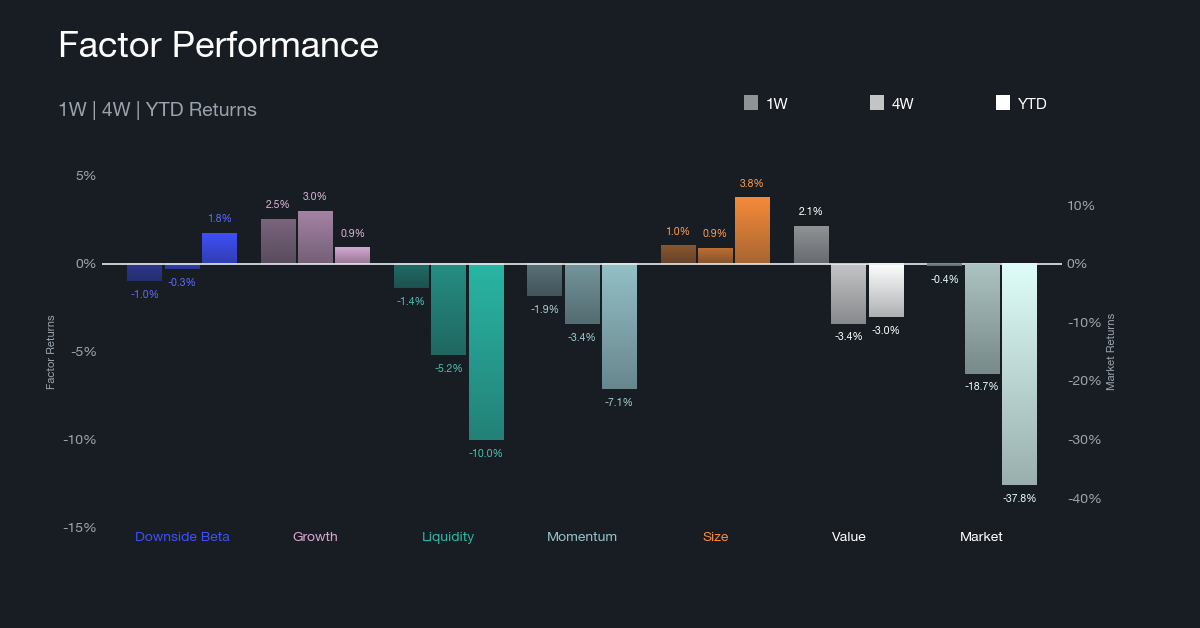
The selloff lost almost all of its momentum this week and leadership rotated back toward fundamental factors. The Market fell just 0.40%, nearly flat after last week's 7.77% decline, trimming the year-to-date drawdown to -37.80%. Growth led all factors at +2.54% after sitting at -2.69% a week ago, reasserting the adoption trade just as it looked to be fading. Value followed at +2.15%, a sharp turn from -2.96%, and Size held positive at +1.03%. Last week's winners gave the move back: Downside Beta swung from +4.15% to -0.98% and Liquidity from +1.94% to -1.40%, both sign-inverted, so the reversals say investors stepped back from the low-drawdown and thin-float trades that performed a week earlier. Momentum stayed at the bottom of the board at -1.86%, extending its run as the weakest factor. Year-to-date, three factors are now positive: Size leads at +3.77%, Downside Beta holds +1.76%, and Growth has crossed back above zero at +0.91%, while Liquidity (-10.05%) and Momentum (-7.14%) are the deepest declines outside Market. For allocators, a stabilizing tape that pays adoption and quality over pure defense is the constructive read, but it is one week against a multi-month downtrend, so the rotation earns a smaller position than a confirmed regime would.
Rolling Factor Rankings and Rotation
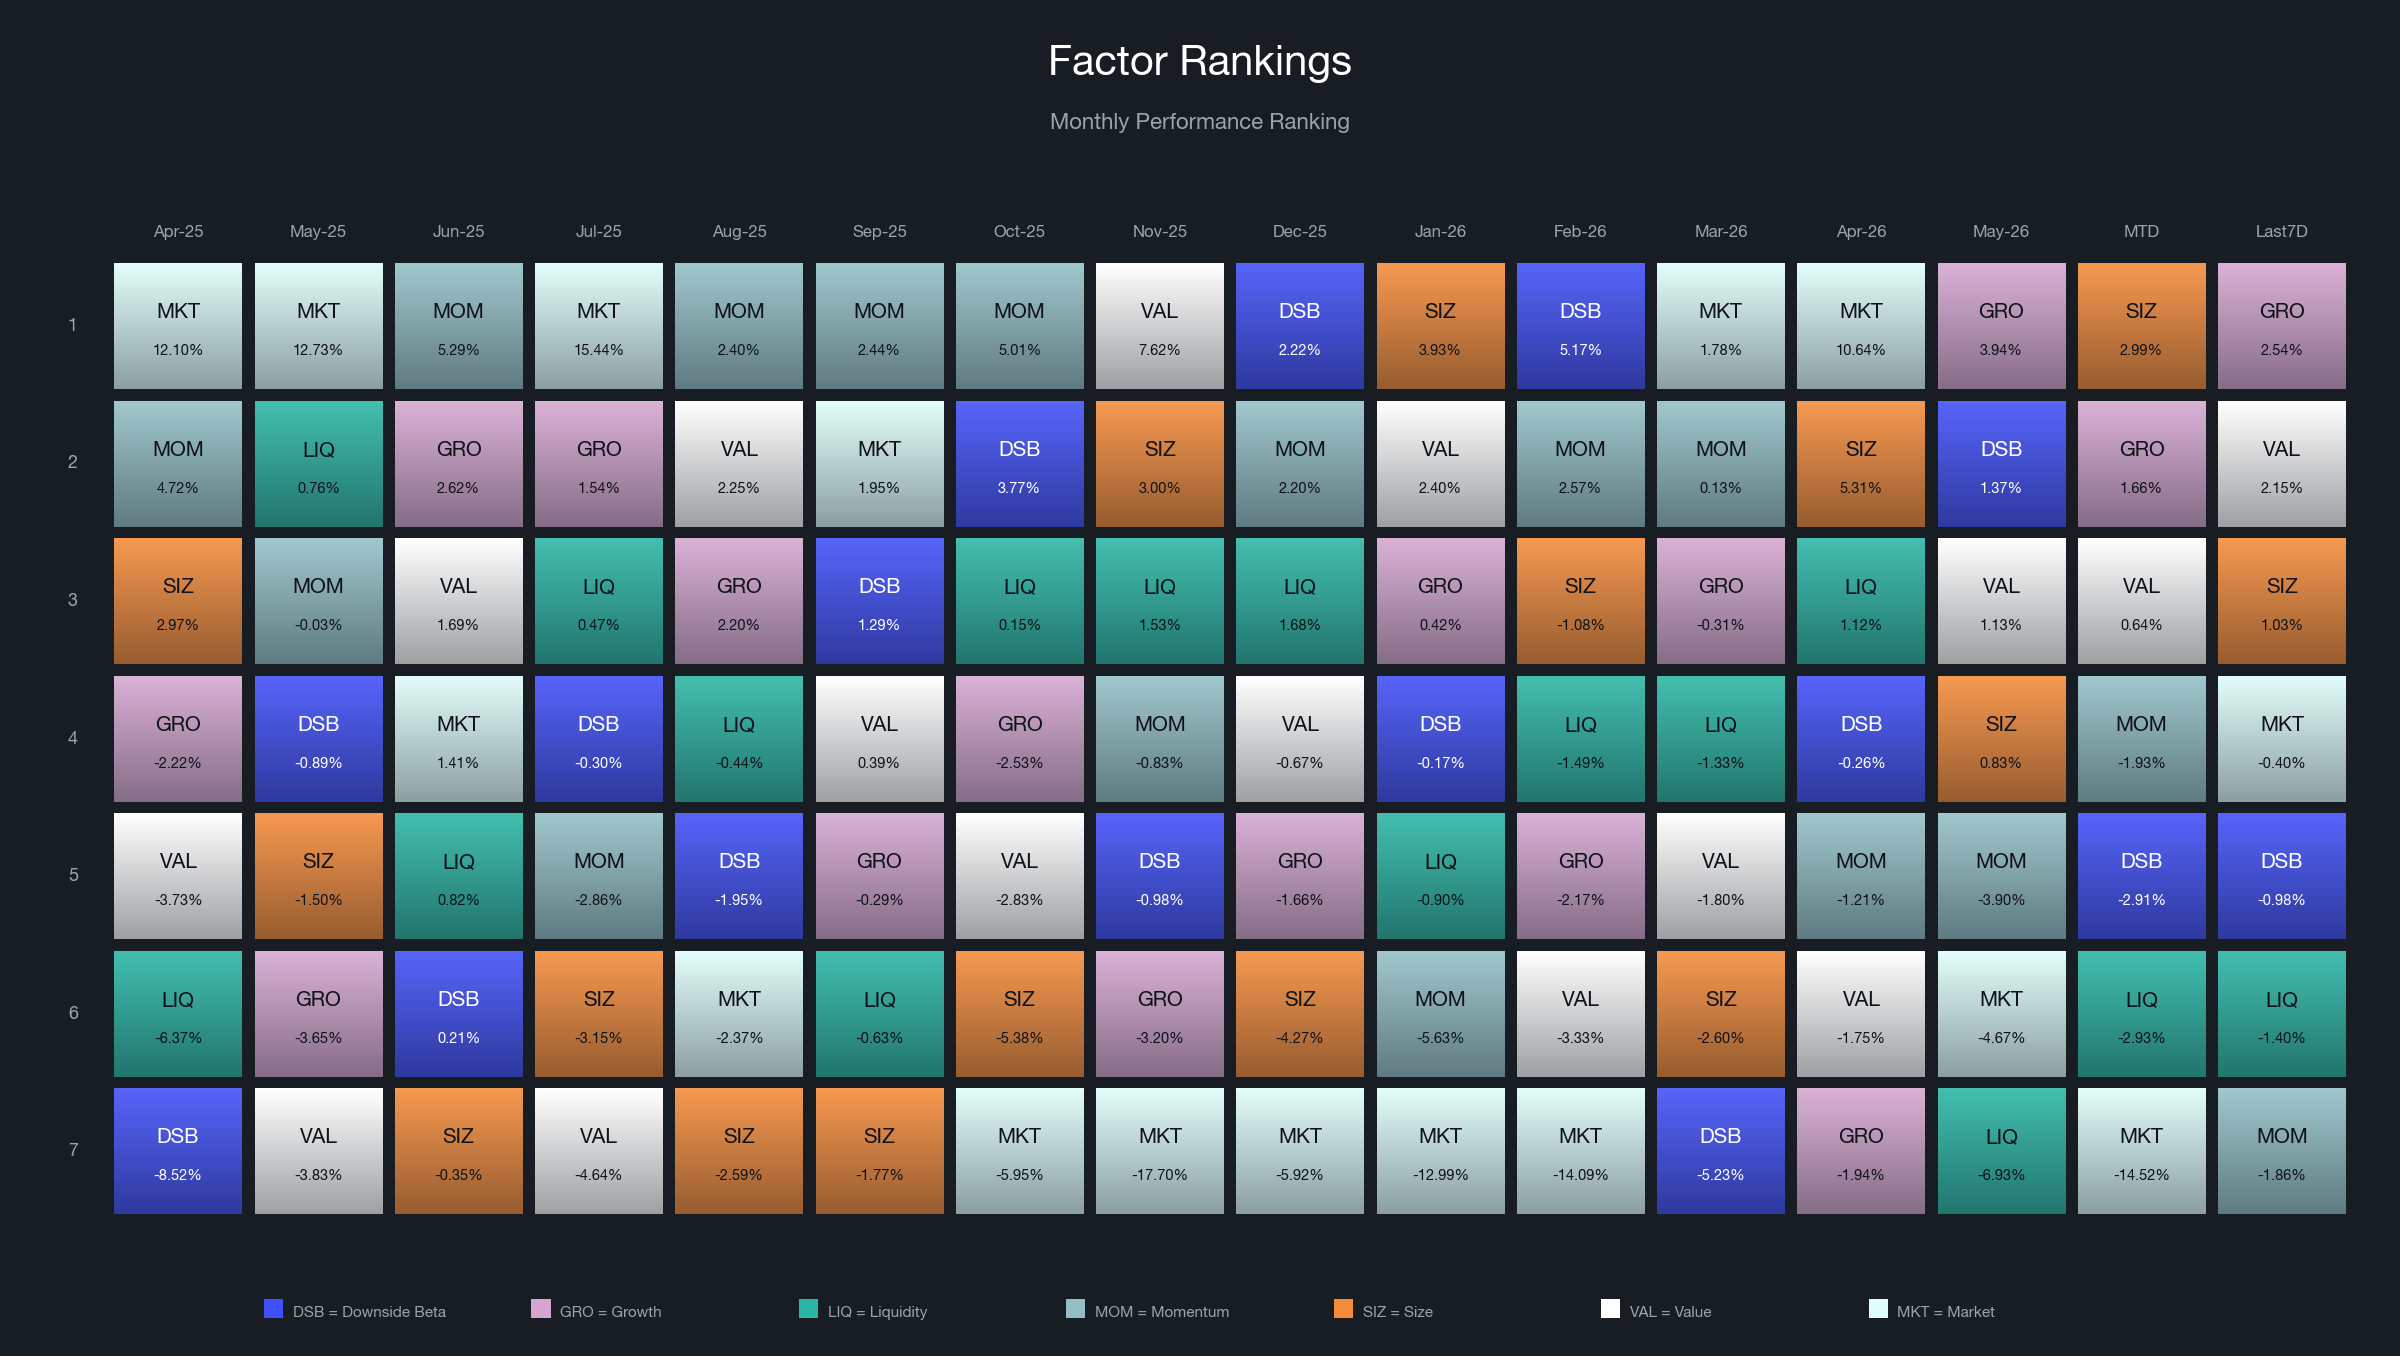
Growth, Value, and Size hold the top three spots, displacing Downside Beta and Liquidity that led seven days ago. Two currents sit beneath the flip. First, Growth has reversed three consecutive weeks of slowing, from +4.33% to +0.63% to -2.69% and now back to +2.54%, so the adoption trade has reasserted rather than broken. Second, the Market factor closed at the bottom of the board again and sits at -14.52% for June month-to-date (MTD), so the tape is still shedding broad exposure even though the weekly pace has nearly flattened. Size keeps the top of the June MTD ranking at +2.99%, with Growth second and Value third, so the small-over-large and fundamentals themes lead on a monthly view as well as this week. The open question is durability: a single week of Growth and Value leadership after a defensive week carries little weight until subsequent outperformance confirms the rotation.
Market and Key Factor Betas
Market Beta
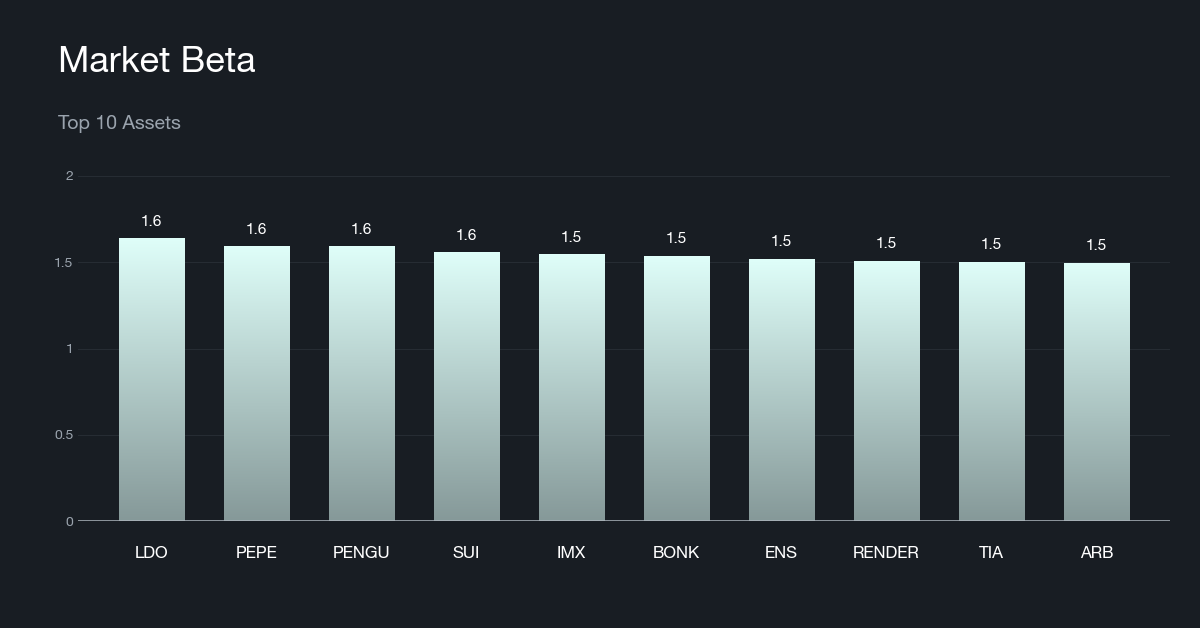
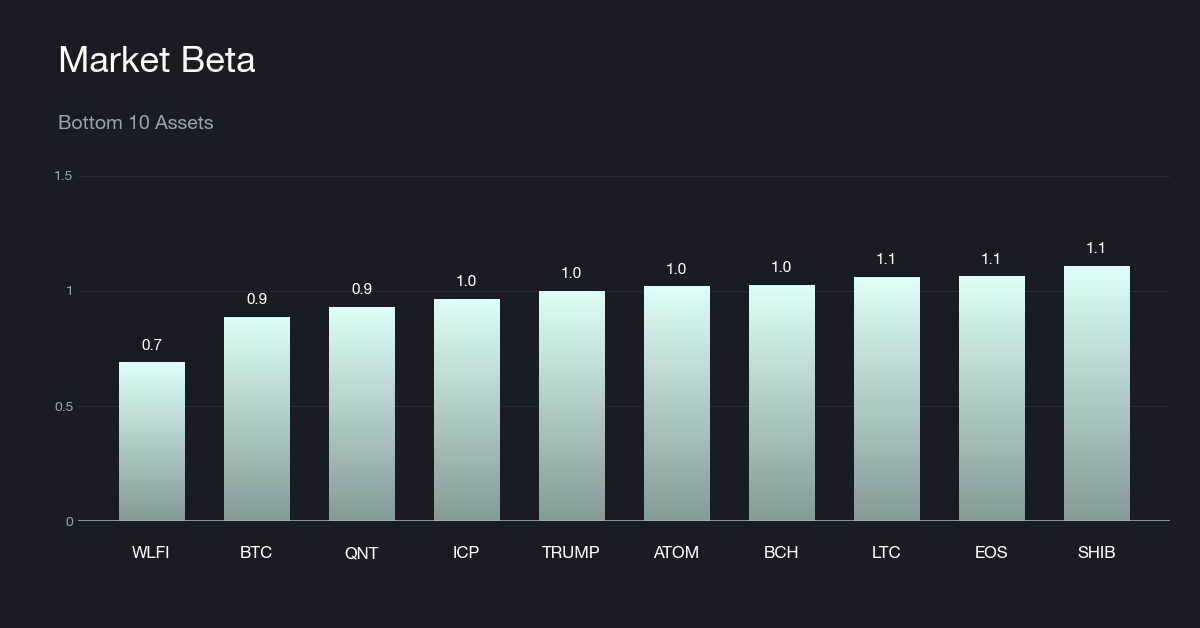
With Market nearly flat, beta did little work this week. The high market-beta cohort, with current betas of roughly 1.5 to 1.6, remains meme coins, layer-2 and infrastructure tokens, and liquid DeFi names; the low-beta cohort is anchored by Bitcoin (BTC) and the older large-cap incumbents, with the newer governance name WLFI now screening as the lowest market beta on the board. Composition was effectively unchanged. The behavioral signal was muted as well: a 0.40% market move leaves almost no gap between high- and low-beta names to exploit, so this week's returns came from the cross-sectional factors rather than from beta dispersion. Low-beta, large-cap-tilted books neither gained nor lost meaningful relative ground this week.
Growth
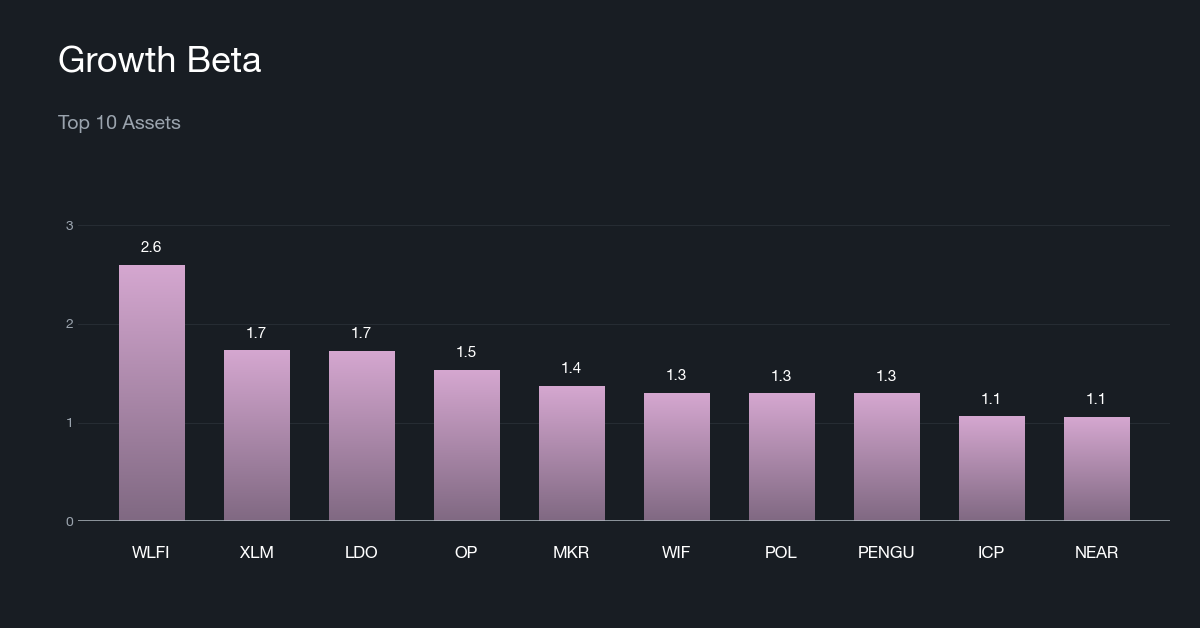
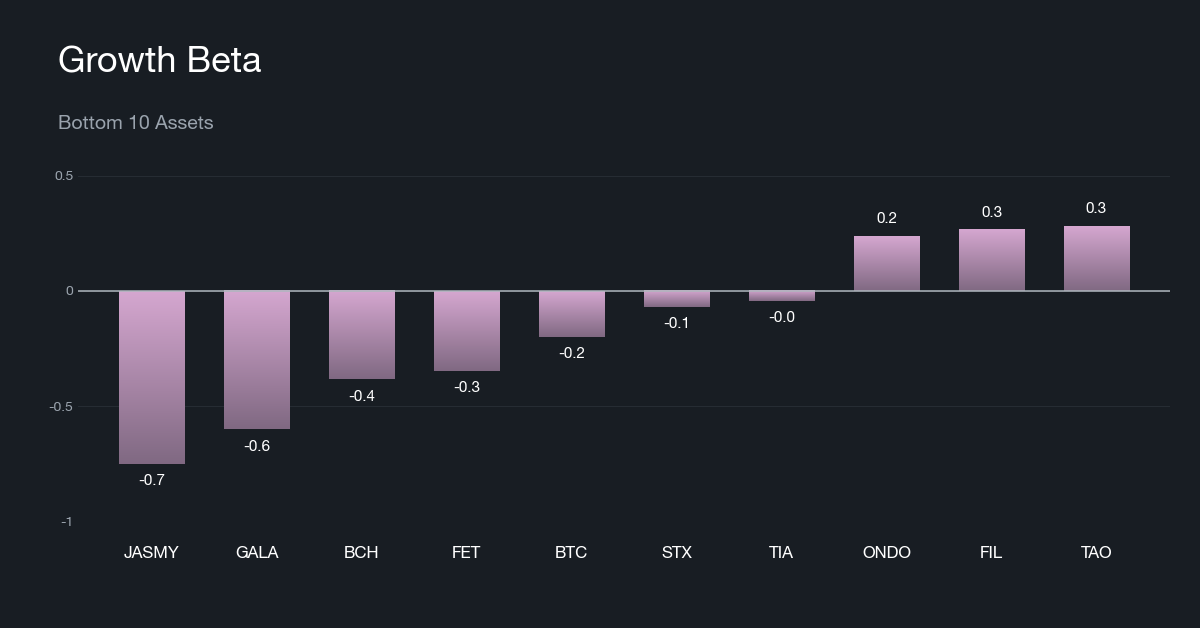
Growth led the board at +2.54% and was the dominant contributor across two of the three DACS categories, so it is worth examining what the factor actually holds. The high growth-beta cohort is led by the governance token WLFI well ahead of the field, and spans payments and interoperability names, large DeFi protocols, and a few meme and mid-cap tokens; the low and negative cohort is concentrated in gaming tokens, older large caps, and Bitcoin. Composition was broadly stable week over week, with TAO rotating into the low cohort as SOL exited. The notable point for allocators is that the high-growth basket tilts toward established interoperability and DeFi networks rather than pure small caps, so this is a quality-of-adoption exposure that can sit closer to the core of a book than a speculative growth tilt would. Screens on expanding network activity and user adoption captured this week's leadership directly.
Size
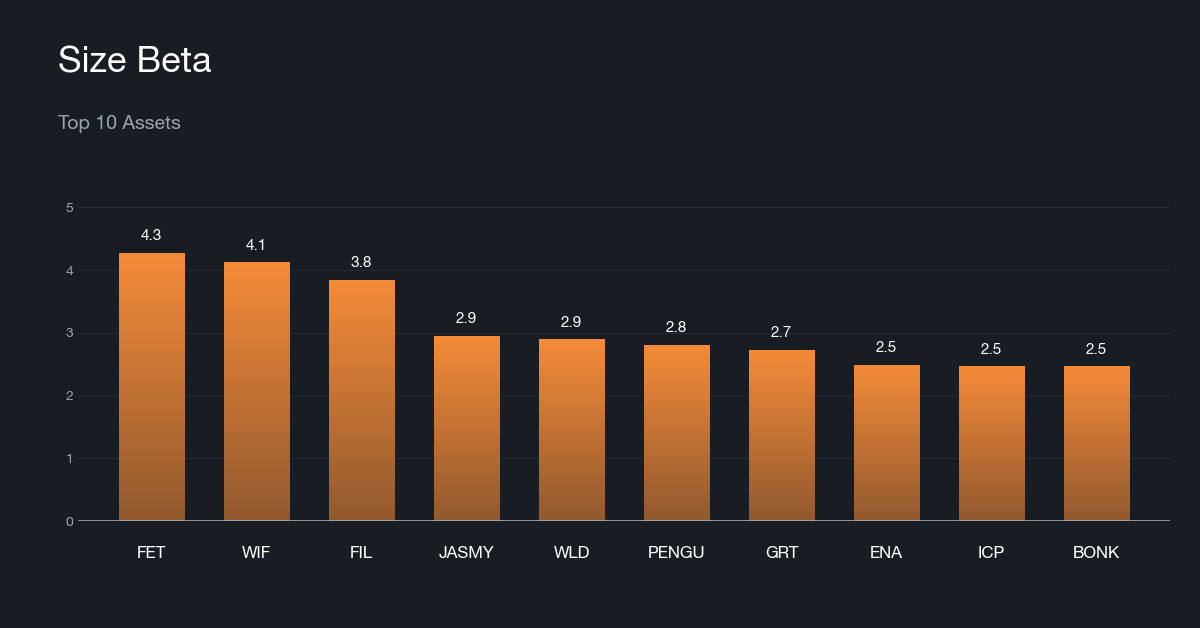
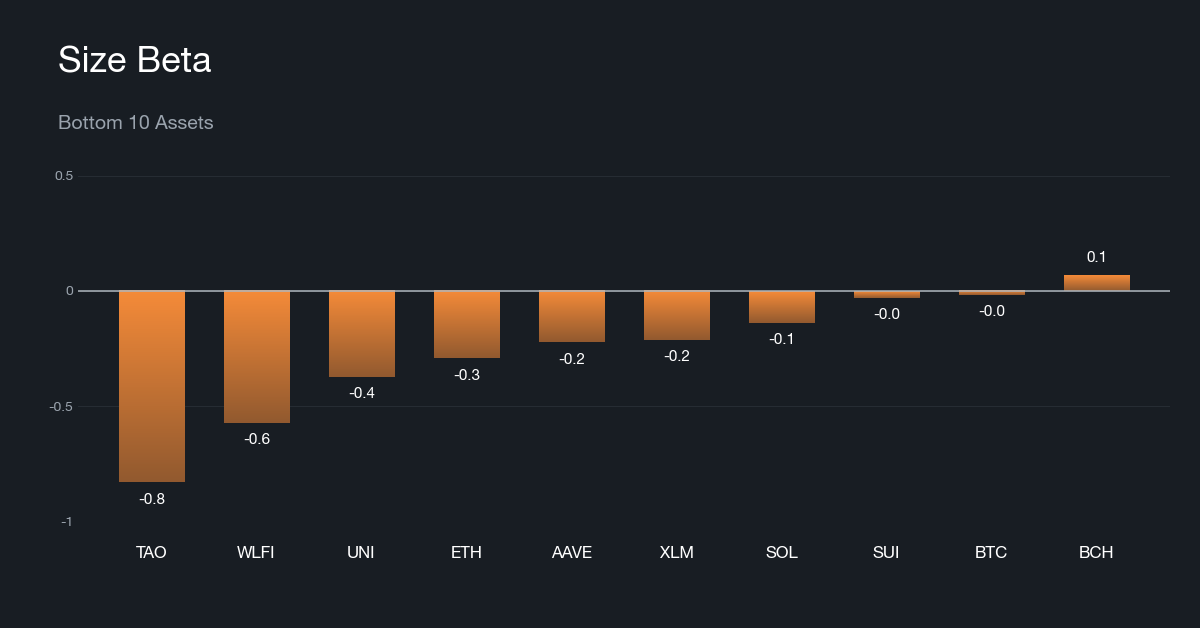
Size is sign-inverted, so the +1.03% print means smaller assets again beat larger ones, and the factor remains the year-to-date and month-to-date leader of the board. The high size-beta cohort is dominated by AI and infrastructure tokens alongside meme and mid-cap names, with betas ranging from roughly 2.5 to above 4; the low and negative cohort is the megacap complex, Bitcoin, Ether (ETH), and Solana (SOL), plus large DeFi names and the AI large cap TAO. The composition shifted only at the margin, with ICP entering the high cohort as SAND dropped out. Small-over-large is the most durable cross-sectional theme of 2026 even when the weekly print is modest, but the exposure buys the high-volatility AI and meme complex, so size tilts carry concentrated idiosyncratic risk and should be sized with that in mind.
What Factors are Driving Markets
This week reverses last week's message of record-wide gaps and fading contributions. Across all three CF DACS classifications the spread between cumulative factor contributions and index returns narrowed, and it narrowed the constructive way: the indices recovered toward where factor selection already sat while contributions strengthened, as Growth and Size both turned positive again. The disconnect that hit record width a week ago began to converge from the favorable side rather than from collapsing indices.
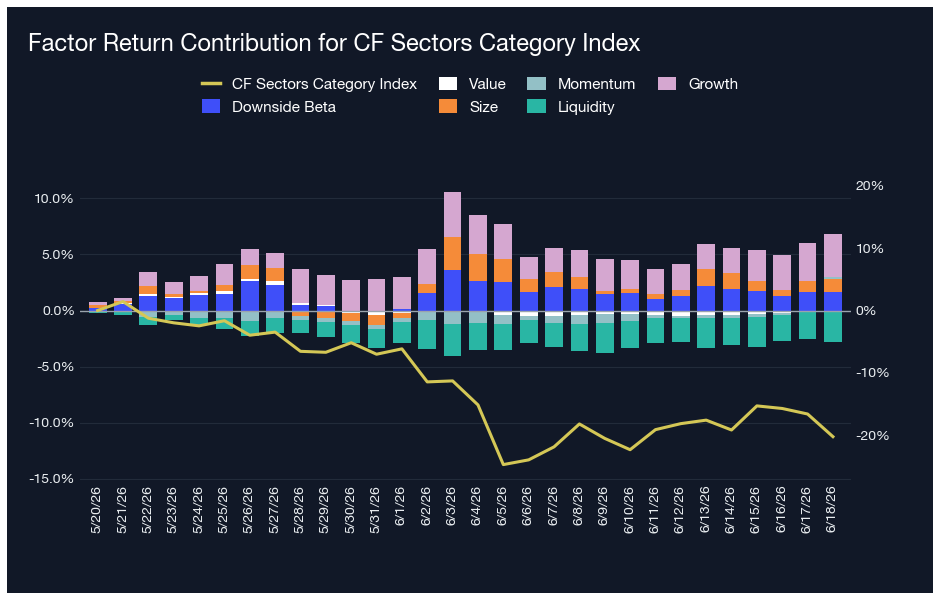
Sectors shows the turn clearly. Cumulative factor contributions totaled +4.09% against an index return of -20.26%, a gap of 24.35 percentage points (pp) with contributions ahead, narrower than last week's 28.35 pp. Beneath the narrower gap, total contributions rose from +0.86% to +4.09% as Growth (+3.88%) led and Size (+1.11%) returned to the positive side; Liquidity (-2.62%) was the largest drag. The gap is tighter and the support behind it is broader.
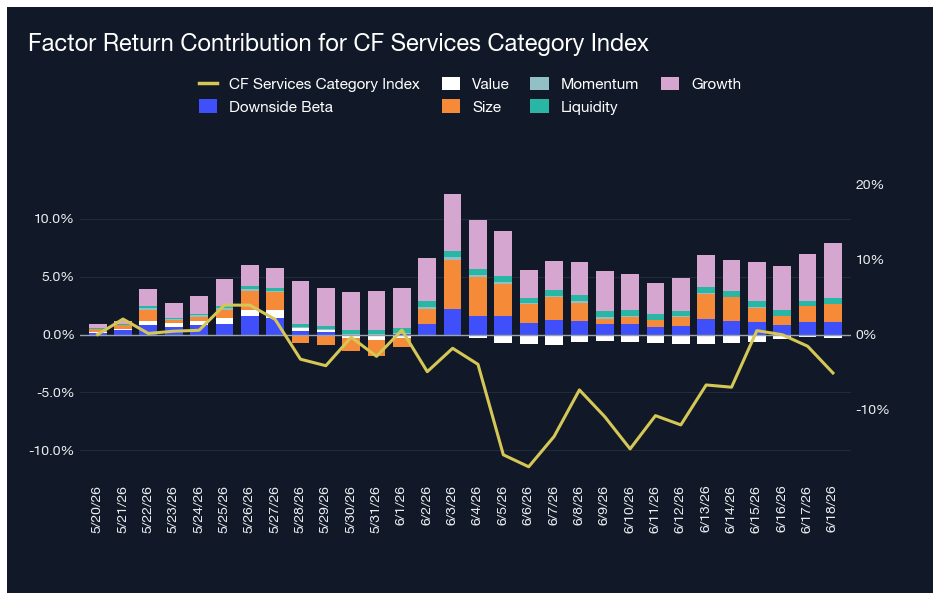
Services delivered the sharpest convergence. Contributions totaled +7.55% against a -5.14% index return, a 12.69 pp gap versus 21.67 pp last week, as the index recovered from -19.13% to -5.14%. Growth led at +4.71% and Size swung back to +1.57%, with Value (-0.26%) the only meaningful drag. Factor positioning has cushioned this category most through the drawdown, and the cushion is now broad-based rather than resting on Growth alone.
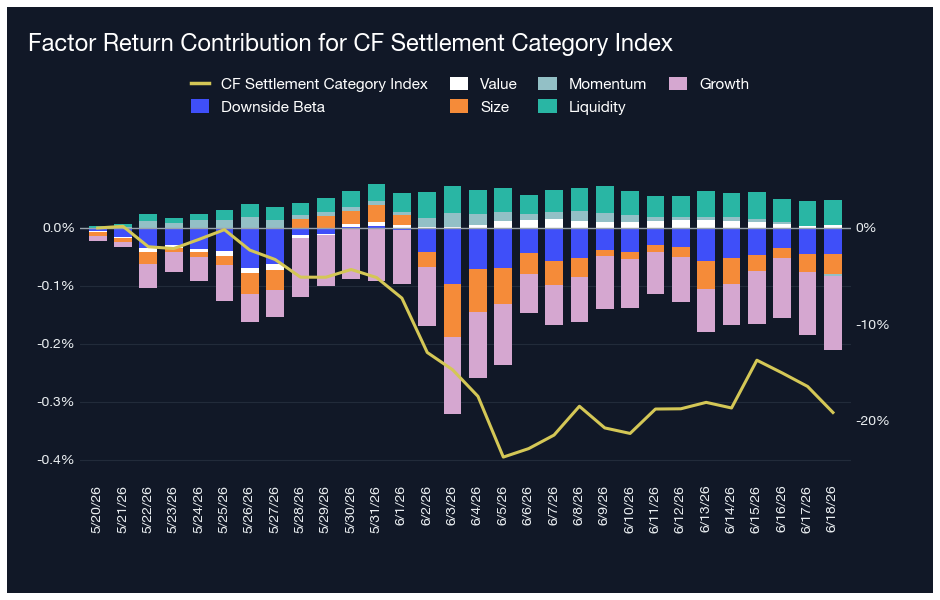
Settlement remains the quiet category. Contributions were essentially flat at -0.16% against a -19.12% index return, a 18.96 pp gap versus 23.15 pp last week, with every factor muted, consistent with the category's concentration in large, established settlement assets. Together the three categories send the opposite message from last week: gaps narrowing, contributions broadening beyond Growth. If indices keep recovering while contributions hold, the disconnect converges constructively rather than the destructive convergence flagged a week ago. Growth remains the load-bearing contributor, now with Size support returning across the cap structure.
Appendix: CF Factor Methodology
Market Factor
The market factor captures the broad, systematic risk that permeates the digital asset ecosystem. It reflects aggregate influences such as macroeconomic conditions, investor sentiment, and overall market volatility. As such, this factor is defined by the daily returns of the CF Broad Cap (Free Float Market Cap Weight) Index, offering a comprehensive and capitalization-weighted representation of the asset class.
Size Factor
The size factor captures the return differential associated with asset scale, reflecting the hypothesis that smaller-cap digital assets tend to outperform their larger-cap counterparts. This effect is understood to compensate for elevated operational and financial risks while exploiting potential market inefficiencies. In this framework, the size factor is defined by each asset’s fully diluted market capitalization. The value is sign-inverted so that higher z-scores are assigned to smaller assets and vice-versa.
Value Factor
The value factor reflects a protocol’s ability to generate economic output relative to its capital base and market valuation, combining measures of both efficiency and user engagement. It is constructed as the average z-score of two key ratios: transaction fees relative to total value locked (Fees/TVL) and daily active users relative to market capitalization (DAU/MCap). This composite metric captures how productively a protocol utilizes its resources while also serving as a proxy for user-driven demand. A higher combined score indicates efficient resource utilization and strong user engagement.
Momentum Factor
The momentum factor captures short-term price persistence by identifying assets that have recently exhibited strong performance. It is computed as the average z-score of two metrics: the 2 weeks cumulative performance and the 2 weeks risk-adjusted cumulative performance. This approach aligns with established findings in traditional financial literature and demonstrates empirical relevance in digital assets, where price trends tend to exhibit momentum over short horizons.
Growth Factor
The growth factor captures the expansion of a protocol’s network activity and user adoption. In the context of digital assets, it reflects metrics such as fee generation and user engagement, which serve as indicators of increased platform utilization and operational scale. The factor is defined as the average z-score of 30-day fee growth and 30-day weekly active user growth, thereby identifying assets exhibiting consistent and measurable increases in underlying network usage.
Downside Beta
The downside beta factor captures an asset’s sensitivity to adverse market conditions by isolating its behavior during periods of negative market returns. Empirical evidence shows that assets with lower downside beta tend to outperform their higher-beta counterparts over the long-term, due to their reduced participation in market drawdowns and more stable return profiles during periods of elevated volatility. As such, it is estimated through a regression of the asset’s daily returns over the most recent four-week period against market returns observed exclusively during negative sessions. The resulting value is sign-inverted to ensure that assets with lower downside exposure are assigned higher z-scores.
Liquidity Factor
The liquidity factor captures the ease with which a digital asset can be traded without significantly impacting its price. Empirical evidence shows that illiquid assets tend to command a higher risk premium than their more liquid counterparts, serving as compensation for trading friction and price volatility. To quantify this, the factor is measured using token turnover, defined as trading volume as a percentage of circulating supply. The value is sign-inverted such that higher z-scores are assigned to less liquid assets.
For further detail, view the CF Factors Methodology Document, the CF Factor Data Suite, and Our paper “A Factor Model for Digital Assets” in Springer Nature’s Mathematical Research for Blockchain Economy
The information contained within is for educational and informational purposes ONLY. It is not intended nor should it be considered an invitation or inducement to buy or sell any of the underlying instruments cited including but not limited to cryptoassets, financial instruments or any instruments that reference any index provided by CF Benchmarks Ltd. This communication is not intended to persuade or incite you to buy or sell security or securities noted within. Any commentary provided is the opinion of the author and should not be considered a personalised recommendation. Please contact your financial adviser or professional before making an investment decision.
Note: Some of the underlying instruments cited within this material may be restricted to certain customer categories in certain jurisdictions.
Factor Friday - July 10, 2026
The relief rally extended for a second week with Market +2.27%, but the real story is risk appetite: Liquidity led styles at +1.51% as thinner, less liquid names caught a bid. Value paused at -0.79% yet still leads over four weeks. Defensive tilts kept unwinding into the bounce.

Mark Pilipczuk
2026 Mid-Year Market Outlook
Iran risk, regulatory policy, Bitcoin rebalancing, tokenization, and protocol revenue are reshaping the outlook. Growth is narrowing, but regulatory progress and productive on-chain activity create offsets. Dispersion, not broad beta, should define the next year.
Gabriel Selby
Changes to the Token Market Price Benchmarks Series - Market Prices – 07 July 2026
The Administrator has confirmed changes to the Token Market Price Family for the period 30 June 2026 to 07 July 2026.
CF Benchmarks
By clicking Accept, you consent to CF Benchmarks's use of cookies.
Visit Cookie Settings to learn how CF Benchmarks uses cookies and to adjust your preferences.