
Oct 26, 2026
Digital Assets Remain Flat as Tech Sells Off
Weekly Index Highlights, October 26, 2026
Digital assets traded mixed over the past week, ending close to where they started after an intraweek round trip. Bitcoin (BTC) climbed back above its 50-day moving average into Wednesday, then gave the move back as Thursday's sell-off in AI-linked equities coincided with the week's largest daily decline at the New York close, leaving the CME CF Crypto Market Index (CMI) at -0.08% while breadth improved sharply on the prior week. In the futures market the move showed up as carry rather than price: annualized basis fell across every listed CME Bitcoin contract, with the front end compressing most.
Market Performance Update
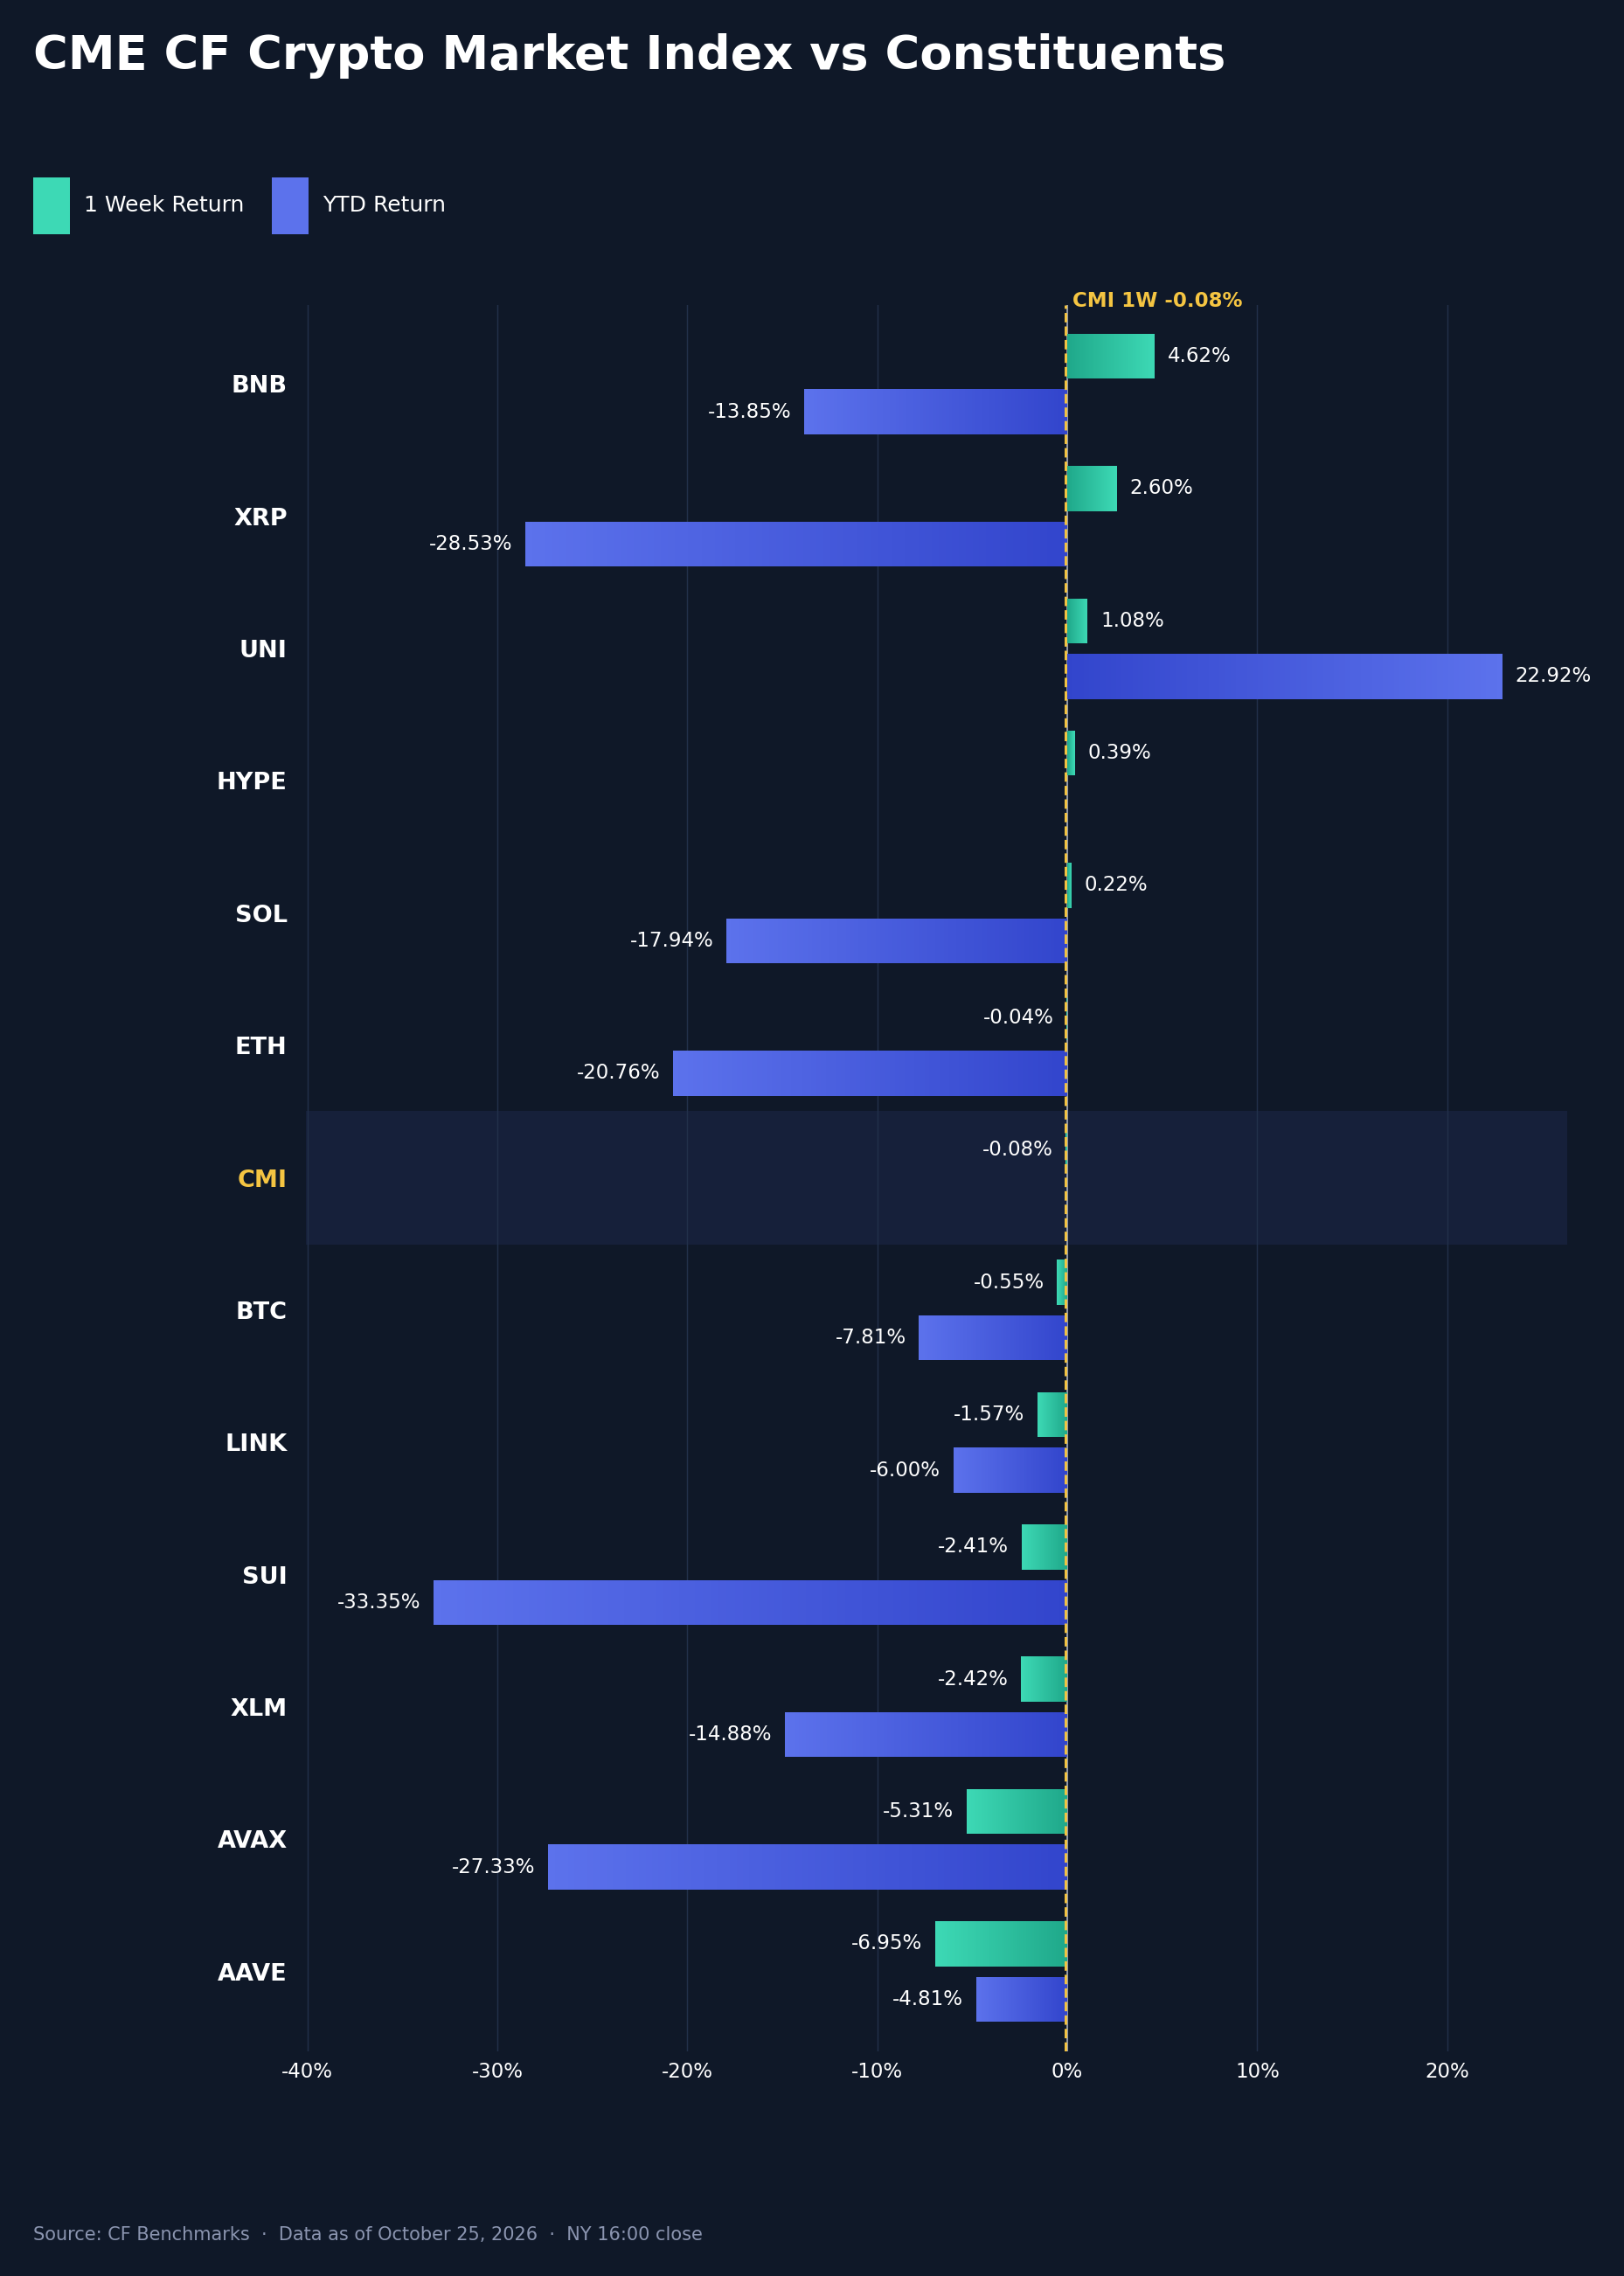
The CME CF Crypto Market Index (CMI), the measure of the market in this section, slipped 0.08% week-on-week (w/w) from October 18th to October 25th, after a 4.65% decline a week earlier. Six of its twelve constituents beat the market. BNB (BNB) led with a 4.69 percentage point (pp) outperformance, returning +4.62%, followed by XRP (XRP) at +2.67pp, Uniswap (UNI) at +1.15pp, Hyperliquid (HYPE) at +0.47pp and Solana (SOL) at +0.30pp, while Ether (ETH) tracked the index at +0.04pp. Bitcoin (BTC) lagged by 0.47pp with a 0.55% decline, and the underperformance widened down the list: Chainlink (LINK) -1.49pp, Sui (SUI) and Stellar (XLM) each -2.34pp, Avalanche (AVAX) -5.23pp and Aave (AAVE) -6.87pp. The spread between the best and worst relative performers, BNB and AAVE, was 11.56pp. Because BTC is nearly three quarters of the index, its lag subtracted 0.40pp from the market return, and the rest of the basket, led by BNB and XRP, added back 0.32pp. On a year-to-date (YTD) basis BTC is down 7.81%, ahead of ETH at -20.76% and SOL at -17.94%, with UNI the standout at +22.92%. The tape was risk-asset led rather than rate led. BTC printed its strongest fix of the week on Wednesday, $84,384.71, above its 50-day average near $81,800, as equities rallied, then fell 3.64% into Thursday's close as the Nasdaq dropped 2.6% on AI capital spending concerns, even as the 10-year Treasury yield fell about 17 basis points (bps). With no Fed speakers during the blackout and the week's US data offering no major surprise, BTC closed Sunday at $80,491.95, back below the 50-day average and well above the 200-day near $72,900.
Volatility Analysis
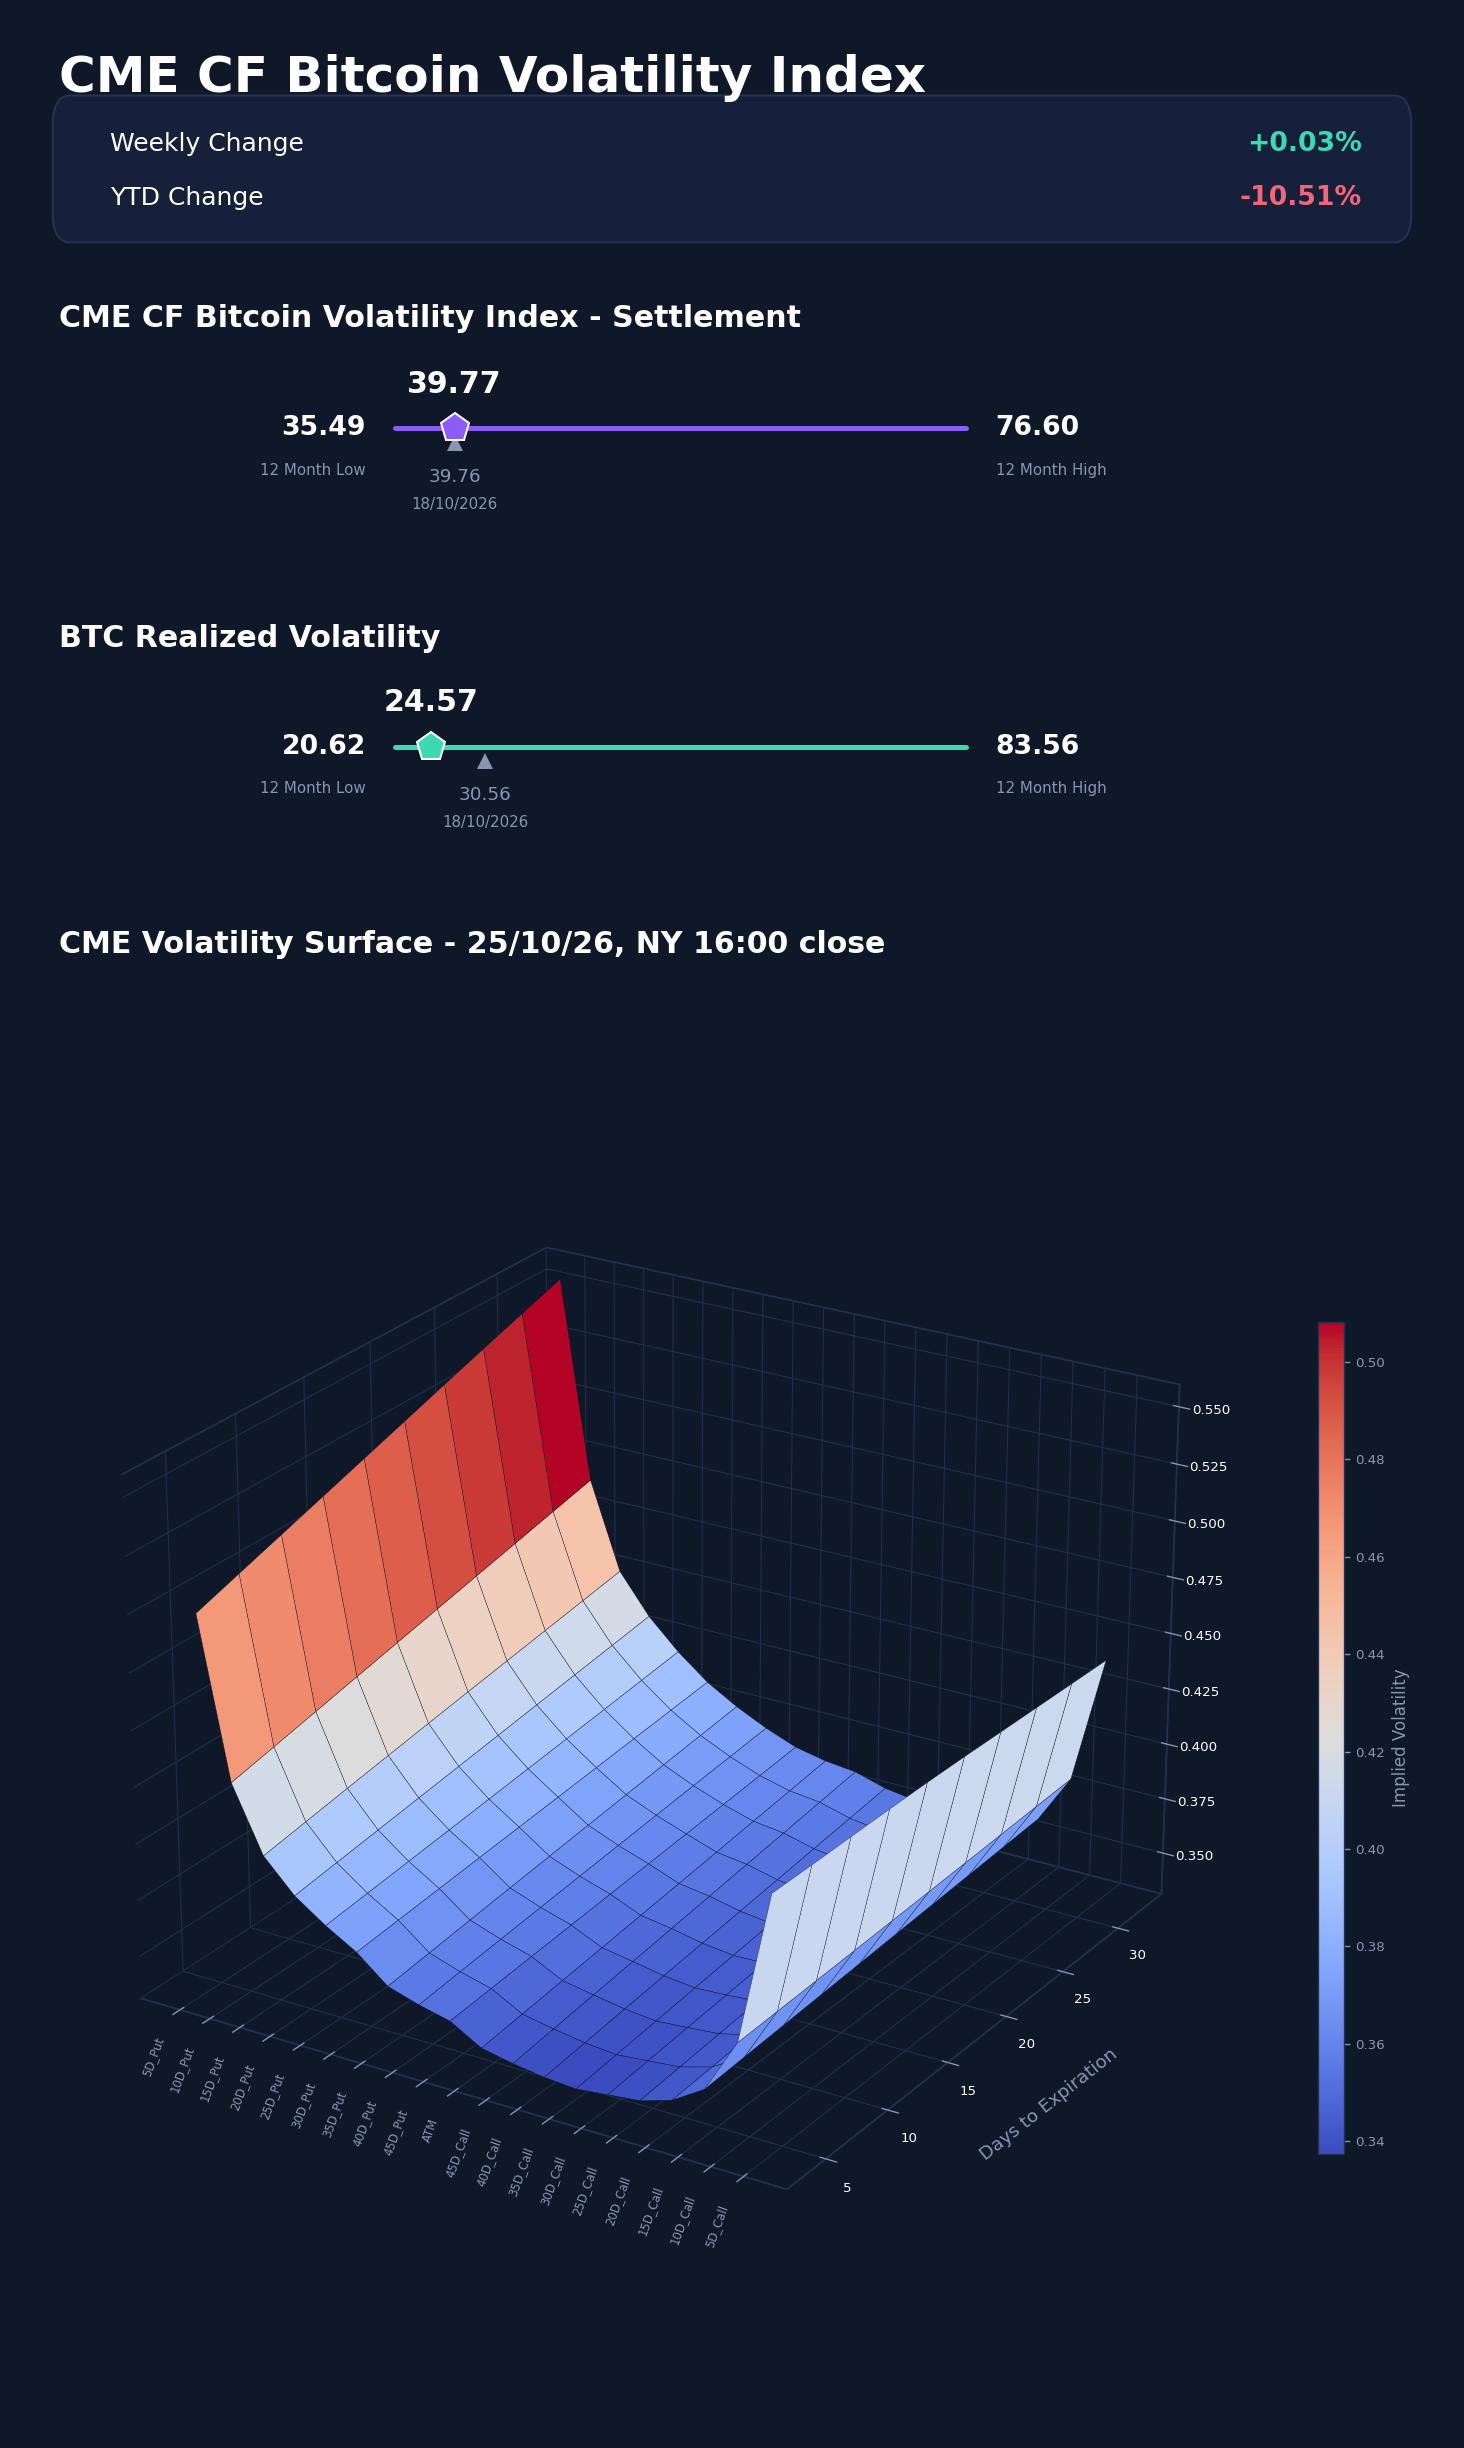
The CME CF Bitcoin Volatility Index Settlement (BVXS) was little changed on the week, at 39.77 on October 25th against 39.76 a week earlier, a 0.03% move. Across the business week BVXS held between 38.39 and 39.18, peaking on Thursday with the equity sell-off before settling back to 38.39 on Friday. Realized volatility moved the other way, falling from 30.79 on Monday to 24.44 on Friday as the large late-September moves rolled out of the 30-day window, and it ended the week at 24.57 against 30.56 a week earlier. That widened the implied-realized spread to 15.20 vol points from 9.20, so options are pricing materially more movement than BTC has recently delivered. BVXS sits 4.28 points above its 12-month low of 35.49 and well below the 76.60 high, and is down 10.51% YTD from its 44.44 start-of-year reference. On the surface, at-the-money (ATM) vol at the longest snapshot tenor (32 days against 39 days a week earlier) eased to 36.29 from 36.99 while the 5-delta put wing over ATM widened to 19.23 vol points from 17.60, so demand for deep downside protection firmed even as headline implied vol held steady.
Market Cap Index Performance
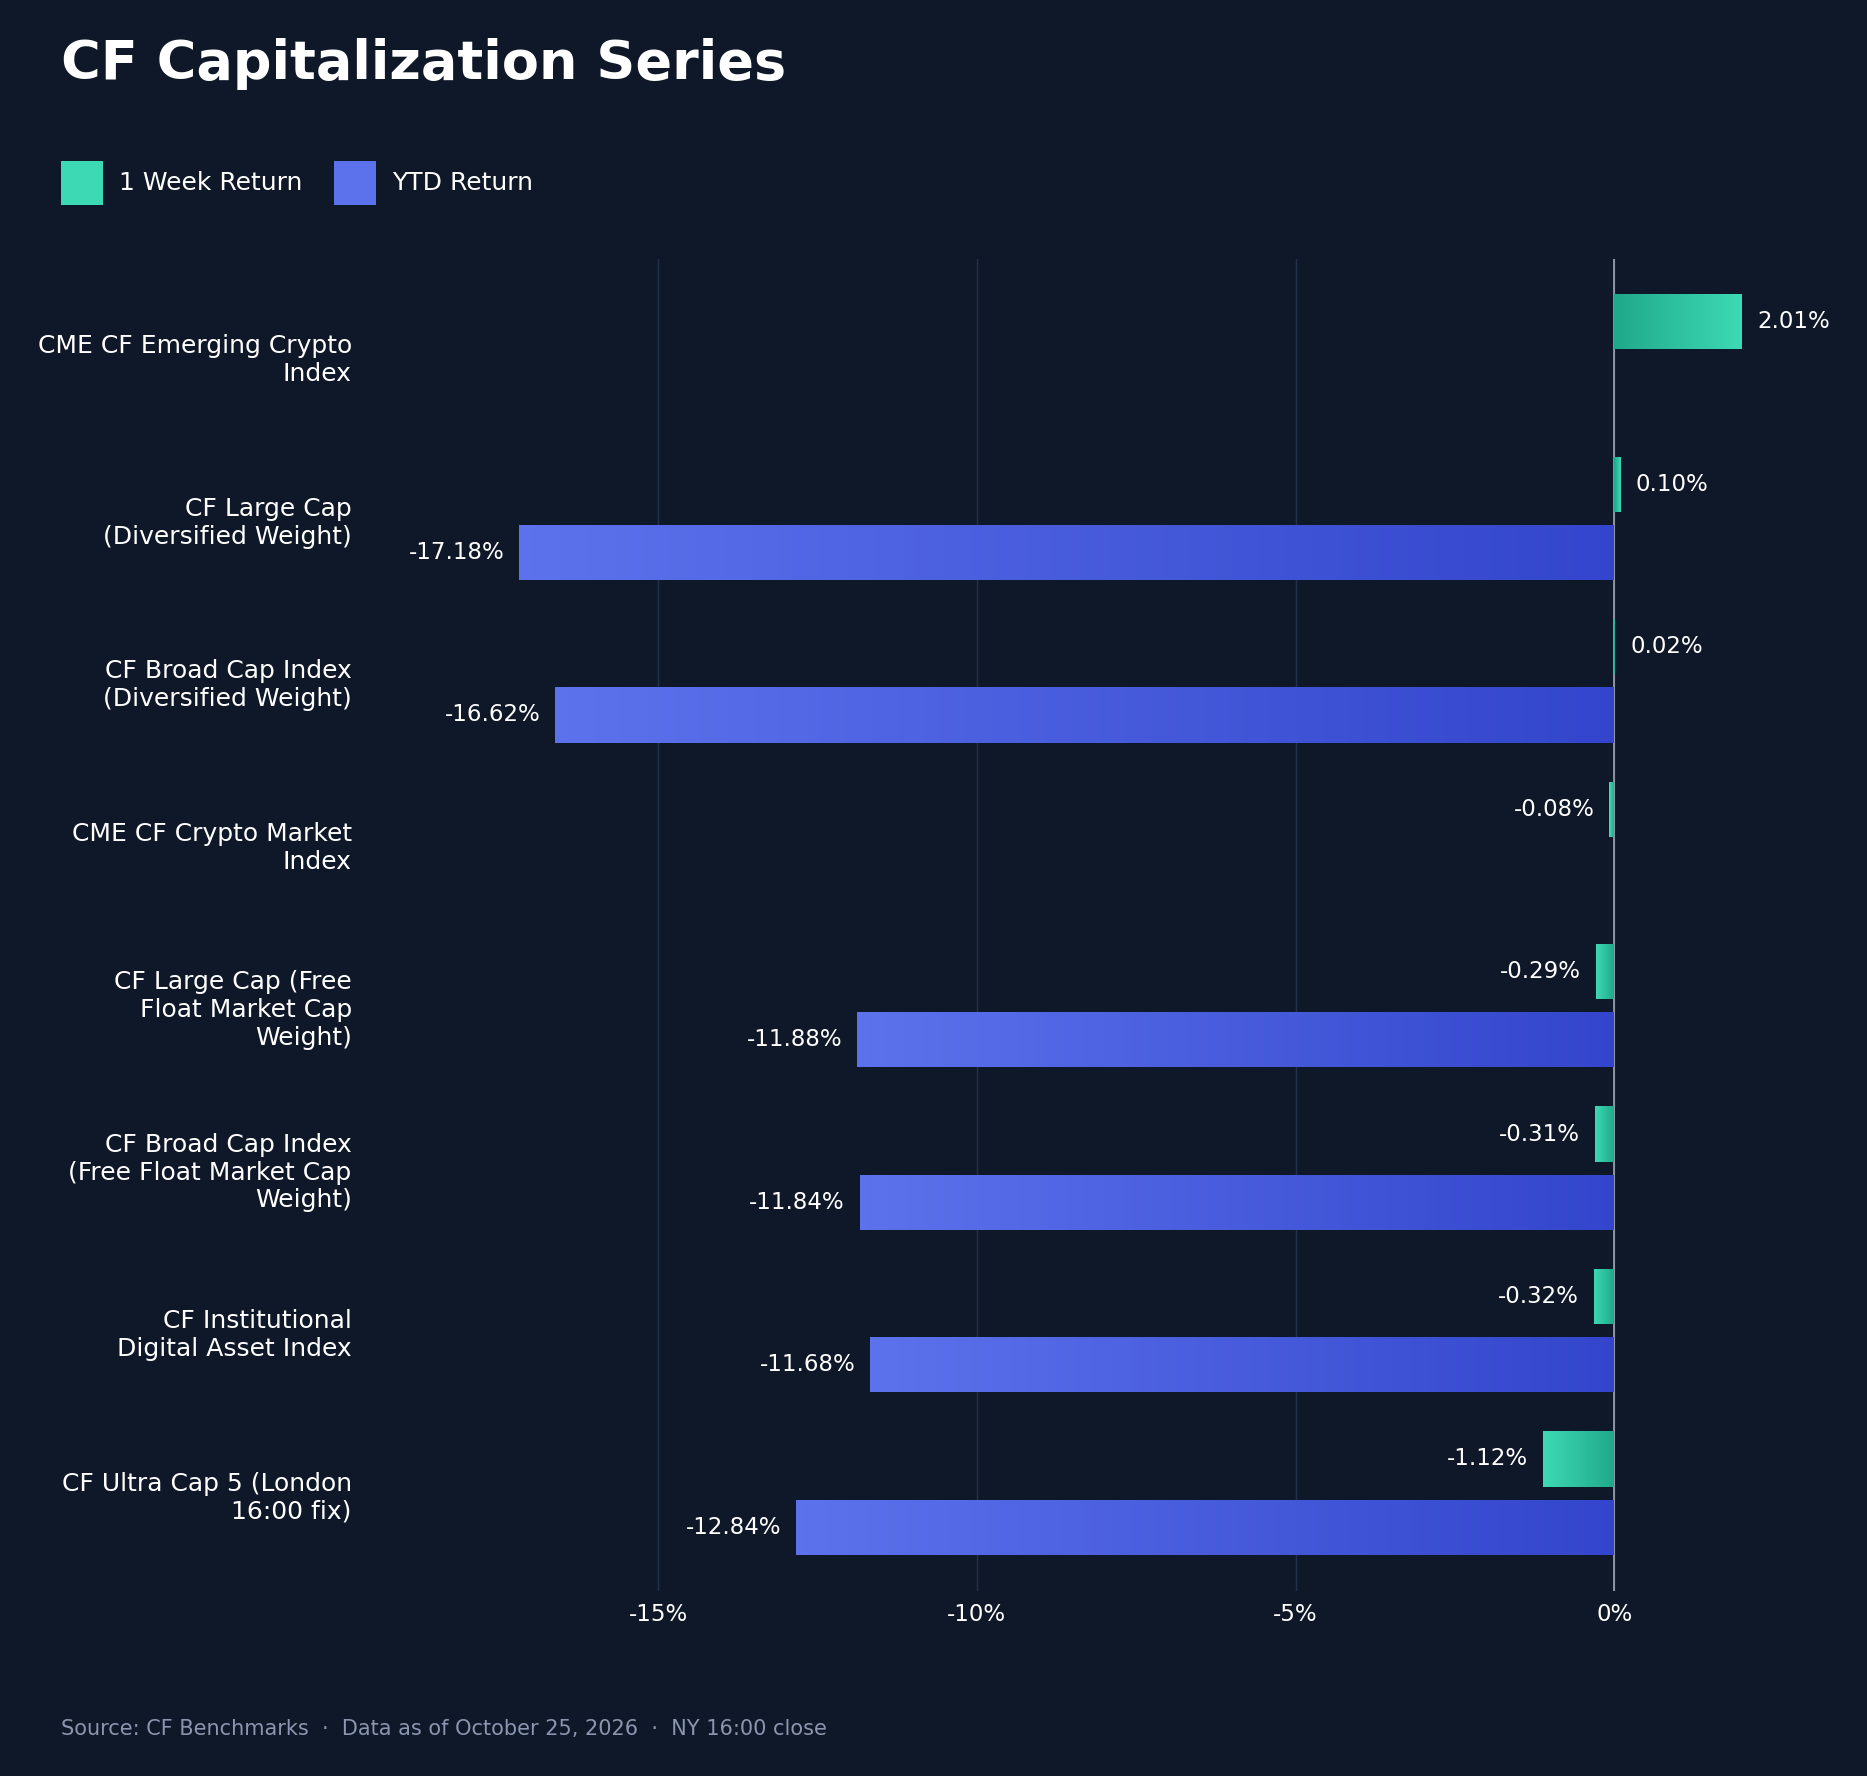
The CF Capitalization Series stabilized after the prior week's breadth damage. The CME CF Emerging Crypto Index led with +2.01%, after falling 9.01% a week earlier, followed by CF Large Cap (Diversified Weight) at +0.10% and CF Broad Cap (Diversified Weight) at +0.02%. The CME CF Crypto Market Index slipped 0.08%, CF Large Cap (Free Float Market Cap Weight) fell 0.29%, CF Broad Cap (Free Float Market Cap Weight) 0.31% and the CF Institutional Digital Asset Index 0.32%. The weekly range between the Emerging Crypto Index's +2.01% and the Institutional Digital Asset Index's -0.32% was a 2.33pp spread. CF Ultra Cap 5 fell 1.12% on the London 16:00 fix, a different basis from the New York close used for the other indices, so it is not ranked against them. The diversified-versus-free-float gap (Broad Cap Diversified minus Large Cap Free Float) swung to +0.31pp from -2.75pp a week earlier, meaning equal-leaning baskets edged ahead of cap-weighted ones after three straight weeks behind. On a YTD basis the free-float indices remain ahead, with Large Cap Free Float at -11.88% against -16.62% for Broad Cap Diversified. The macro shock this week landed on the largest names rather than the breadth of the market: BTC carried the Thursday decline, while BNB, XRP and the emerging segment held up, consistent with a risk-asset pullback concentrated in the most liquid exposure rather than a broad deleveraging.
Factors Analysis
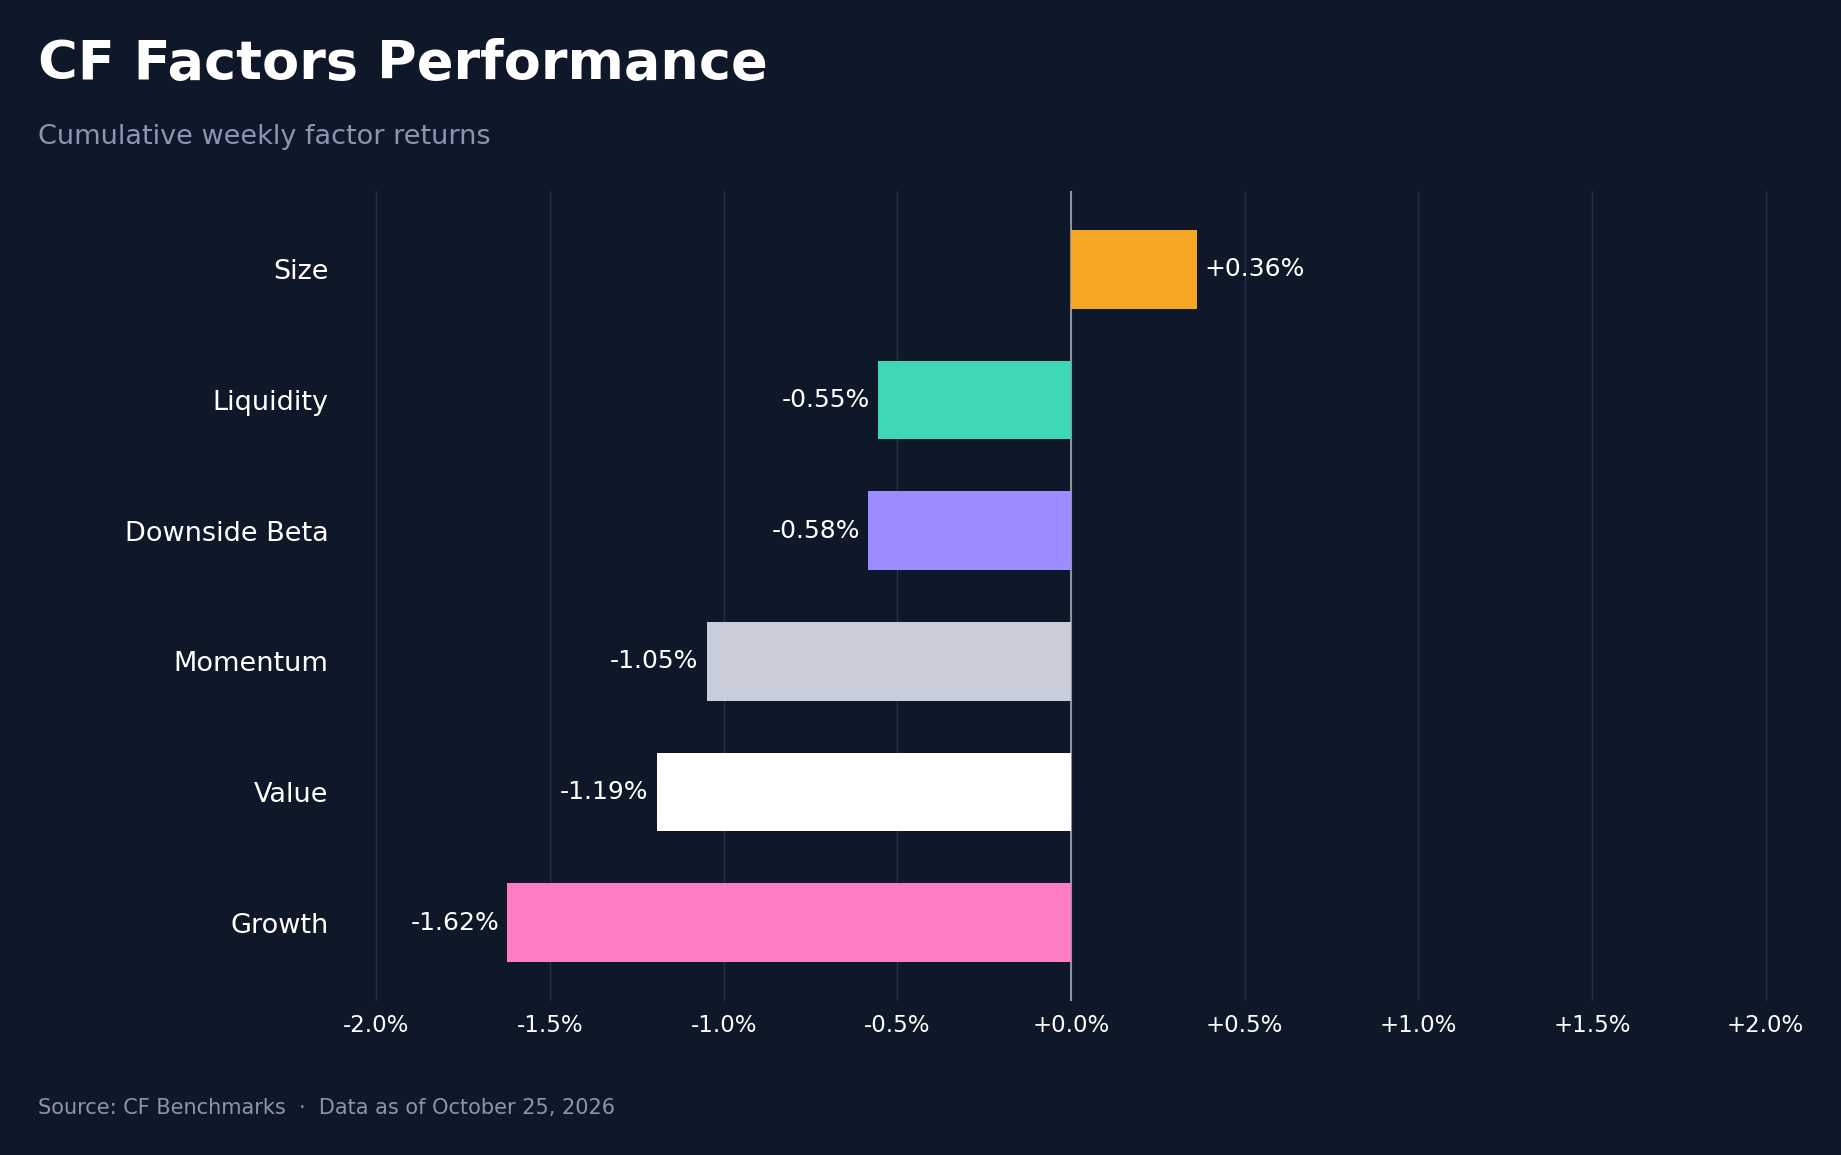
CF factor returns were mostly negative for a second week, but with smaller losses on average. Size was the only positive factor at +0.36%, meaning smaller assets outperformed larger ones, after -0.75% a week earlier. Liquidity fell 0.55% and Downside Beta 0.58%, Momentum lost 1.05%, Value 1.19% and Growth 1.62%. The weekly range between Size's +0.36% and Growth's -1.62% was a 1.98pp spread, narrower than the 3.95pp range a week earlier. The biggest rotation was in Liquidity, which swung 1.96pp from +1.41%, so more liquid assets regained the edge after a week in which less liquid names had held up better. Size improved by 1.12pp and Momentum by 0.74pp, while Growth remained the weakest factor for a second week, at -1.62% after -2.55%. The pattern points to a market that stopped penalizing smaller caps without rewarding growth or trend exposure, consistent with the flat index tape.
Read our latest weekly crypto factors report: Factor Friday - October 23, 2026
Classification Series Analysis
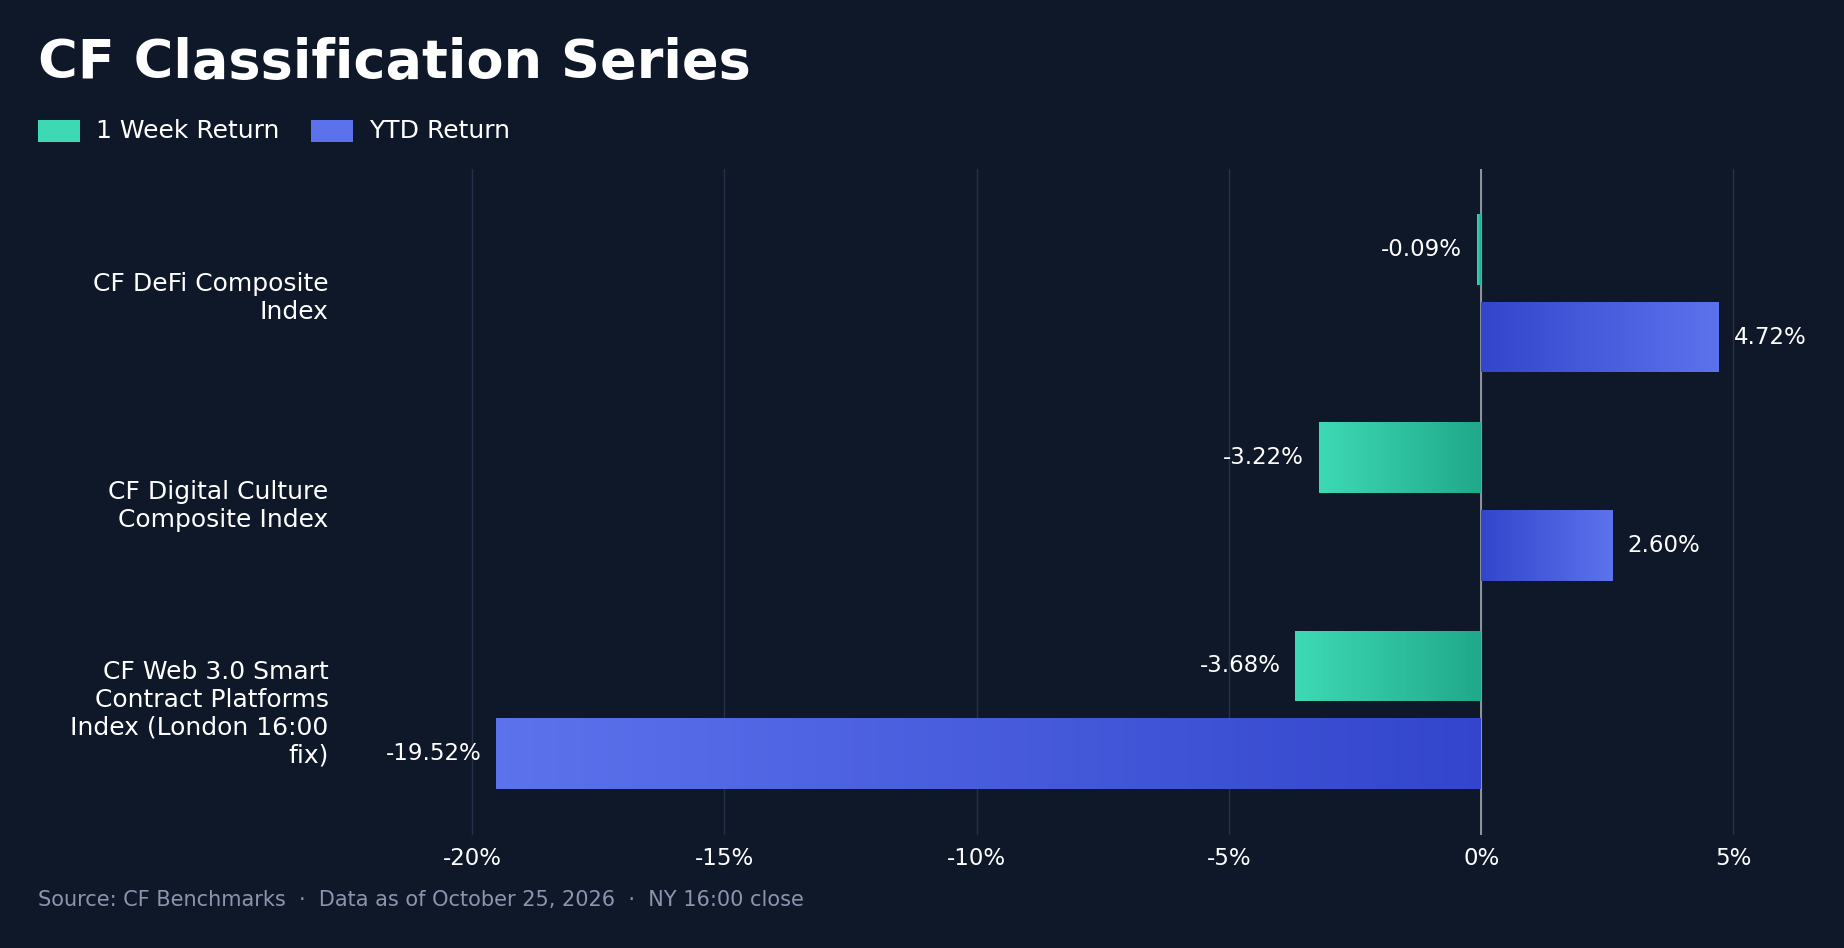
Within the CF Classification Series, the CF DeFi Composite Index was flat at -0.09%, after a 13.98% decline a week earlier, while the CF Digital Culture Composite Index fell 3.22% after a 14.41% drop. DeFi led Digital Culture by 3.13pp. The CF Web 3.0 Smart Contract Platforms Index fell 3.68% on the London 16:00 fix, which is not comparable with the New York close used for the two composites. On a YTD basis DeFi is up 4.72% and Digital Culture 2.60%, while Smart Contract Platforms is down 19.52%. The split mirrors the DACS read below, where most meme coins rallied while metaverse and media tokens fell hardest.
Sector Analysis
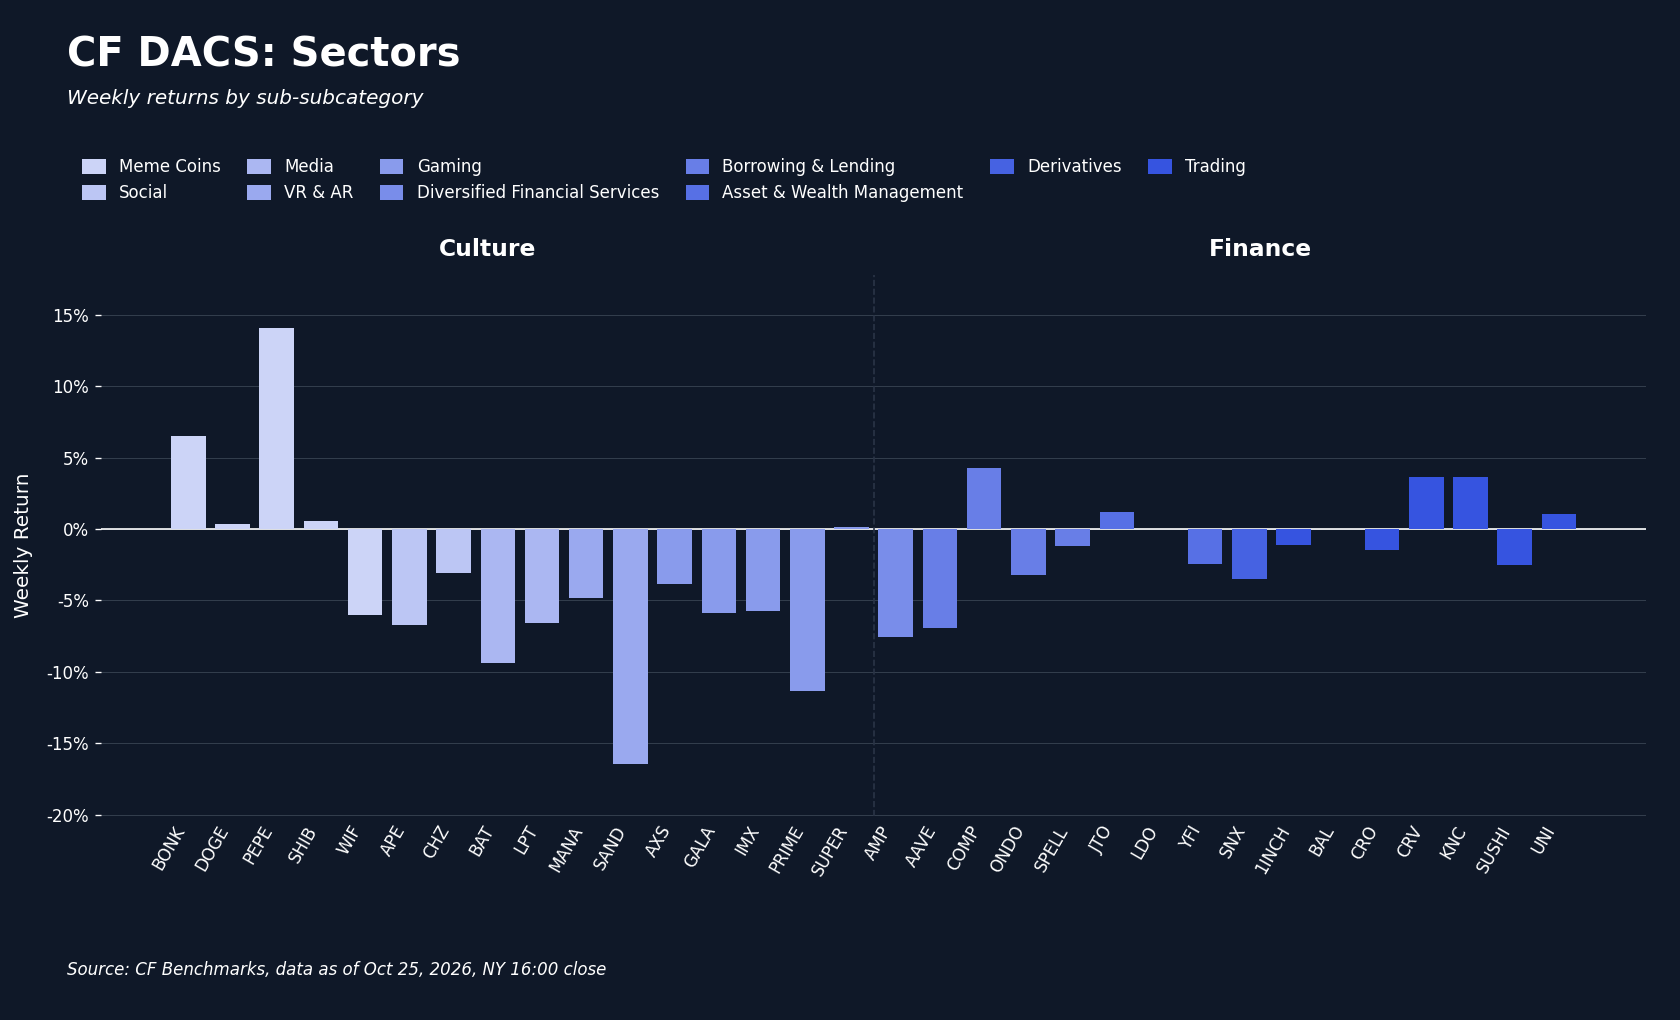
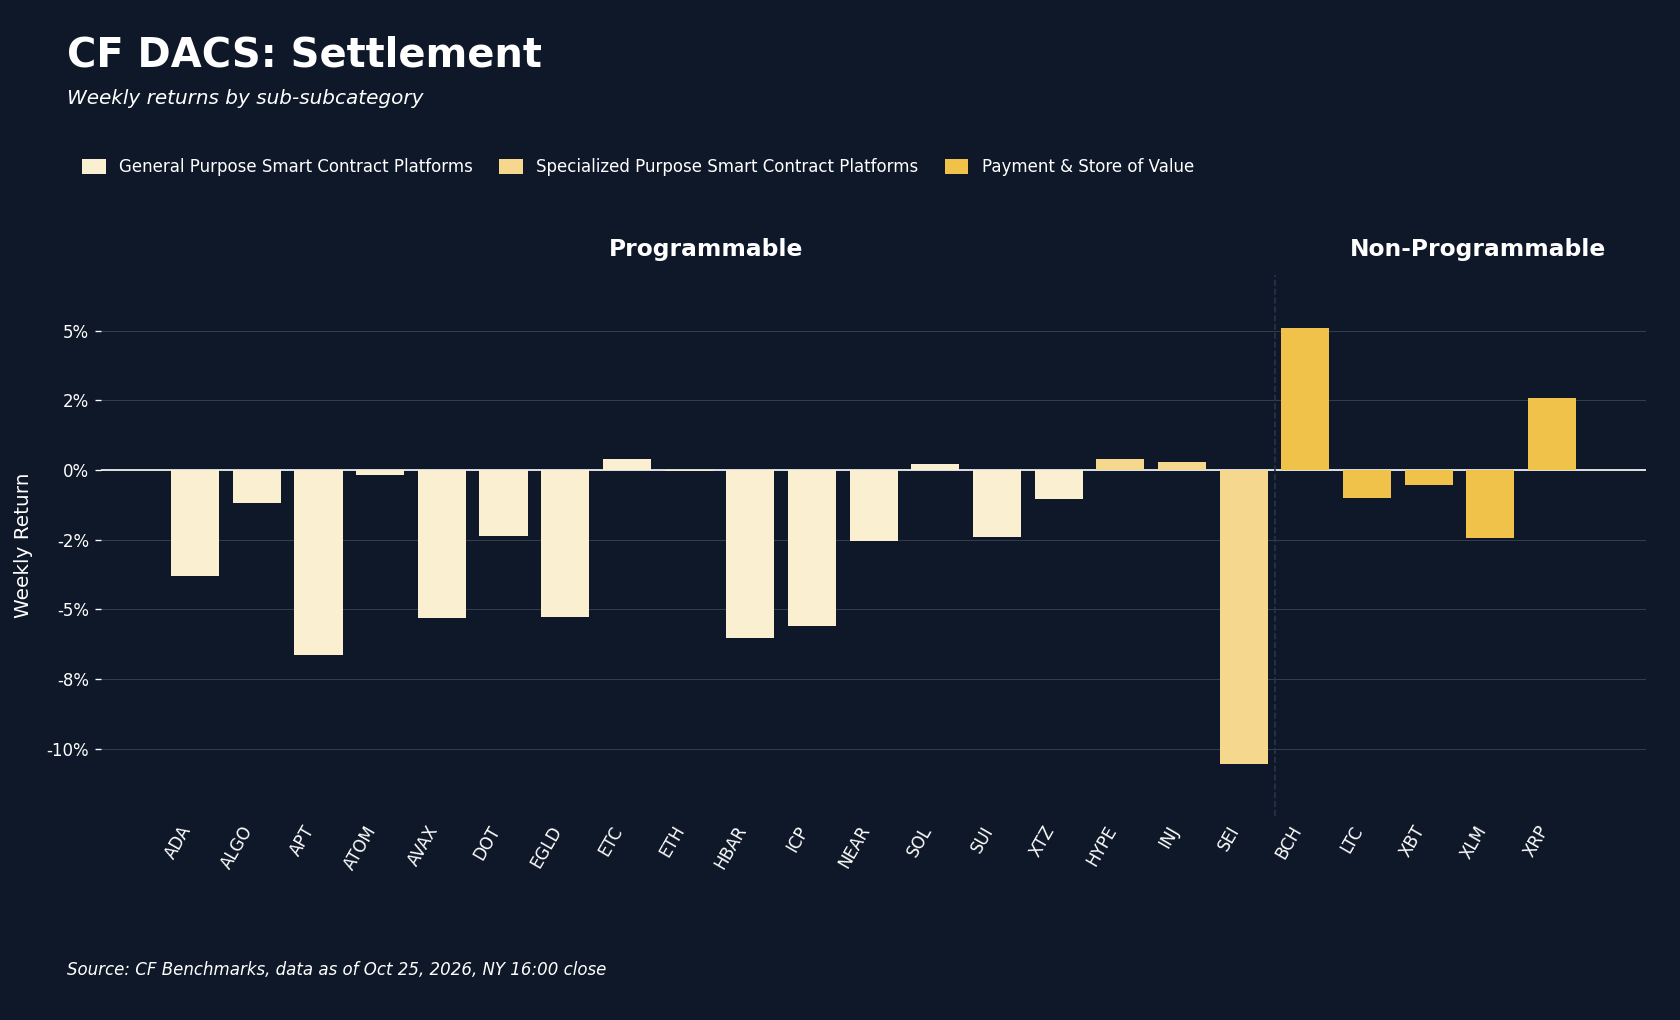
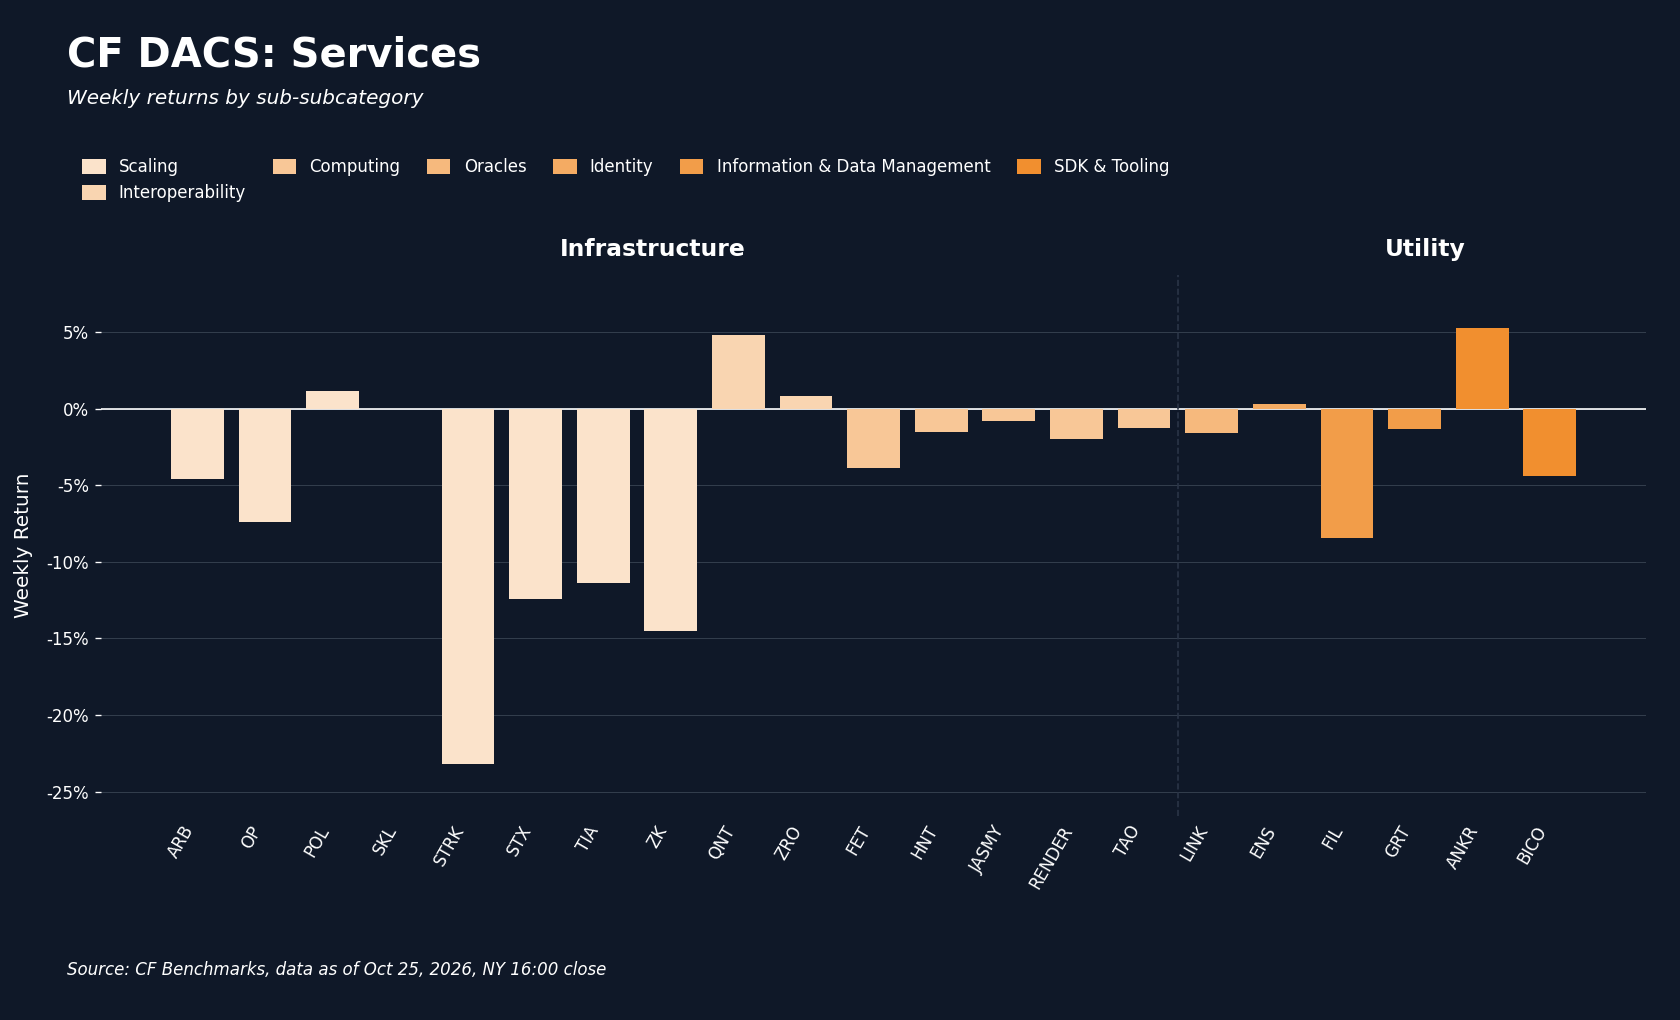
Across the CF DACS sub-categories, Non-Programmable was the only one with a positive average, at +0.75%, led by Bitcoin Cash (BCH) at +5.11% and XRP at +2.60%. Finance averaged -1.01%, with Compound (COMP) +4.30% and Kyber Network (KNC) +3.65% at the top and Aave (AAVE) -6.95% and Amp (AMP) -7.59% at the bottom. Utility averaged -1.69%, with Ankr (ANKR) +5.29% against Filecoin (FIL) -8.45%. Programmable averaged -2.87%, with Ethereum Classic (ETC) +0.40% the best and Sei (SEI) -10.54% the worst. Culture averaged -3.64% but held the week's widest internal split: Pepe (PEPE) rose 14.10%, the best constituent in the complex, and Bonk (BONK) 6.49%, while The Sandbox (SAND) fell 16.44%. PEPE's move followed a Pepe-themed post from Coinbase's chief executive on October 22nd that did not name the token. Infrastructure was the weakest sub-category at -5.08%, with Quant (QNT) +4.83% against Starknet (STRK) -23.18%, ZKsync (ZK) -14.49% and Stacks (STX) -12.44%; STRK extended its decline for a second week. The widest token-level spread, between PEPE's +14.10% and STRK's -23.18%, was 37.28pp. Within Programmable, Solana's Alpenglow consensus upgrade went live on October 21st, but SOL ended the week up only 0.22%, consistent with an upgrade that the market had largely anticipated.
CF Staking Series
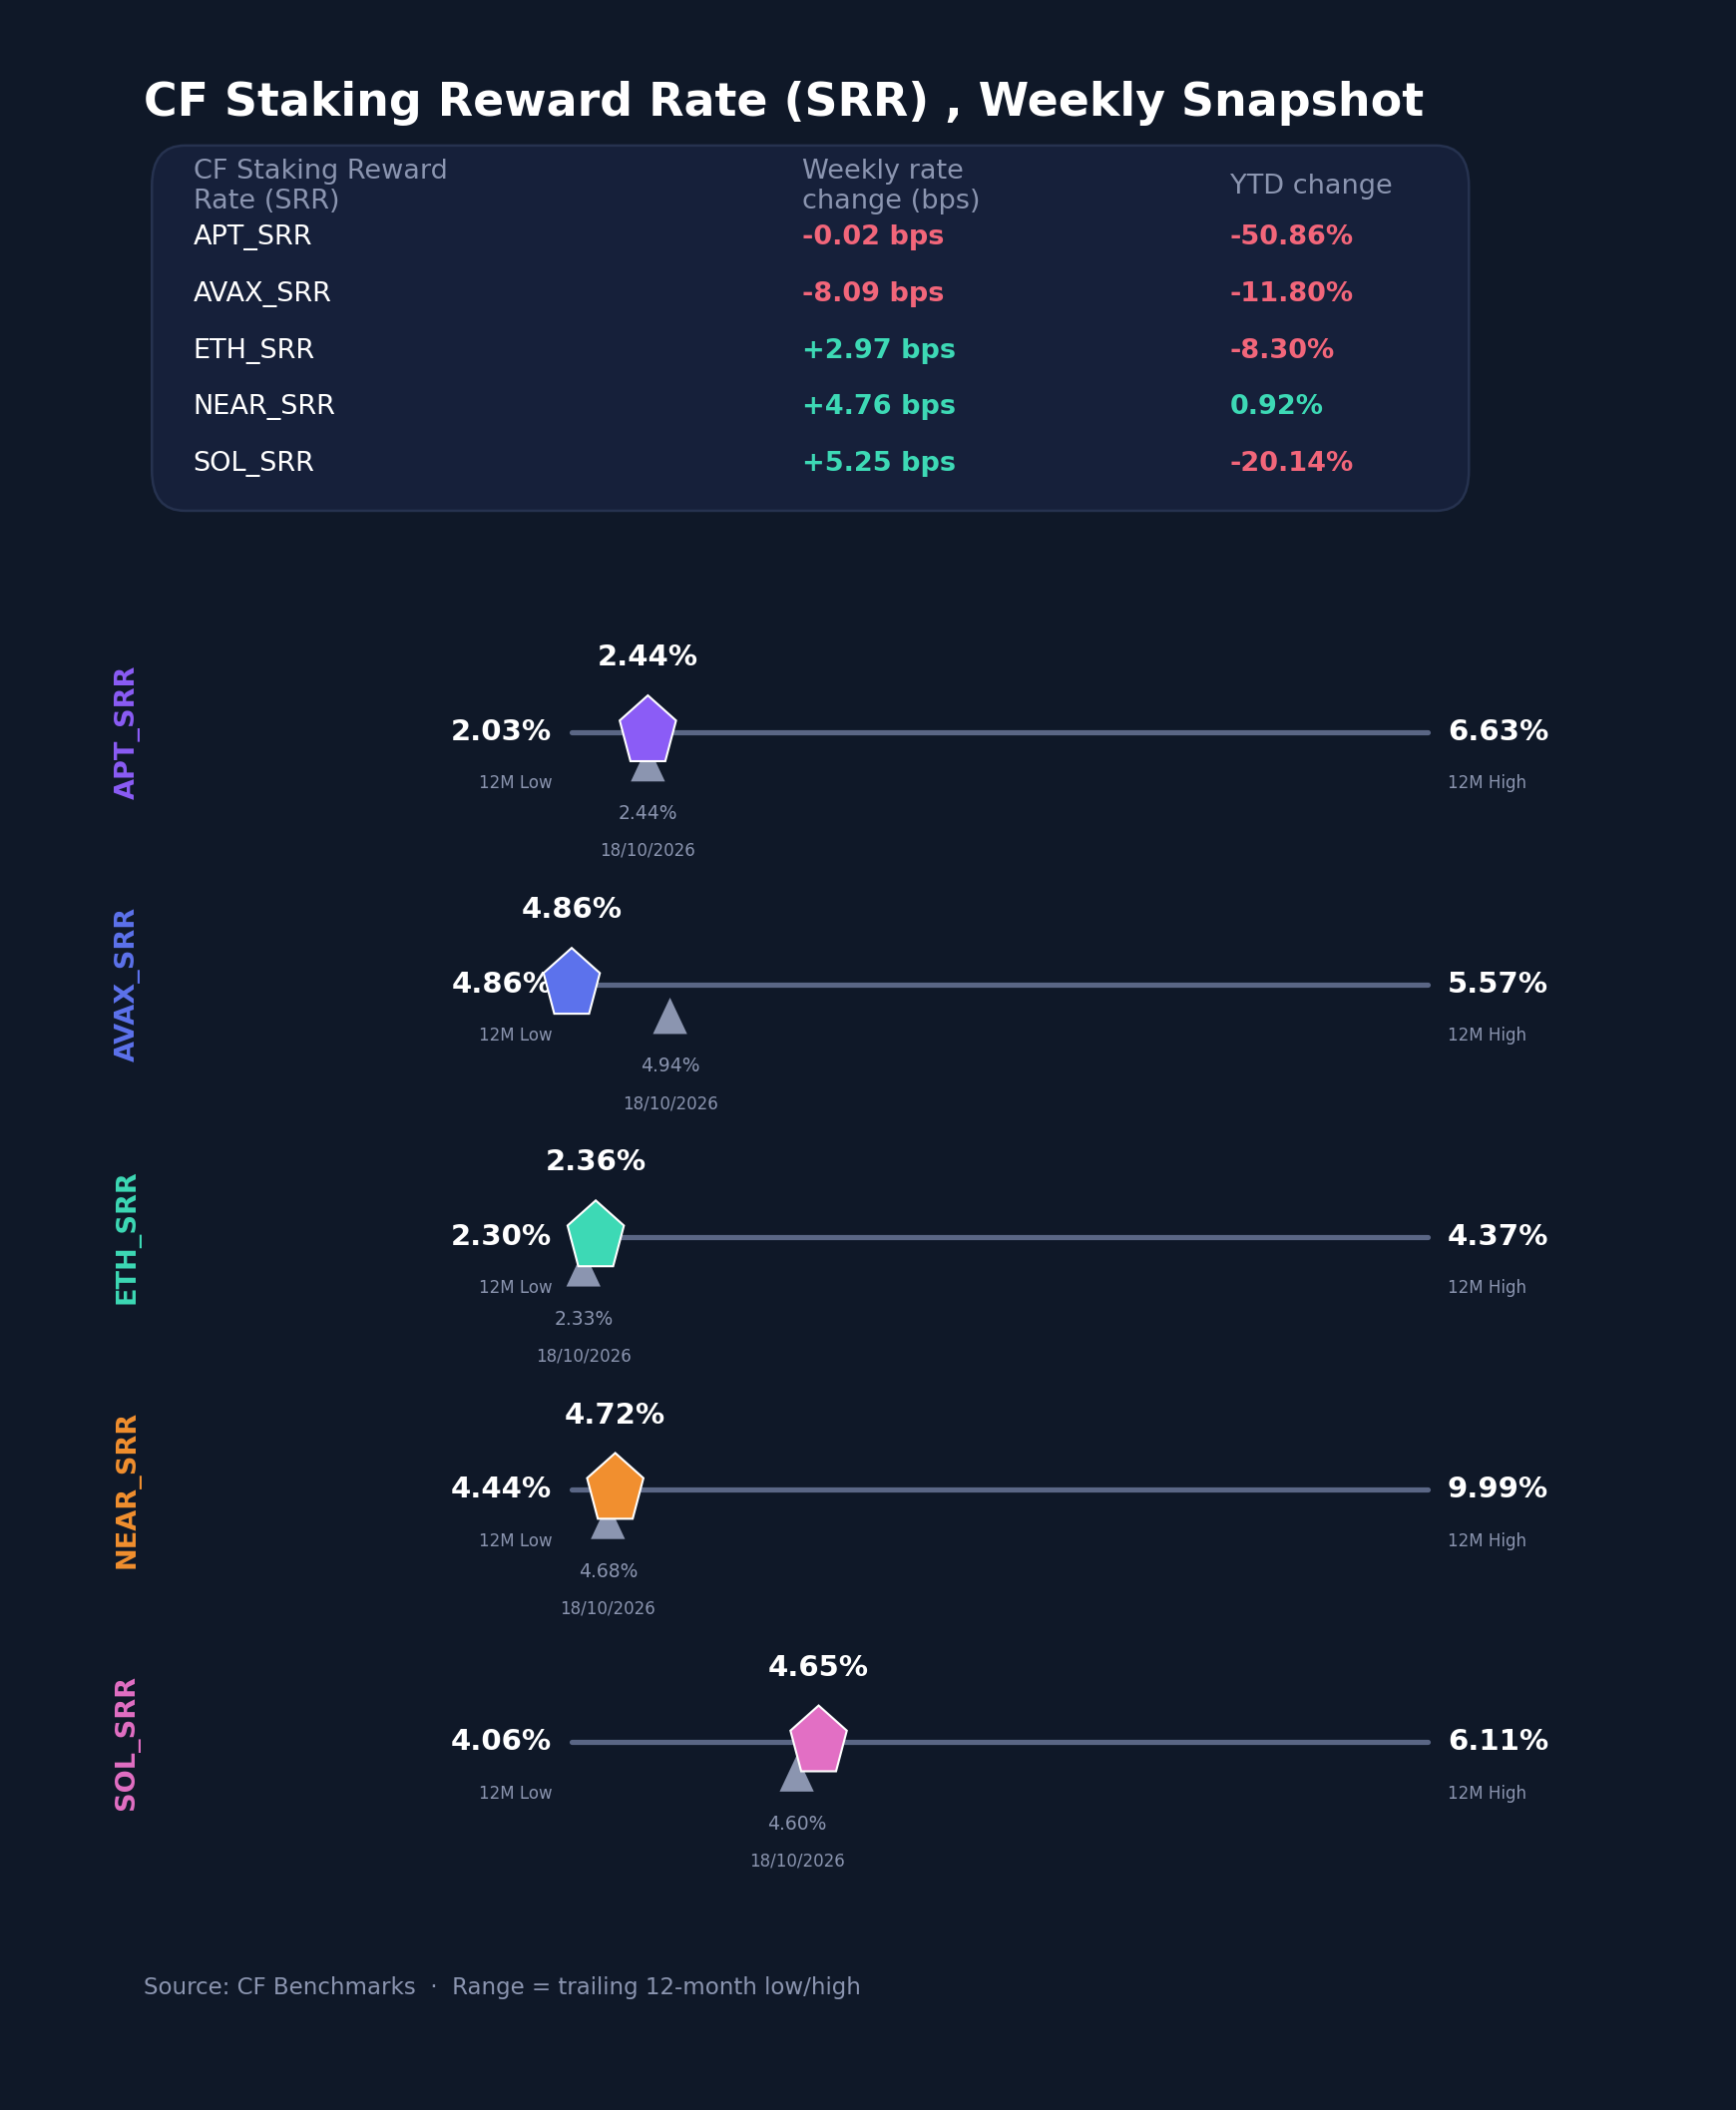
The CF Staking Series was mixed. ETH led relative index returns at +1.28%, followed by SOL at +1.14% and NEAR at +1.02%, while APT was flat at -0.01% and AVAX fell 1.64%. Reward rates rose 5.2 bps for SOL, from 4.5993% to 4.6518%, 4.8 bps for NEAR, from 4.6774% to 4.7250%, and 3.0 bps for ETH, from 2.3257% to 2.3554%. APT was essentially unchanged at 2.4389%. AVAX fell 8.1 bps, from 4.9427% to 4.8618%, the lowest AVAX reward rate in the trailing 12 months. Across the set, reward rates ranged from ETH's 2.3554% to AVAX's 4.8618%, a 2.51pp spread, with AVAX, NEAR and SOL clustered between 4.65% and 4.86%. YTD, NEAR is the only staking index higher, at +0.92%.
Bitcoin Basis Analysis
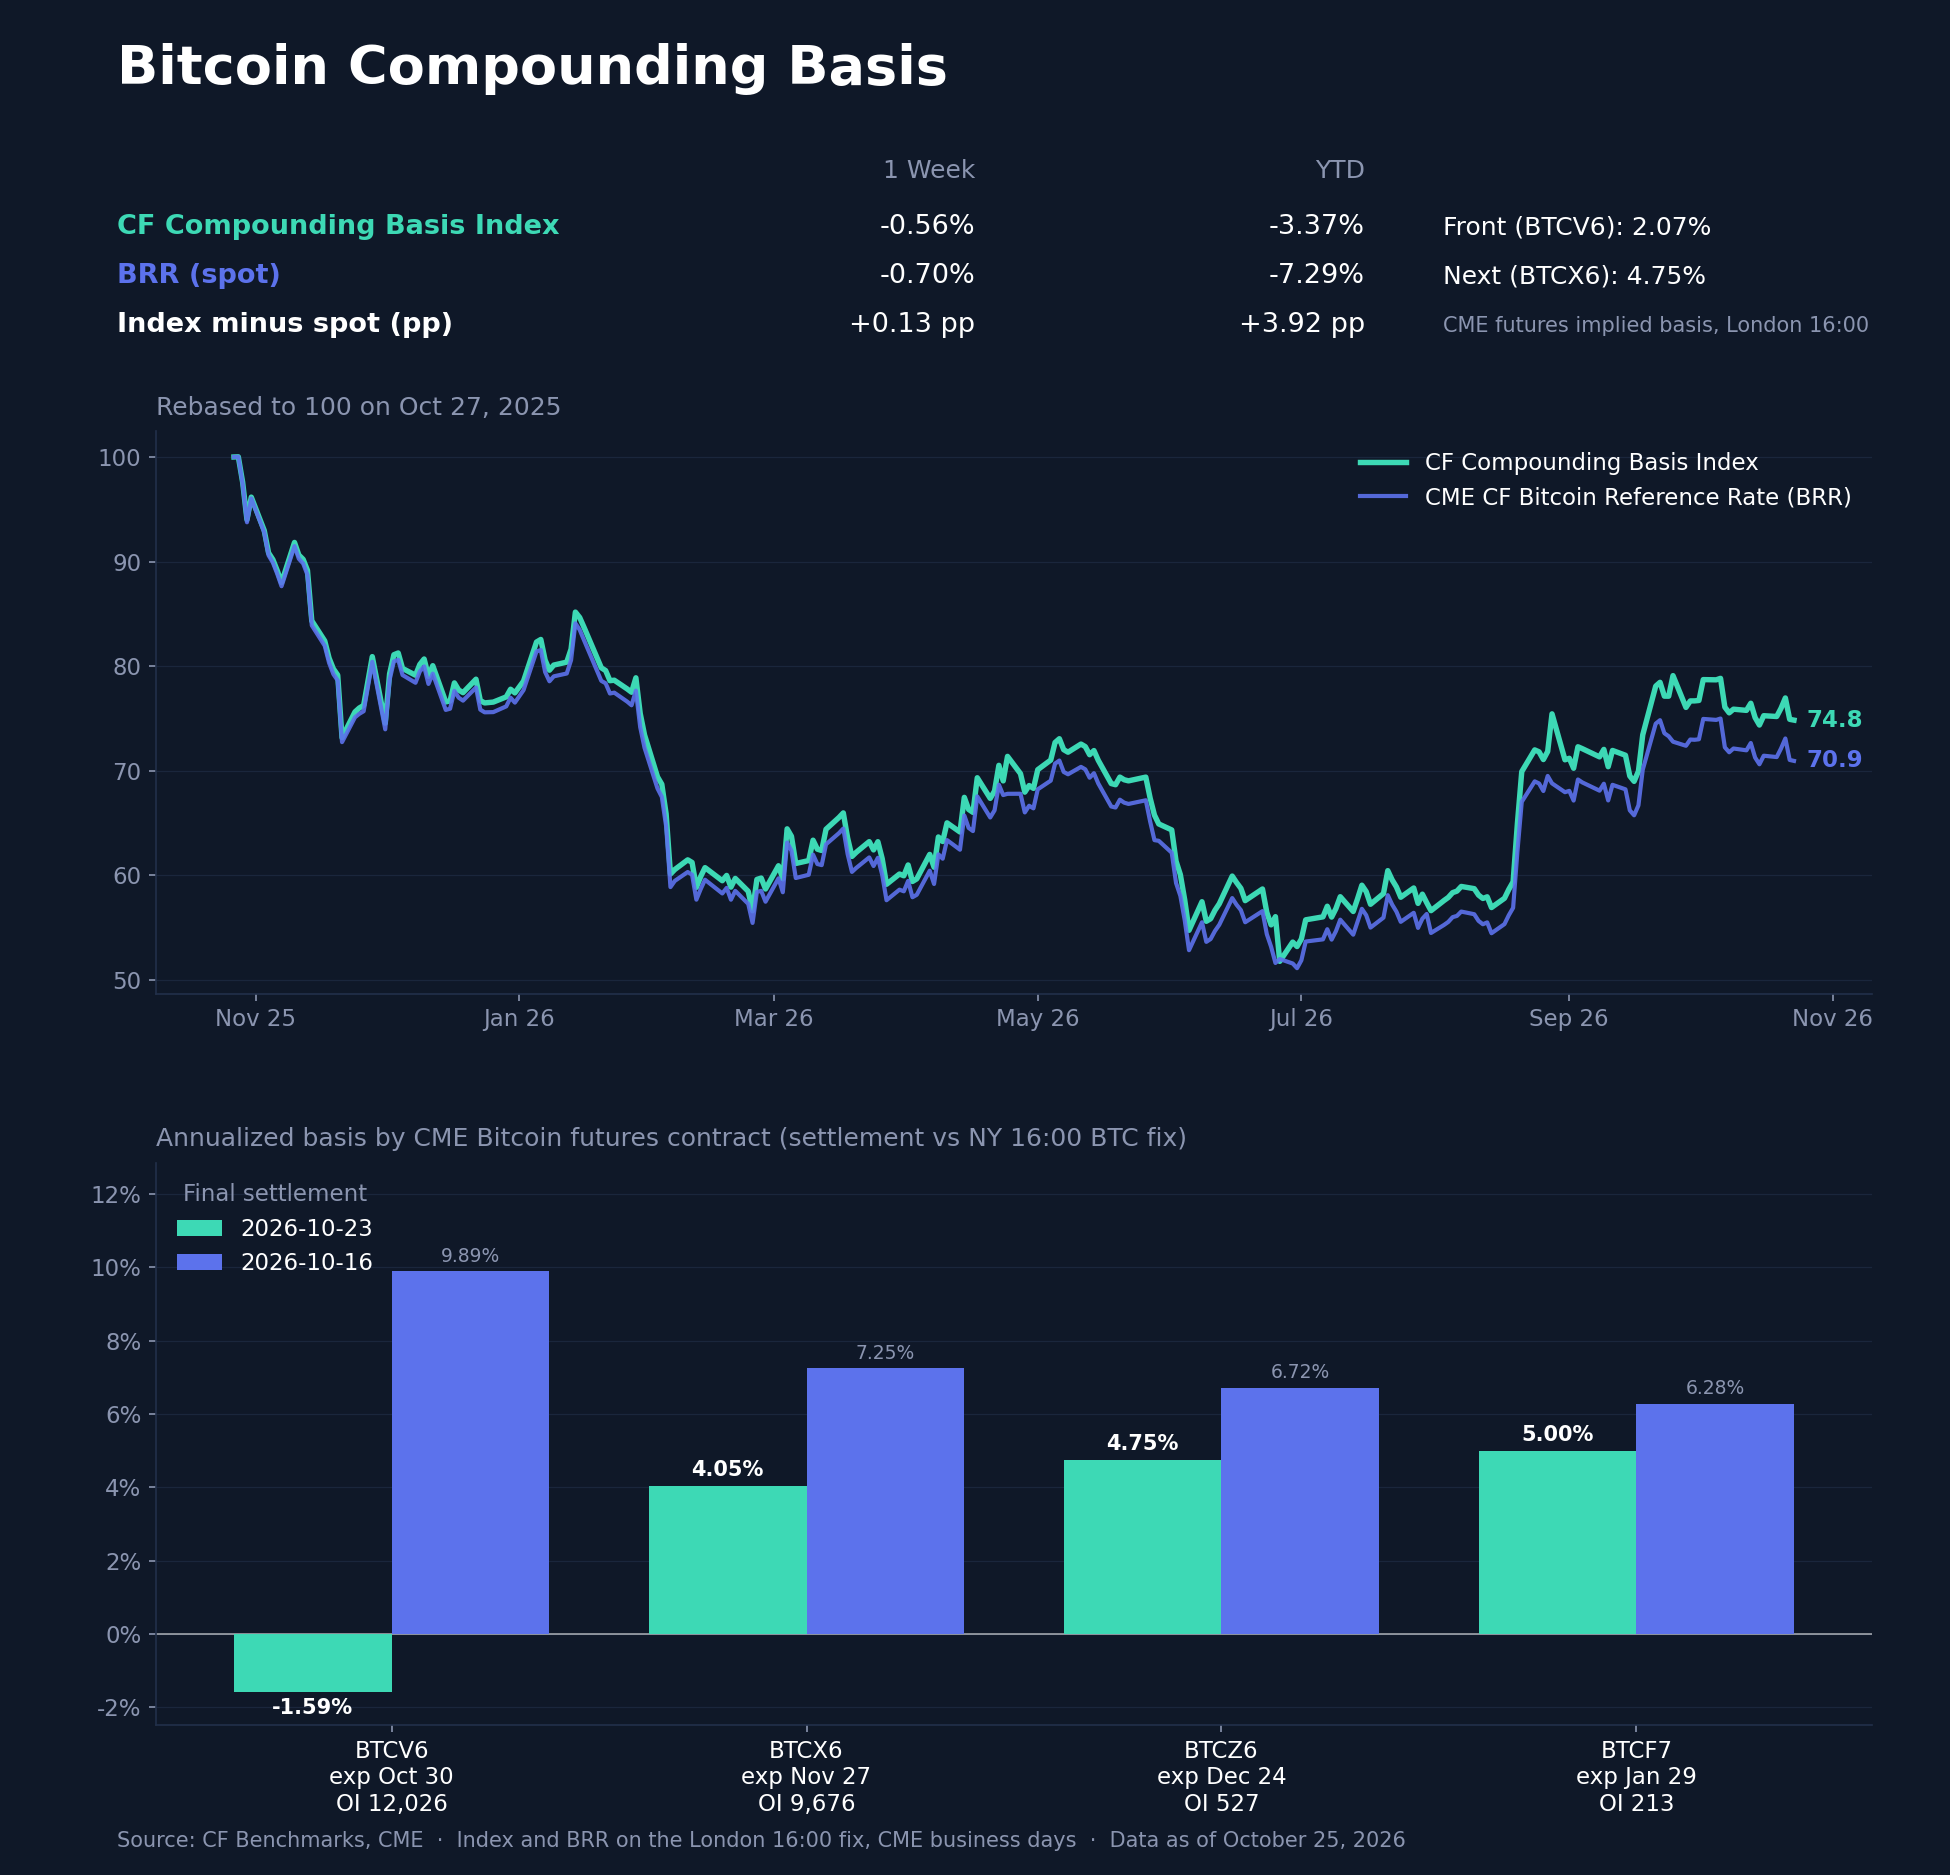
The USDT and BTC curves of the CF Bitcoin Interest Rate Curve (BIRC) diverged on the weekly-average basis. The Tether (USDT) curve shifted down by 89.9 to 94.1 bps at every tenor, with the Short-term Interest Rate Benchmark (SIRB) averaging 3.7016% against 4.6423% and the 5-month (5M) tenor 4.1495% against 5.0487%, and it kept its upward slope, rising 44.8 bps from SIRB to 5M. Most of that decline is last week's spike leaving the comparison: USDT SIRB printed 7.77% on October 6th and 5.94% on October 7th, and measured Sunday to Sunday it fell only 34.7 bps, to 3.6123% from 3.9595%. The BTC curve was the idiosyncratic one. BTC SIRB averaged 3.5276% against 5.0427%, down 151.5 bps, but the average conceals a daily slide from 12.0610% on Monday to 0.0198% on Friday and Saturday, with 0.7607% on Sunday, and the shorter BTC tenors printed zero on several days, so the 1-week to 1-month averages are not read as funding levels. The 3-month (3M), 4-month (4M) and 5M tenors, which printed consistently, rose 57.2, 49.2 and 41.2 bps to 1.2049%, 1.1346% and 1.0643%, leaving the BTC curve 287.7 to 308.5 bps below USDT at those tenors and easing from its 3M peak. No single event in the week explains the BTC front-end slide, which was under way by Tuesday, before the CPI release, whereas USDT SIRB stayed between 3.6123% and 3.8308% after last week's spike.
Closing Synthesis
All told, the week was a round trip for BTC and a reset for the rest of the market. BTC tested back above its 50-day average and gave the gain up with equities on Thursday, which held the CME CF Crypto Market Index flat while BNB, XRP and the emerging segment recovered and the diversified indices edged ahead of free-float ones. Implied volatility held steady as realized volatility fell, and the Bitcoin basis curve compressed across every listed contract, so the market ended the week with less leverage demand priced into futures rather than materially lower prices.
The information contained within is for educational and informational purposes ONLY. It is not intended nor should it be considered an invitation or inducement to buy or sell any of the underlying instruments cited including but not limited to cryptoassets, financial instruments or any instruments that reference any index provided by CF Benchmarks Ltd. This communication is not intended to persuade or incite you to buy or sell security or securities noted within. Any commentary provided is the opinion of the author and should not be considered a personalised recommendation. Please contact your financial adviser or professional before making an investment decision.
Note: Some of the underlying instruments cited within this material may be restricted to certain customer categories in certain jurisdictions.
Digital Assets Remain Flat as Tech Sells Off
Digital assets traded mixed over the week, ending flat after a midweek rally faded with equities. Breadth improved as smaller and diversified baskets steadied while the largest names lagged, implied volatility held as realized eased, and futures basis compressed across the curve.

Mark Pilipczuk
Factor Friday - Oct 23, 2026
Size led CF Benchmarks' factor table for a fourth week at 0.75% as the Market fell 1.88% and only 4 of 35 Broad Cap tokens closed higher. Liquidity turned negative at -1.03% as more liquid assets held up better, and Size's year-to-date lead extended to 23.74%.
Mark Pilipczuk
Changes to the Token Market Price Benchmarks Series - Market Prices – 20 October 2026
The Administrator has confirmed changes to the Token Market Price Family for the period 13 October 2026 to 20 October 2026
CF Benchmarks
By clicking Accept, you consent to CF Benchmarks's use of cookies.
Visit Cookie Settings to learn how CF Benchmarks uses cookies and to adjust your preferences.