
Aug 17, 2026
Digital Assets Decline Despite Cooling Inflation
Weekly Index Highlights, August 17, 2026
Digital assets declined in what should have been a friendly macro week. July's Consumer Price Index (CPI) landed exactly on consensus on Wednesday August 12th and Thursday's Producer Price Index (PPI) came in cooler, with final demand flat month over month (MoM) against a 0.2% consensus, taking September rate-hike odds from 55% to 32% across the two prints and putting the S&P 500 at a record close on Thursday; the CF Single Asset Series still finished six of seven lower and Bitcoin (BTC) down 2.59% week-on-week (w/w). We read the week as crypto-led. Spot Bitcoin exchange-traded funds (ETFs) redeemed 389.7m dollars, the largest weekly outflow in six weeks and a full reversal of the prior week's 853.5m dollars of creations, and the Securities and Exchange Commission (SEC) shelved its crypto rulemaking vote with no new date. What dispersion there was moved into single names, with 8 of 77 CF DACS constituents higher, while the capitalization indices and the factor set both compressed and BVXS rose even as realized volatility fell.
Market Performance Update
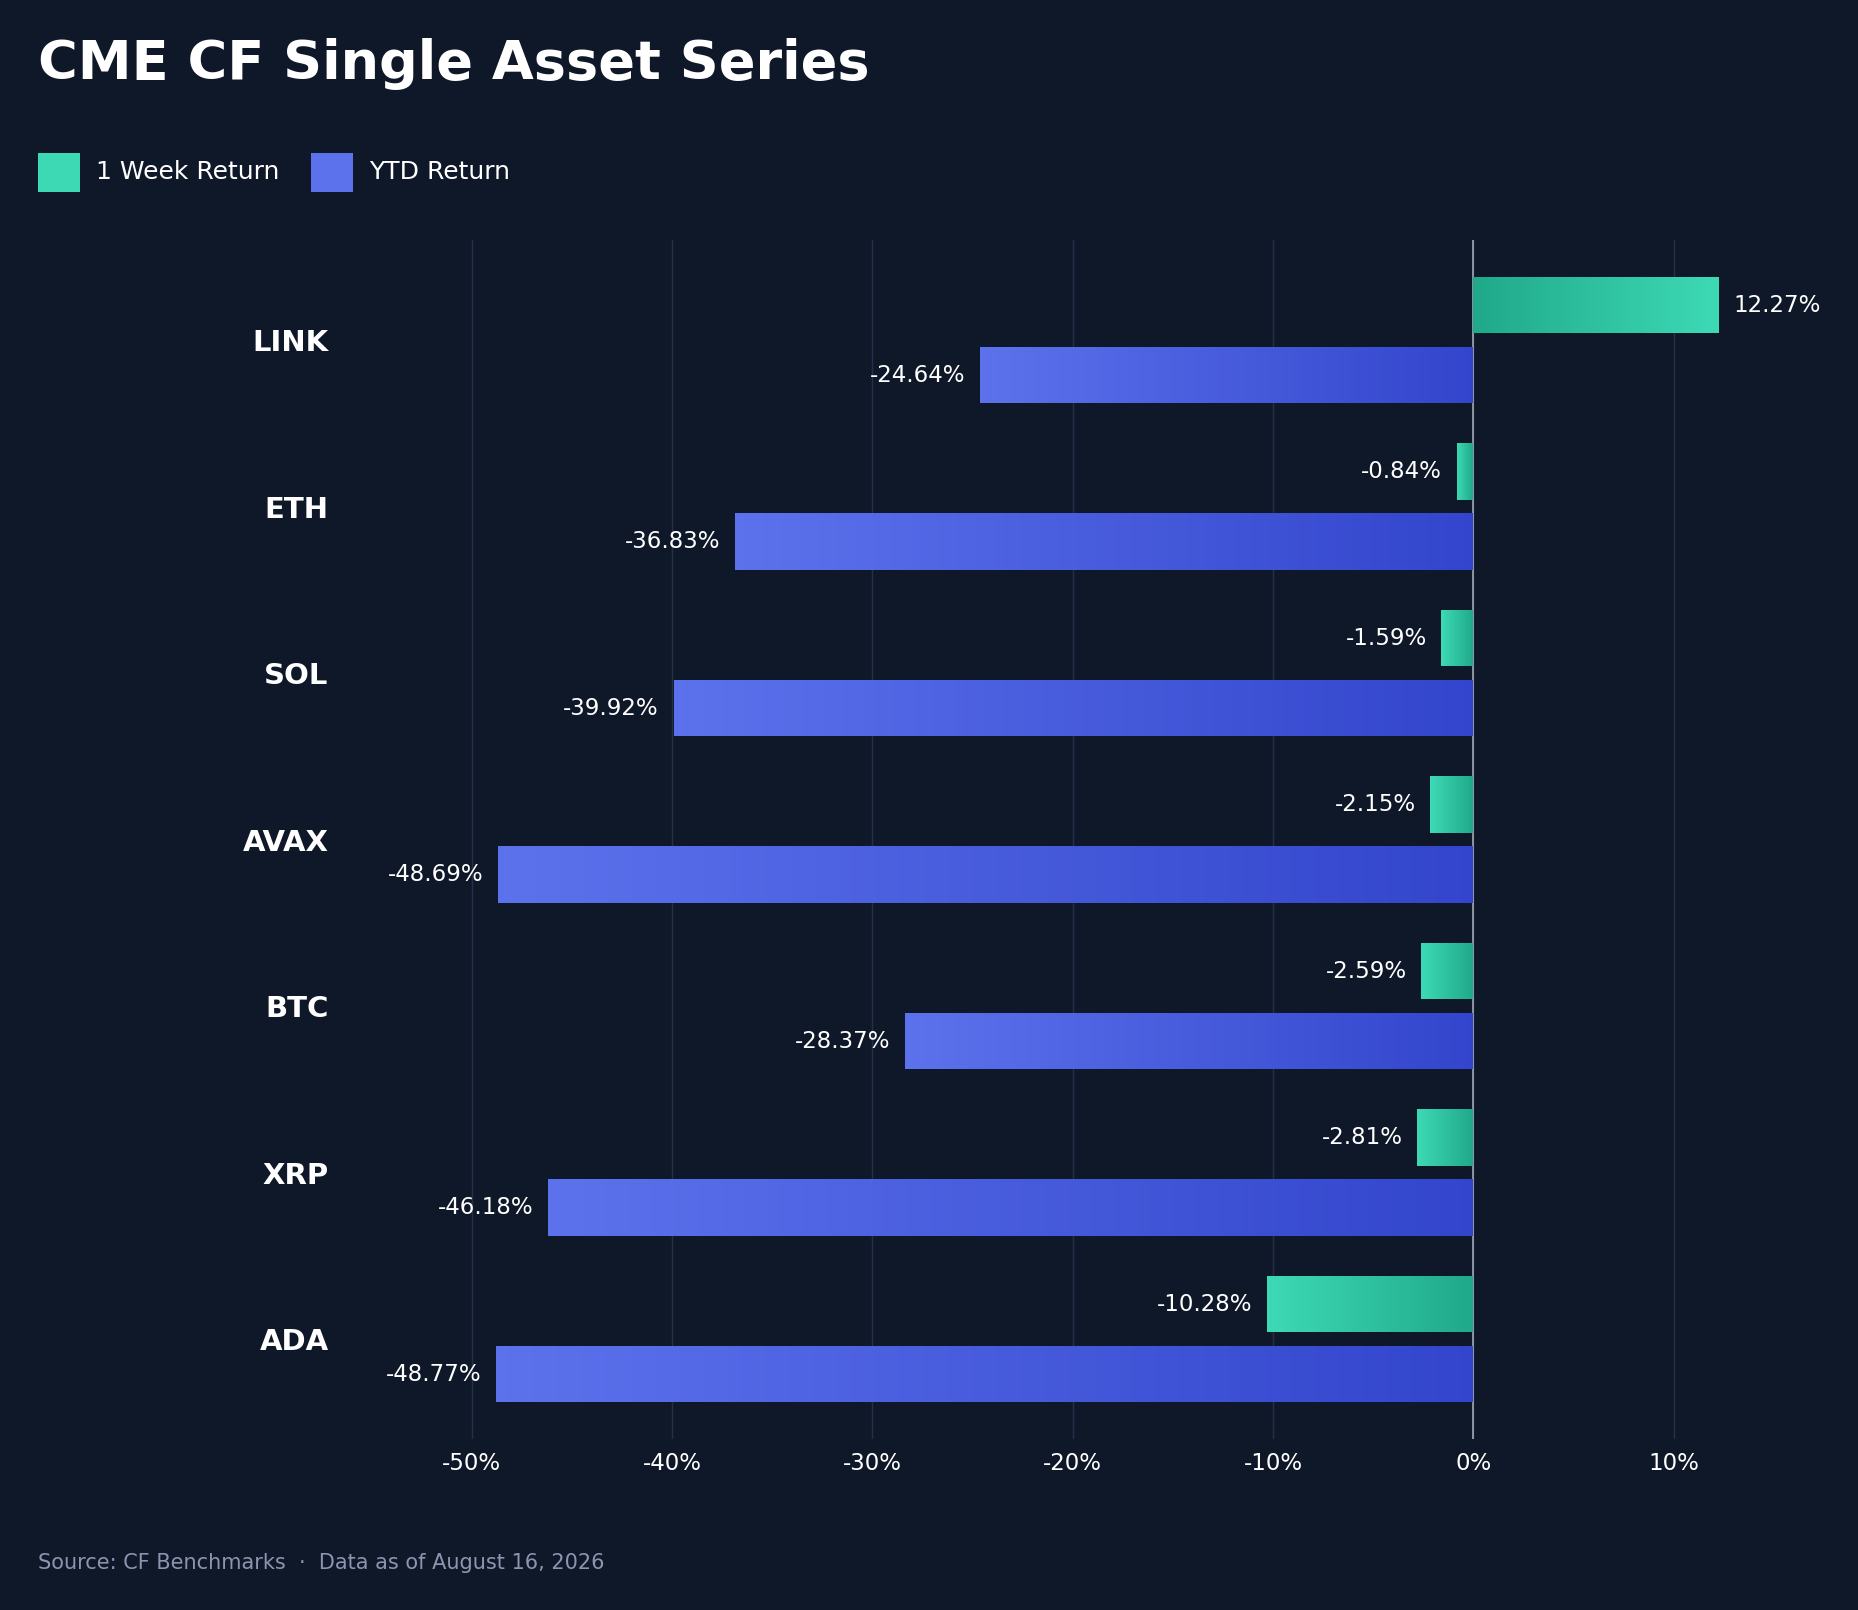
The CF Single Asset Series turned broadly lower, six of seven names down against two of seven a week earlier. Chainlink (LINK) was the only gainer and the largest mover in either direction, at 12.27%; Ether (ETH) fell 0.84%, Solana (SOL) 1.59%, Avalanche (AVAX) 2.15%, Bitcoin (BTC) 2.59% and XRP 2.81%, while Cardano (ADA) lost 10.28%. The 22.54 percentage point (pp) spread between LINK and ADA is nearly three times the prior week's 8.12 pp, so the tape fell and widened at once. It did so into a supportive rates picture: July CPI printed 0.1% MoM and 3.4% year over year (YoY), exactly in line, Thursday's PPI final demand was flat against a 0.2% consensus and 4.7% YoY against 4.9%, and the 2-year Treasury yield ended the week 3.2 bps lower at 4.17%. BTC nonetheless closed Friday at 62,875 dollars, its weakest level since August 3rd, so the majors did not monetize the softer inflation path. Spot Bitcoin ETFs redeemed on four of the week's five sessions, including 131.1m dollars in Thursday's PPI session itself, which tracks that path more closely than any release does. LINK separated from all of it on its own event, the August 13th release of Chainlink for Agents, which exposes its data feeds, its cross-chain messaging and the Chainlink Runtime Environment to autonomous agents; open interest in LINK rose to roughly 690m dollars into the move, so positioning traveled with the release rather than simply repricing it. ADA's 13.46 pp swing from 3.18% has no in-week catalyst in our ledger. YTD LINK is the strongest of the seven at -24.64% and BTC next at -28.37%, against -48.77% for ADA and -48.69% for AVAX.
Volatility Analysis
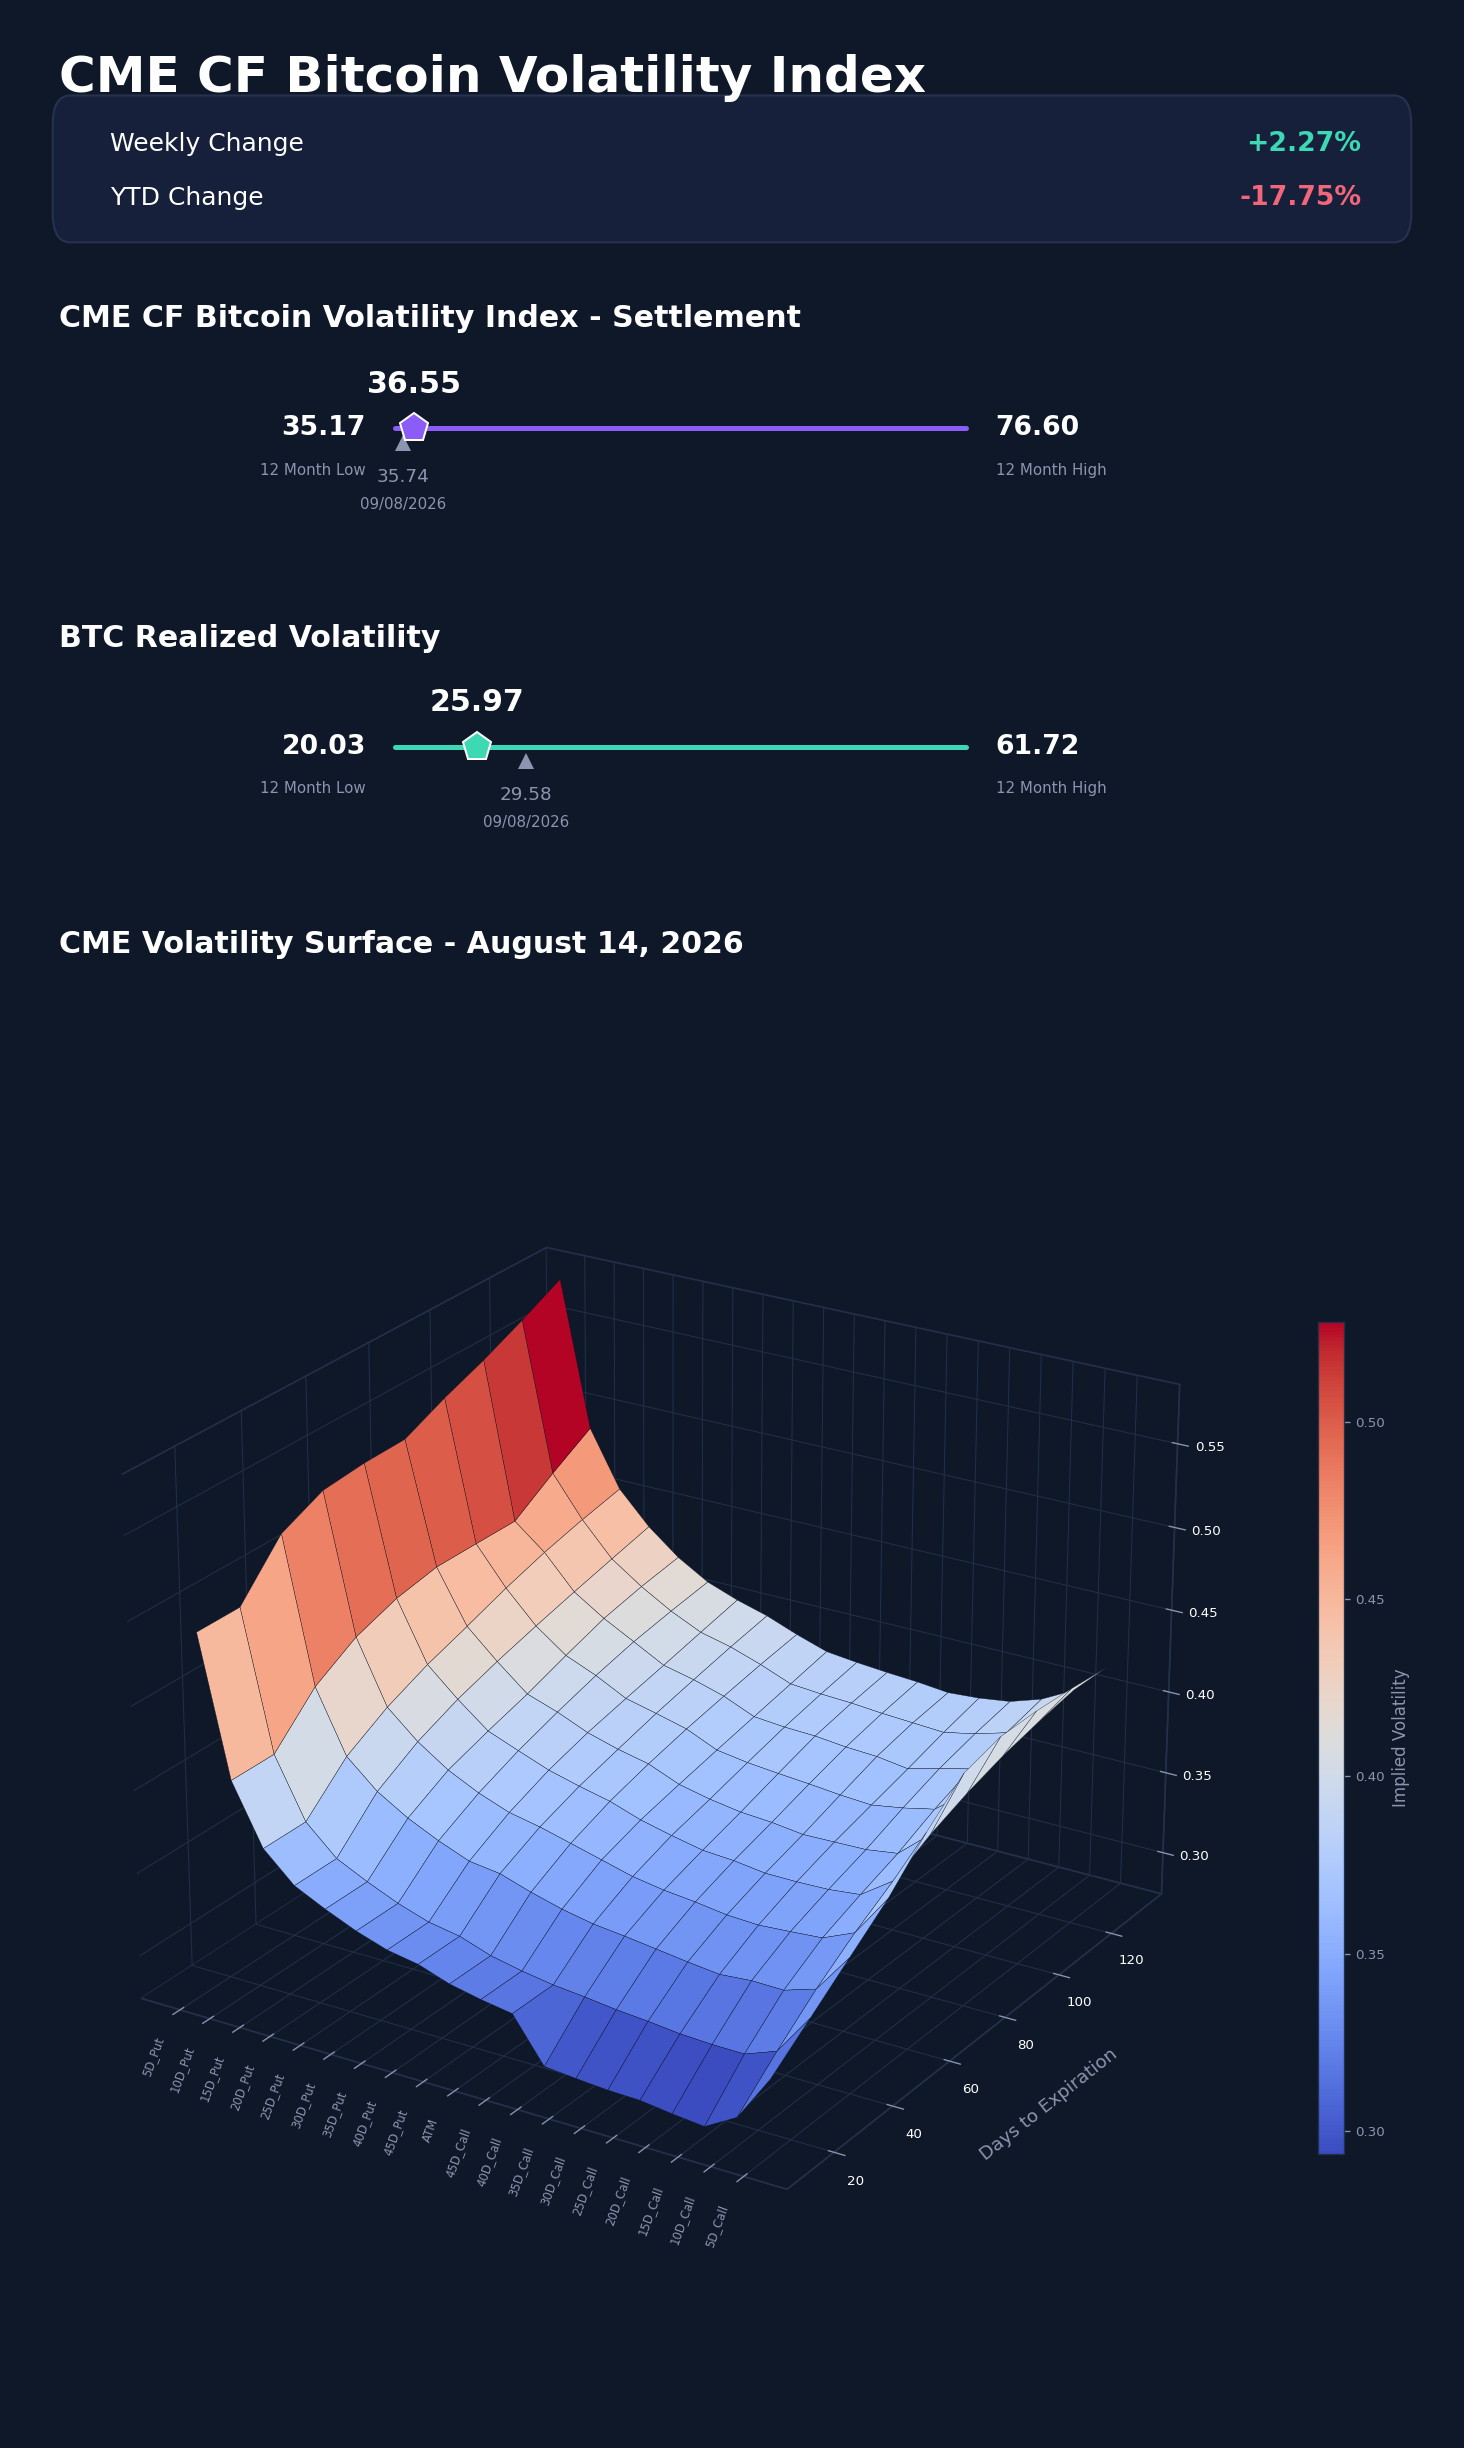
Implied volatility rose while the market moved less. BVXS settled at 36.55, up 0.81 of a vol. point and 2.27% w/w, and now sits 1.38 vol. points above its 12-month low of 35.17 against a 12-month high of 76.60; YTD the settlement index is 17.75% below its 44.44 start-of-year reference. The in-week path peaked at 37.30 on Tuesday August 11th, troughed at 36.05 on Thursday August 13th and finished at 36.55, above where it started the week but below its midweek high. Realized volatility went the other way, falling 3.61 vol. points to 25.97 and declining at every fix after Tuesday, which widened the implied-realized spread to 10.58 vol. points from 6.16 a week earlier. Selling that compresses daily ranges while the settlement index prices more forward risk is a hedging bid, not a stress event. The surface makes the same point through the call side. At the nearest matched tenors, 26 days against 27 days a week earlier, the mean shift across the nineteen quoted deltas was -0.94 of a vol. point, but the 5-delta call fell 2.27 points and the 10-delta call 1.41, against 0.72 for the 5-delta put and 0.53 at-the-money. The 5-delta call wing, its premium over at-the-money, flattened 1.74 points to 2.02 while the 5-delta put wing held at 17.27, and the 25-delta risk reversal narrowed from -4.42 to -3.86. The market stopped paying for upside convexity and left its downside protection in place.
Market Cap Index Performance
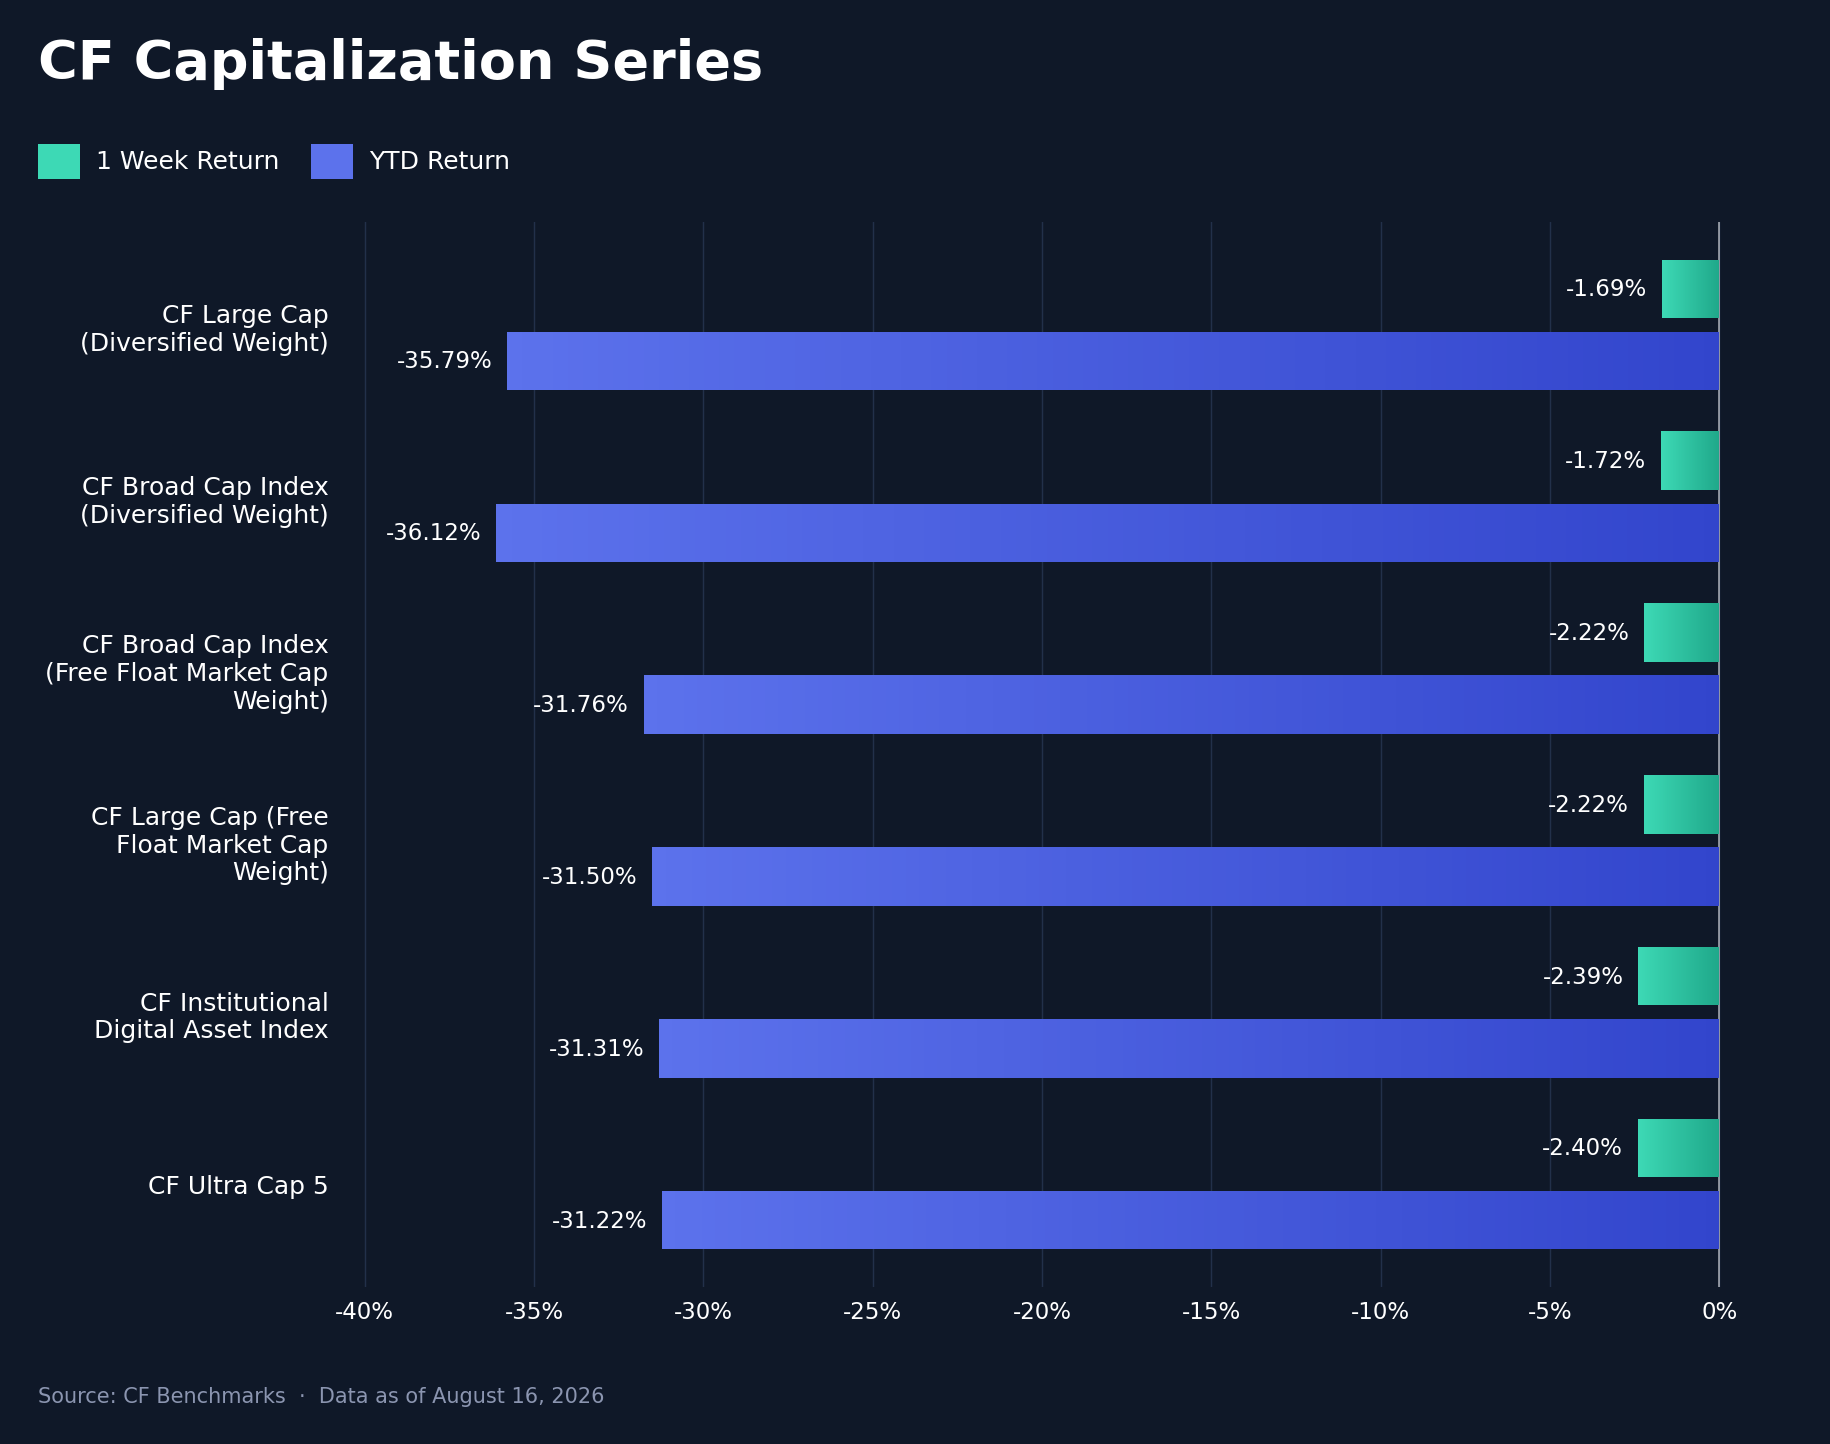
Every CF Capitalization Series index fell, reversing a week in which every one of them rose, and the whole set fits inside a 0.712 pp band. CF Large Cap (Diversified Weight) held up best at -1.692%, ahead of CF Broad Cap Index (Diversified Weight) at -1.717%, CF Broad Cap Index (Free Float Market Cap Weight) at -2.217% and CF Large Cap (Free Float Market Cap Weight) at -2.223%; the CF Institutional Digital Asset Index fell 2.389% and the CF Ultra Cap 5, the most concentrated construction of the six, 2.404%. Diversified weighting outperformed free float in both families, by 0.532 pp in Large Cap and 0.501 pp in Broad Cap, having lagged by 0.435 pp and 0.488 pp respectively a week earlier. The loss was heaviest where index weight is most concentrated, and the flow data points the same way: the week's spot Bitcoin redemptions came through BlackRock's IBIT, Fidelity's FBTC and the two Grayscale vehicles, while spot Solana products took in 10.26m dollars, their best week since May, and spot Ether products were effectively flat at -2.25m dollars after five positive weeks. A withdrawal centred on the largest Bitcoin vehicles is what makes the diversified-versus-free-float gap read like better breadth than the constituent table supports.
Factors Analysis
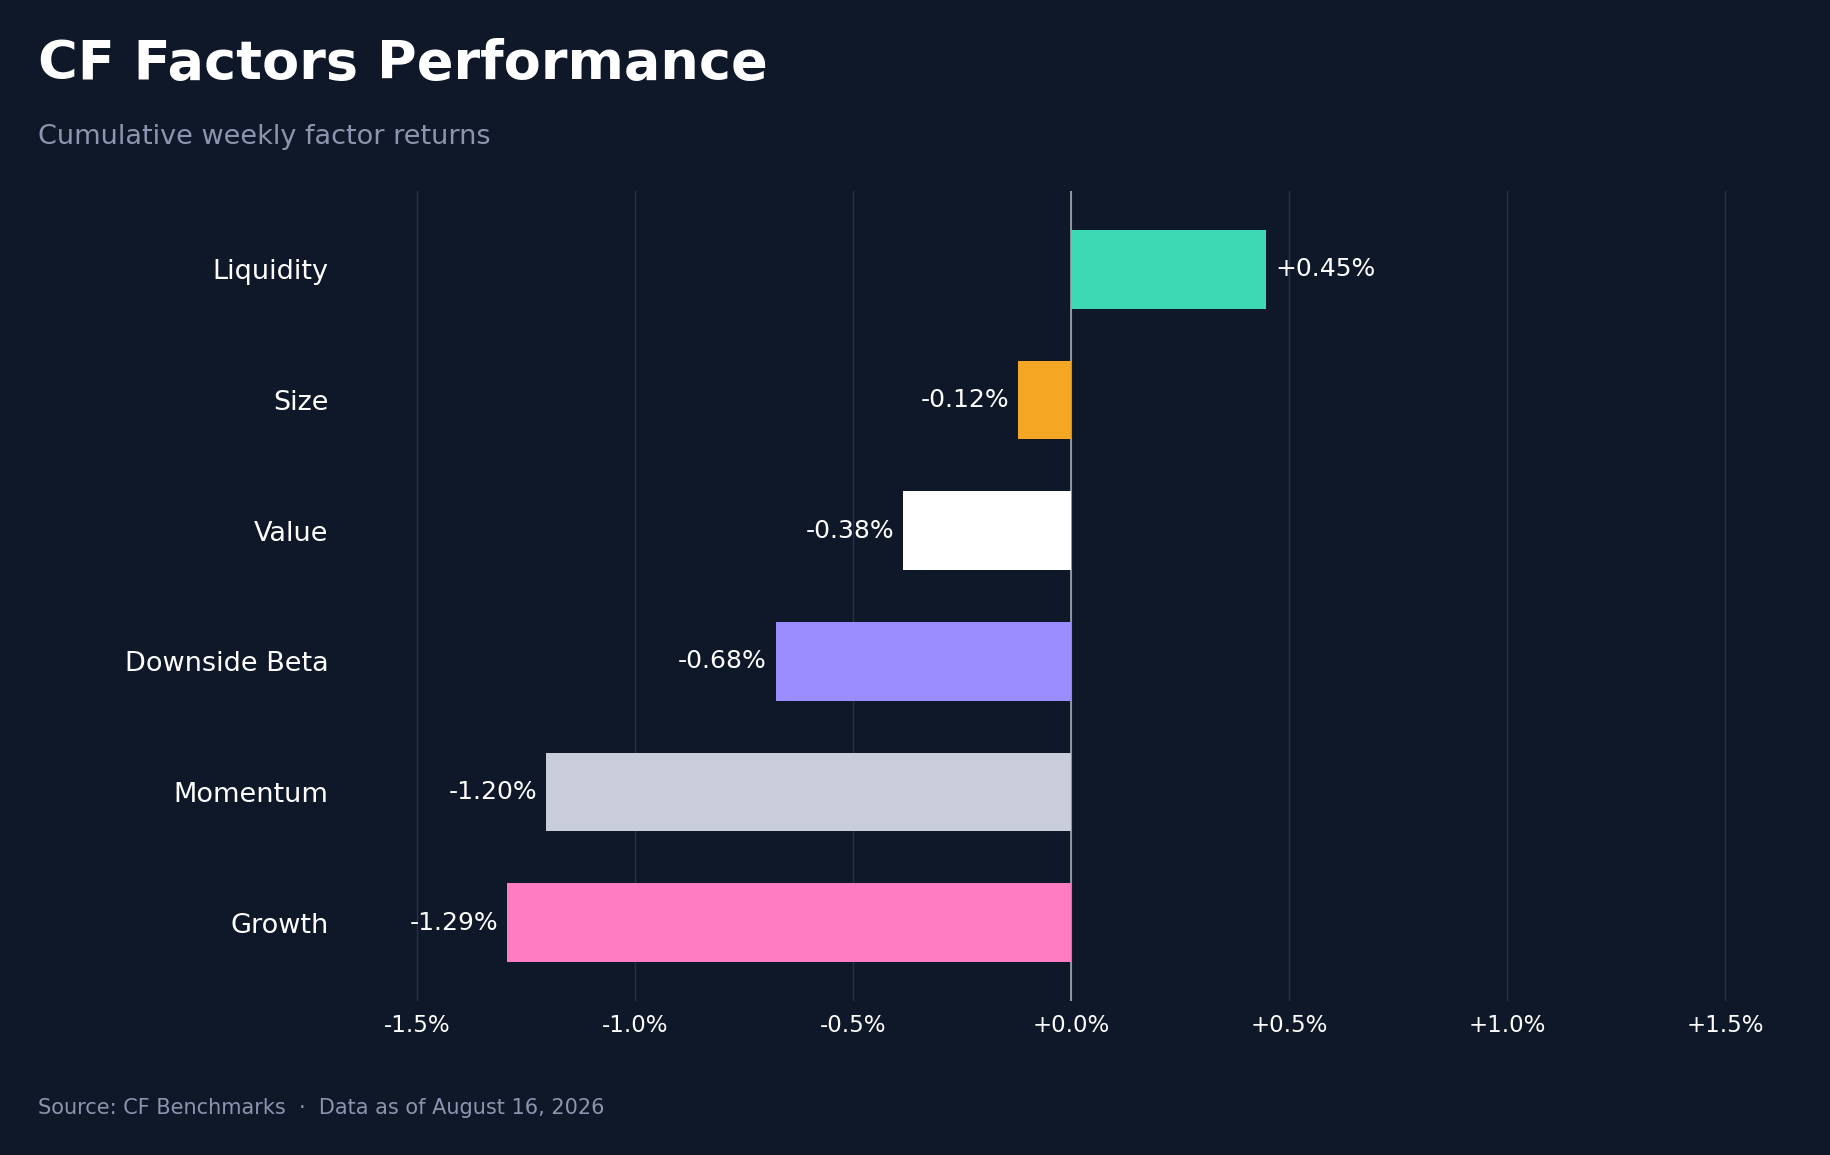
Factor dispersion collapsed. Liquidity was the only factor to finish higher, at 0.45% after 0.37% a week earlier and the only one positive in both; Size fell 0.12%, Value 0.38%, Downside Beta 0.68%, Momentum 1.20% and Growth 1.29%. The 1.74 pp range is less than half the prior week's 3.76 pp, so the week's spread sat in single names rather than in styles. Both reversals ran against the prior week's leaders: Size swung 1.64 pp from 1.52% to -0.12% and Growth 1.44 pp from 0.15% to -1.29%. Downside Beta improved 1.57 pp and moved off the bottom of the set, but it has now lost in a rising tape and again in a falling one, so high-downside-beta exposure has not paid in either direction. A falling tape that produces no style leadership is a de-risking that withdrew capital without repricing factor risk.
Read our latest weekly crypto factors report: Factor Friday - August 14, 2026
Classification Series Analysis
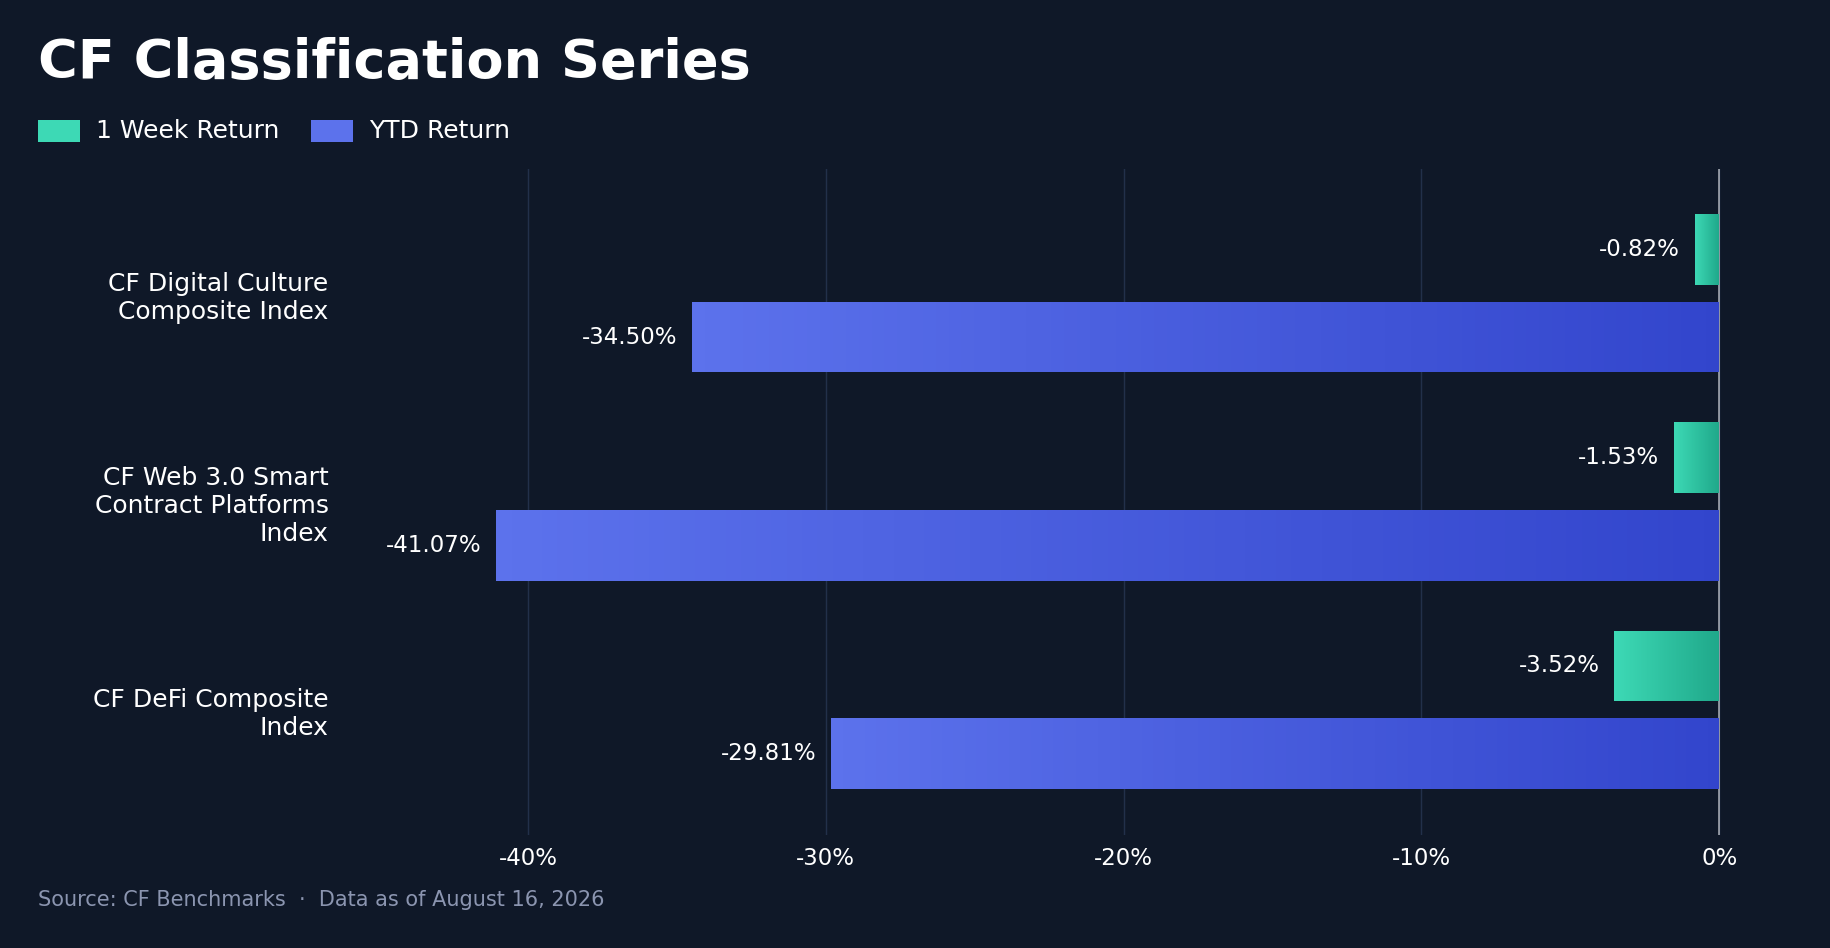
All three CF Classification Series composites fell and the leadership gap all but closed. The CF Digital Culture Composite Index held up best at -0.82%, ahead of the CF Web 3.0 Smart Contract Platforms Index at -1.53% and the CF DeFi Composite Index at -3.52%, a 2.69 pp spread between best and worst against 10.57 pp a week earlier. Digital Culture came off a 10.11% advance and gave back almost none of it, while DeFi went from -0.46% to the weakest of the three, tracking the losses in the CF DACS Finance constituents. On a YTD basis the ranking is unchanged, with DeFi at -29.81% ahead of Digital Culture at -34.50% and Web 3.0 at -41.07%, so neither week of leadership has moved the year.
Sector Analysis
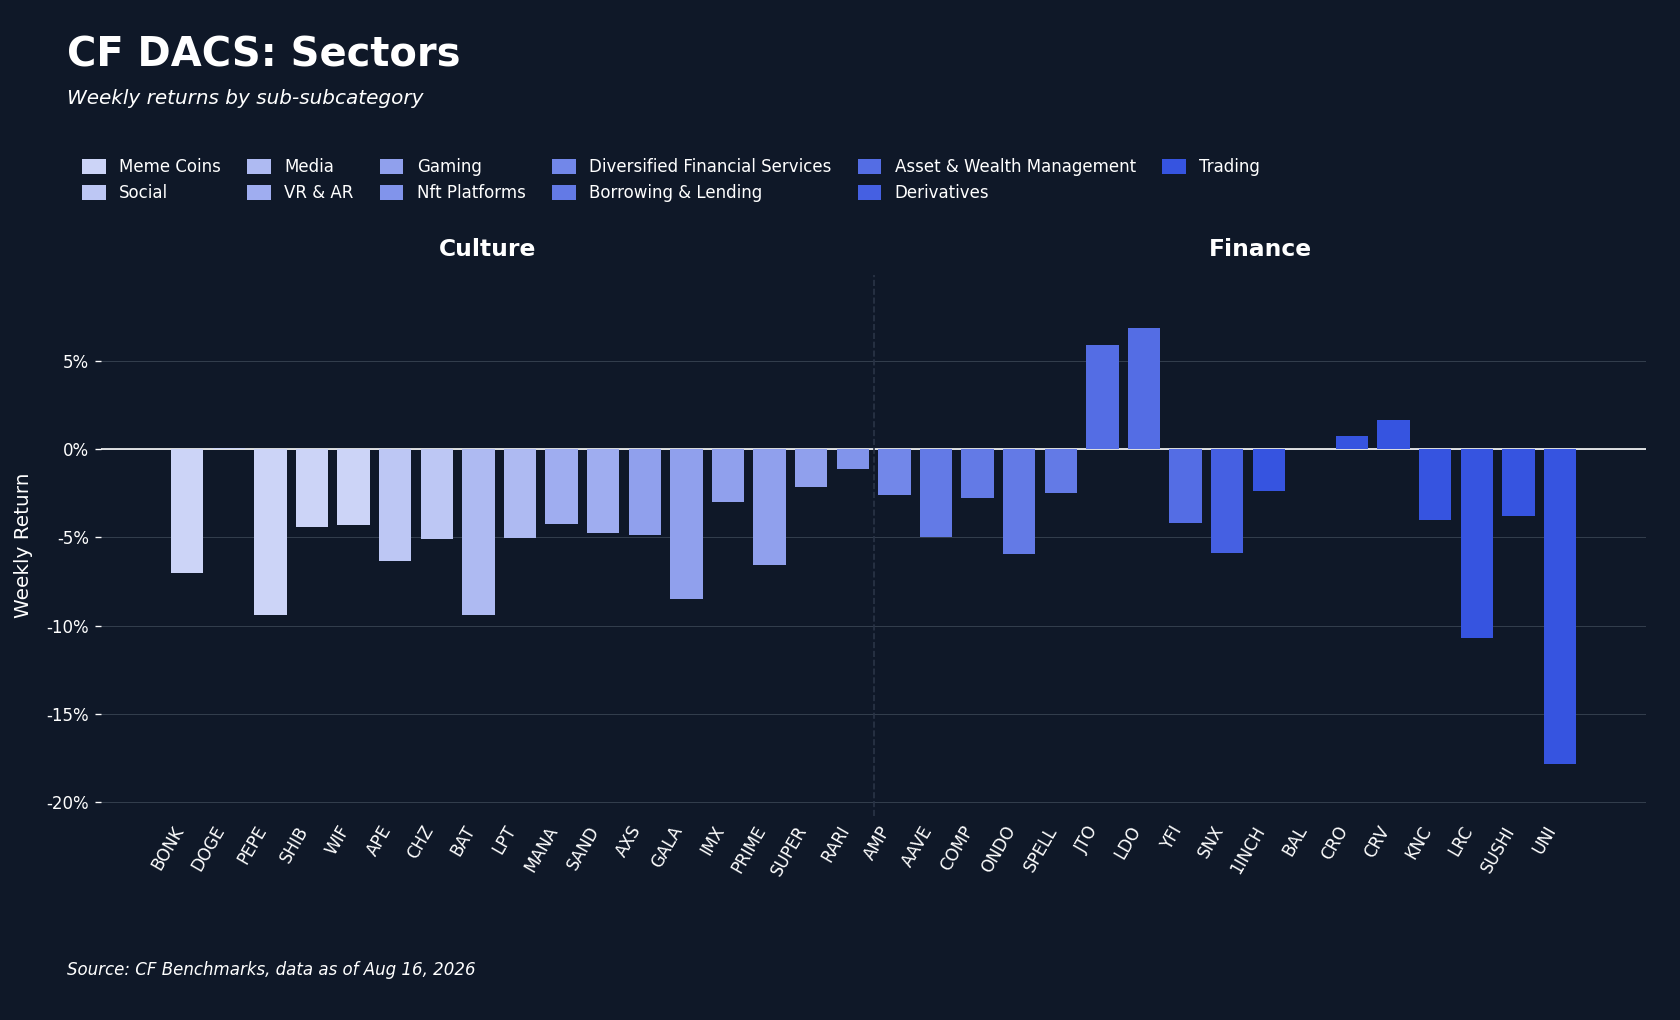
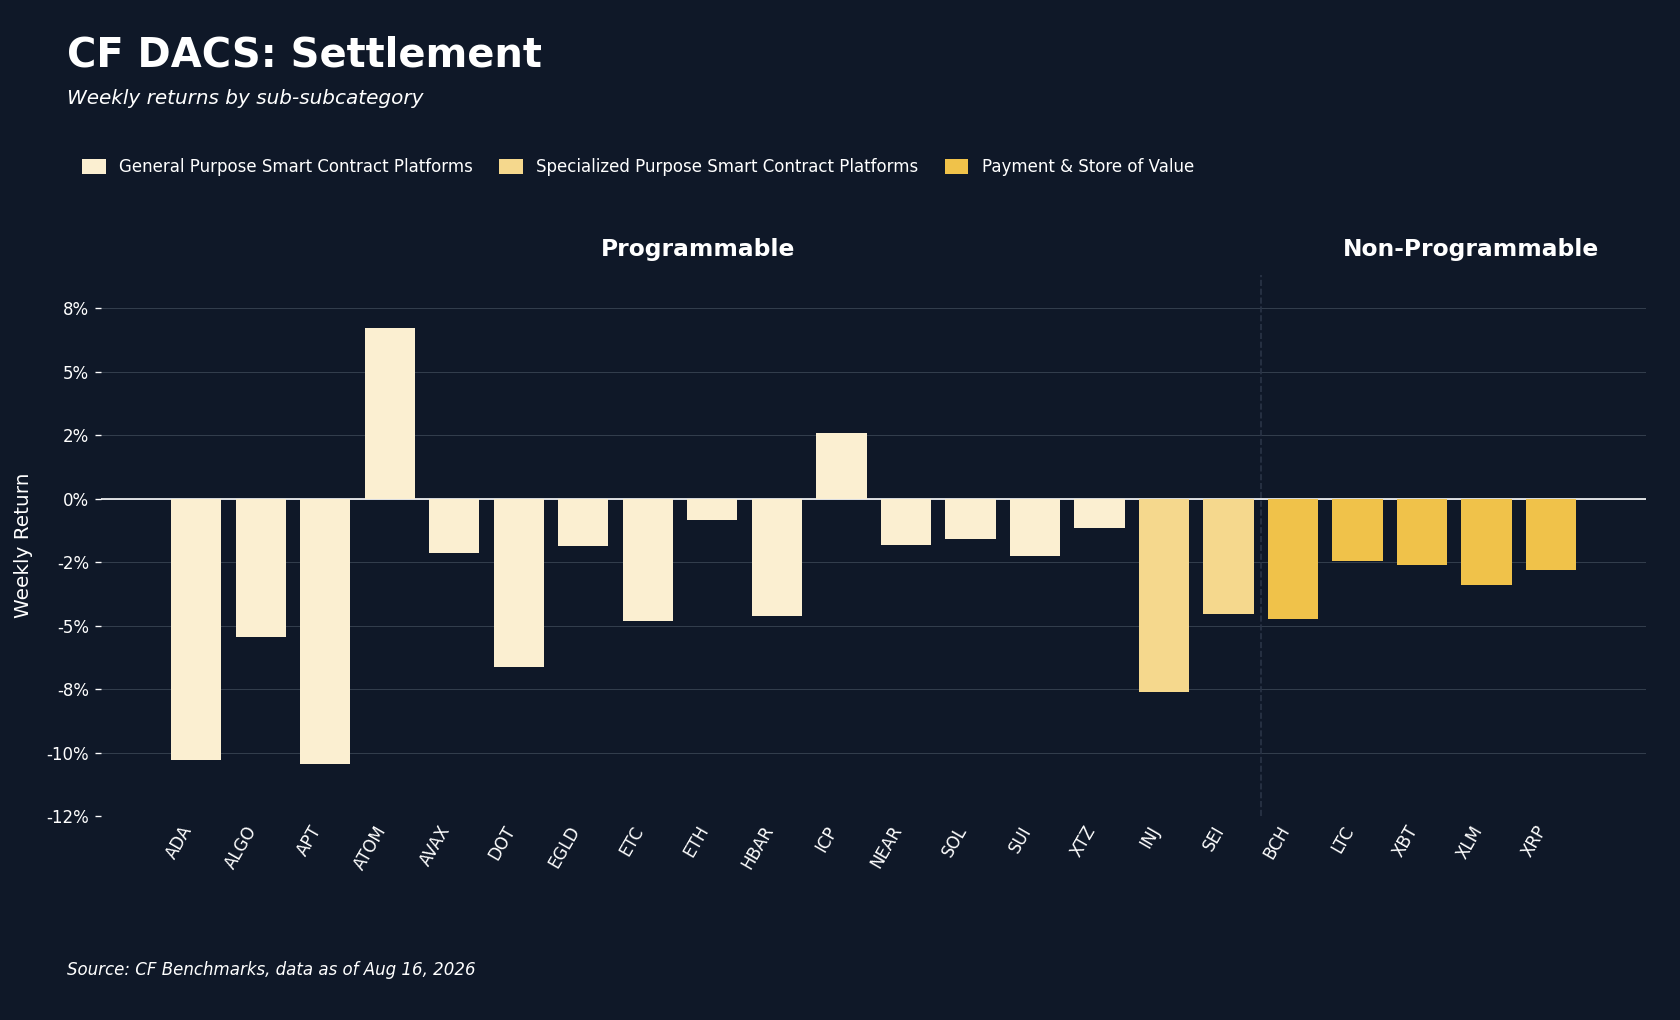
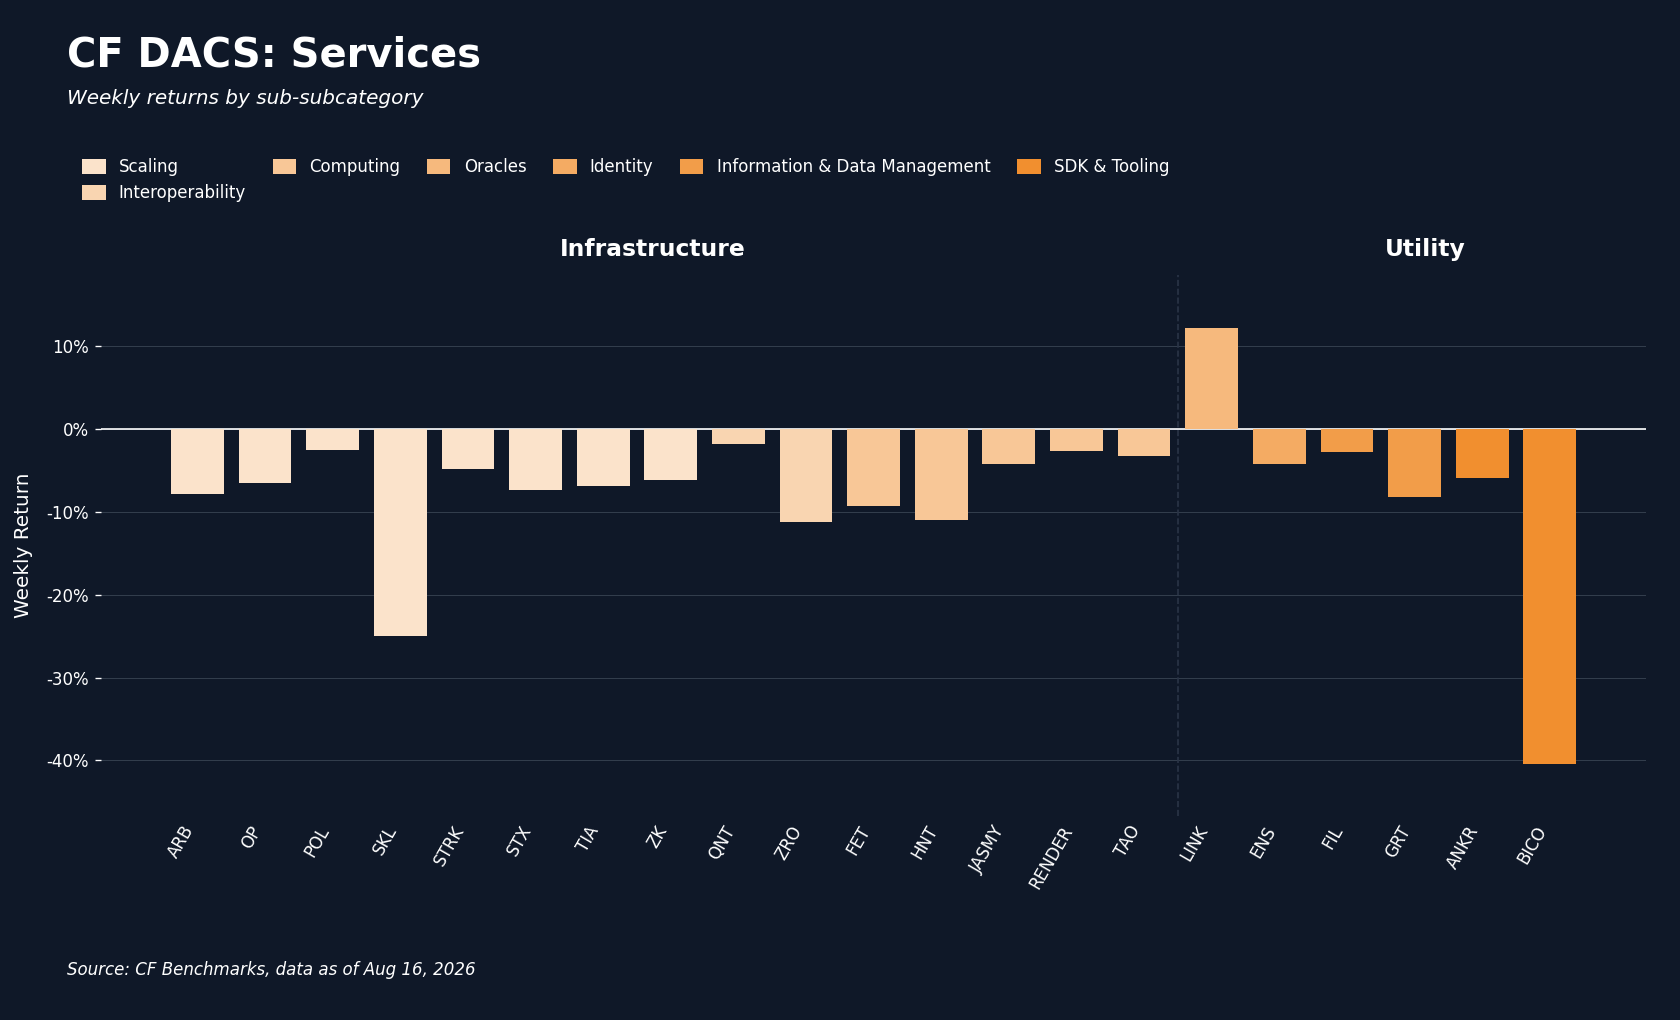
Every CF DACS Sub-Category fell, and the spread between the best and worst came down to two names. Finance held up best at -3.07%, ahead of Non-Programmable at -3.20% and Programmable at -3.34%, while Culture fell 5.06%, Infrastructure 7.37% and Utility 8.17%, a 5.10 pp band; the median constituent fell 4.30%, against a flat median and 38 of 77 constituents higher a week earlier. Utility sits at the bottom of that table while holding the week's best constituent. Chainlink is the only Oracles name in the sub-category, so its gain on the release described above arrives as a single position, while Biconomy (BICO) fell 40.41% in the same block, giving back roughly seven tenths of the 141.12% perpetual-listing squeeze of the prior week and leaving the token 43.68% above its pre-squeeze base. The two set the widest token-level spread of the week at 52.68 pp; on the next-widest pair, Lido (LDO) at 6.90% against SKALE (SKL) at -25.00%, the spread is 31.90 pp, and excluding BICO the Utility average is -1.73%, which is the more useful read of the sub-category. Finance carried the week's regulatory casualty in two legs. Uniswap (UNI) fell 17.83%, the weakest name in the sub-category: the first leg, on August 12th, came with no protocol or legal news and about 2.88m dollars of long liquidations against roughly 2,000 dollars of shorts, and the second followed the SEC's further delay of its tokenization innovation exemption on August 13th and the cancellation of the August 14th vote, with UNI down roughly 7.0% in the twenty-four hours after. LDO led the same sub-category, recovering from the 9.38% decline that followed the EIP-8361 filing a week earlier, so this is not a sector de-rating. In Programmable, Aptos (APT) at -10.44% and ADA at -10.28% sat at the bottom; APT's core-contributor and investor unlock on August 10th accounts for part of that, with the sourced same-day reaction at 3% to 4% against the weekly figure. SKL's decline, the worst in an Infrastructure block that averages -6.11% without it, has no dated in-week explanation in our ledger.
CF Staking Series
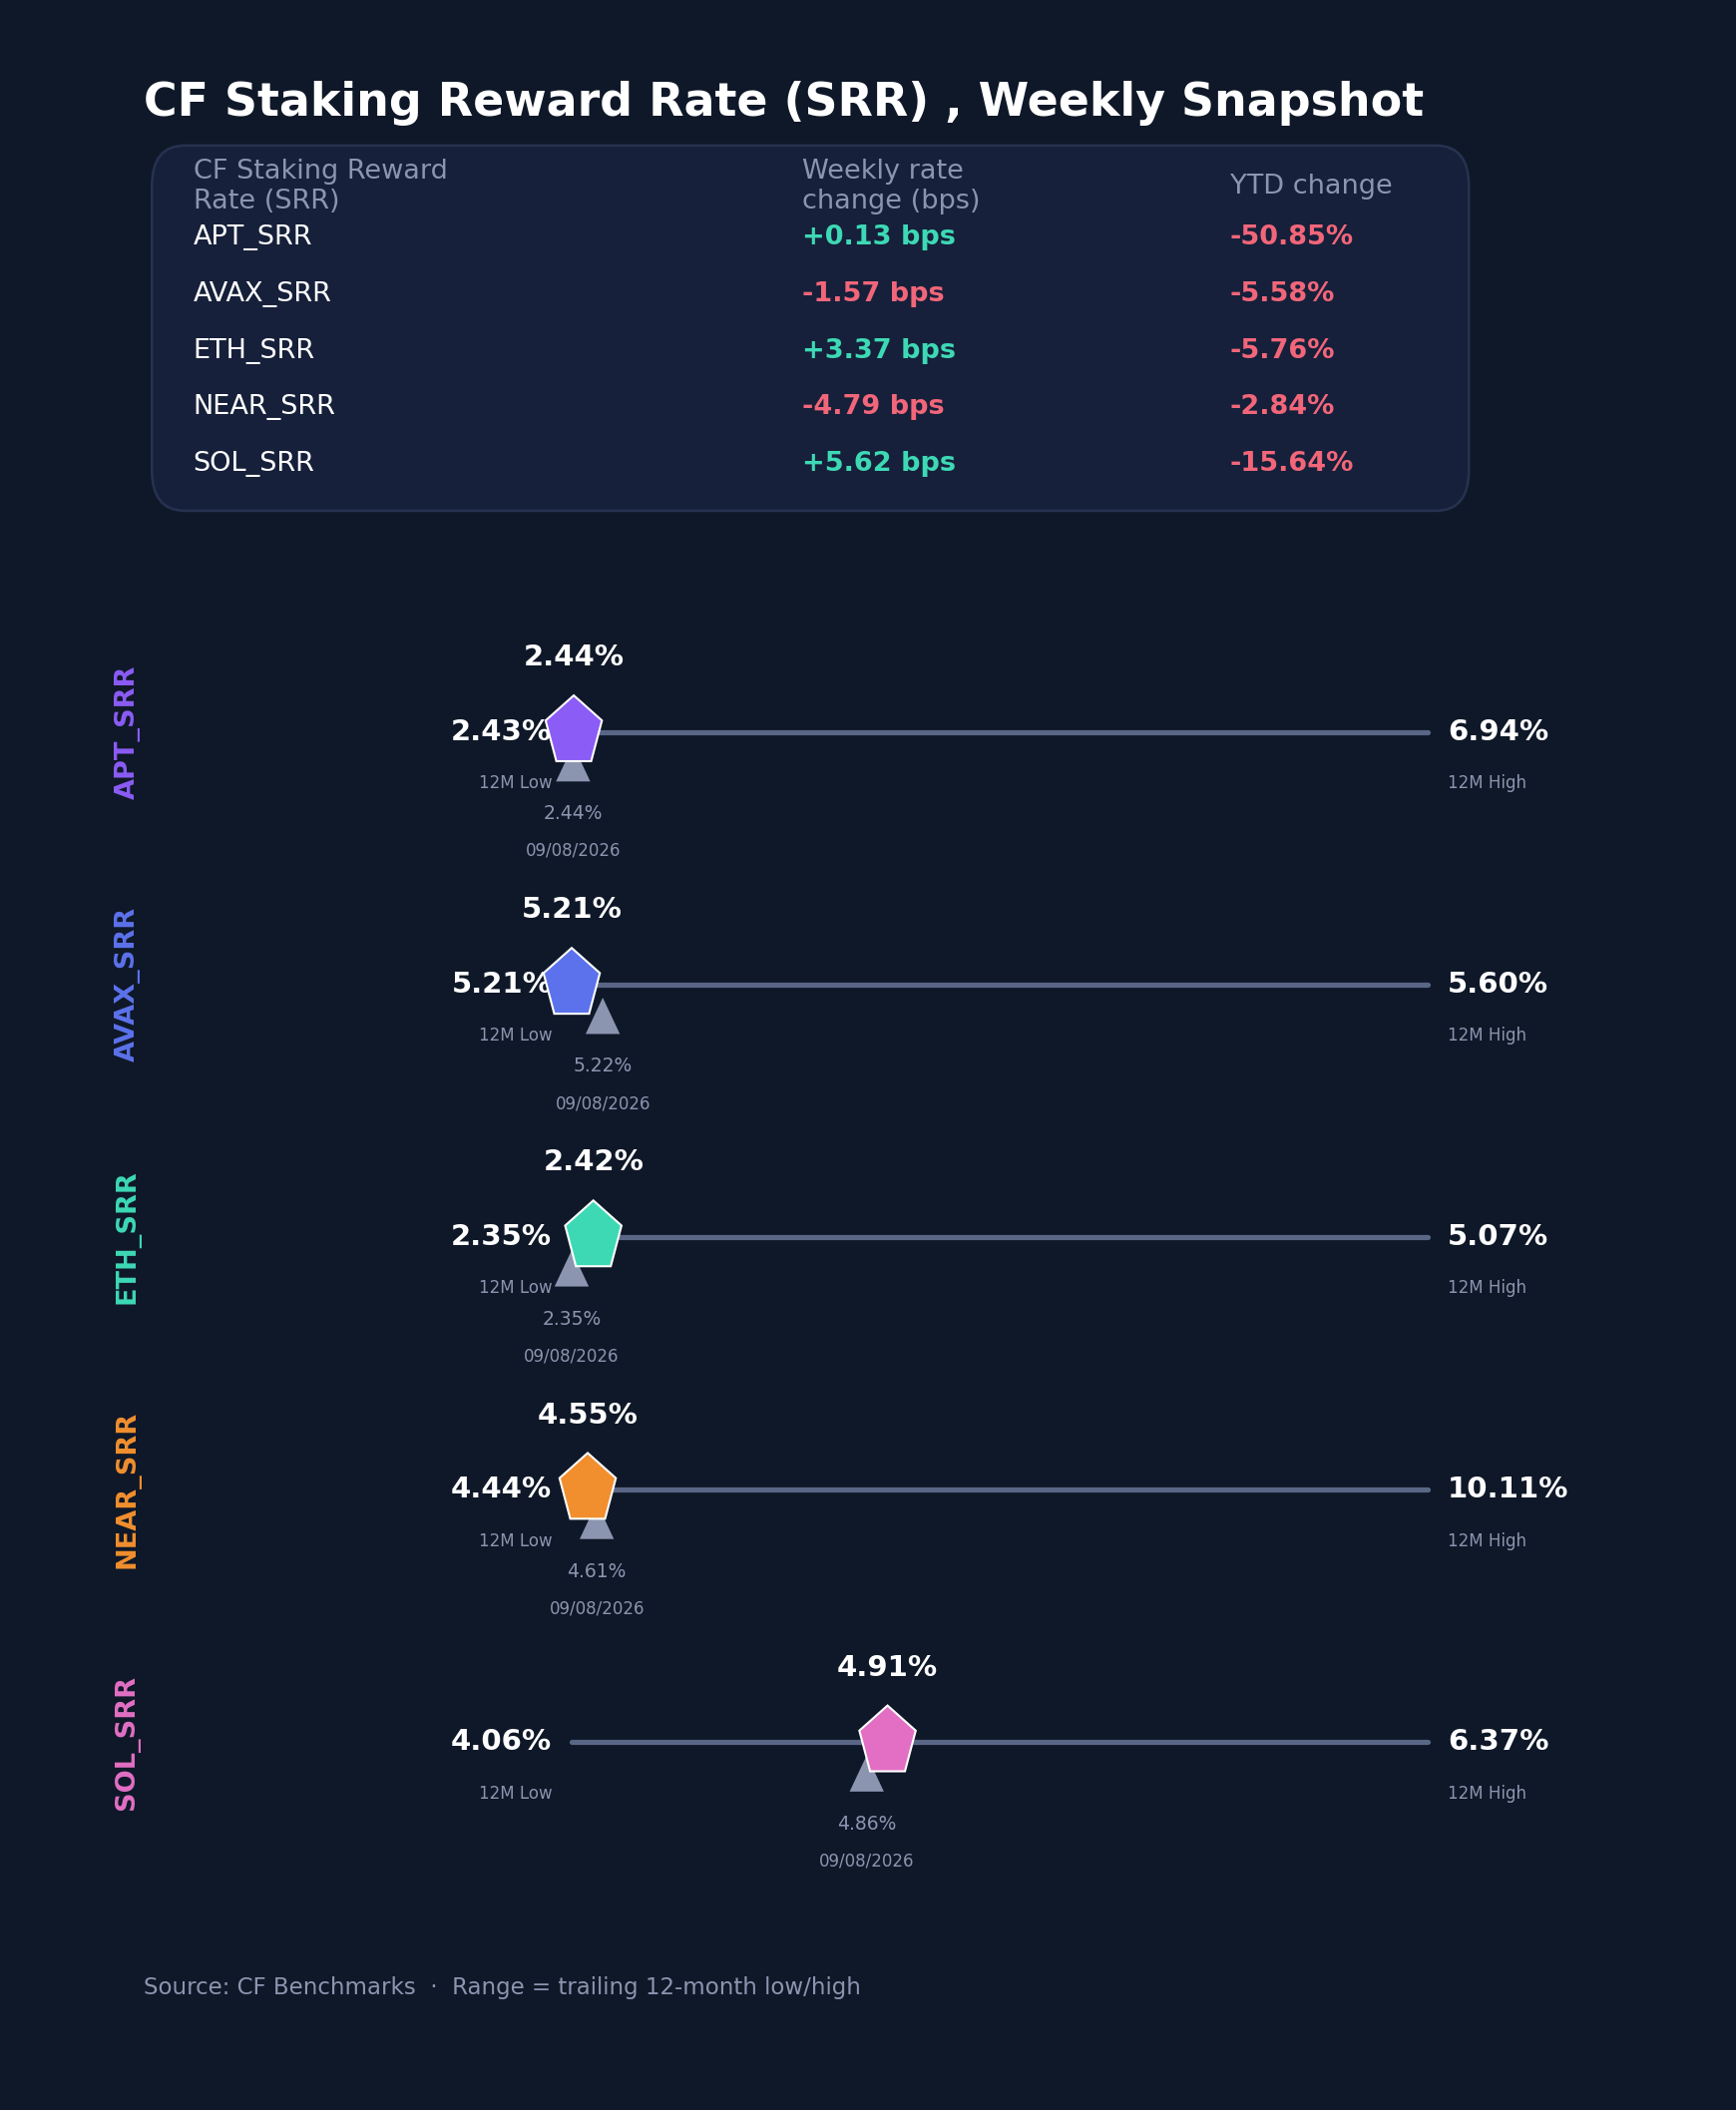
Reward rates diverged after a week in which all five fell. Solana (SOL) added 5.62 bps to 4.9137% and Ether (ETH) 3.37 bps to 2.4205%, off the 12-month low of 2.3518% it set the week before, while Aptos (APT) was effectively unchanged at 2.4394%, up 0.13 bps. NEAR fell 4.79 bps to 4.5489% and Avalanche (AVAX) 1.57 bps to 5.2050%, a fresh 12-month low. Relative index returns spanned 2.45 pp, from ETH at 1.41% and SOL at 1.16% to NEAR at -1.04%. Current rates range 278.5 bps across the set, from ETH's 2.4205% to AVAX's 5.2050%. AVAX printing a 12-month low in validation compensation while its token fell 2.15% is the more durable observation: staking yields on this set have compressed through the year regardless of price, and the CF Staking Series followed that path with lower volatility than spot markets.
Interest Rate Analysis
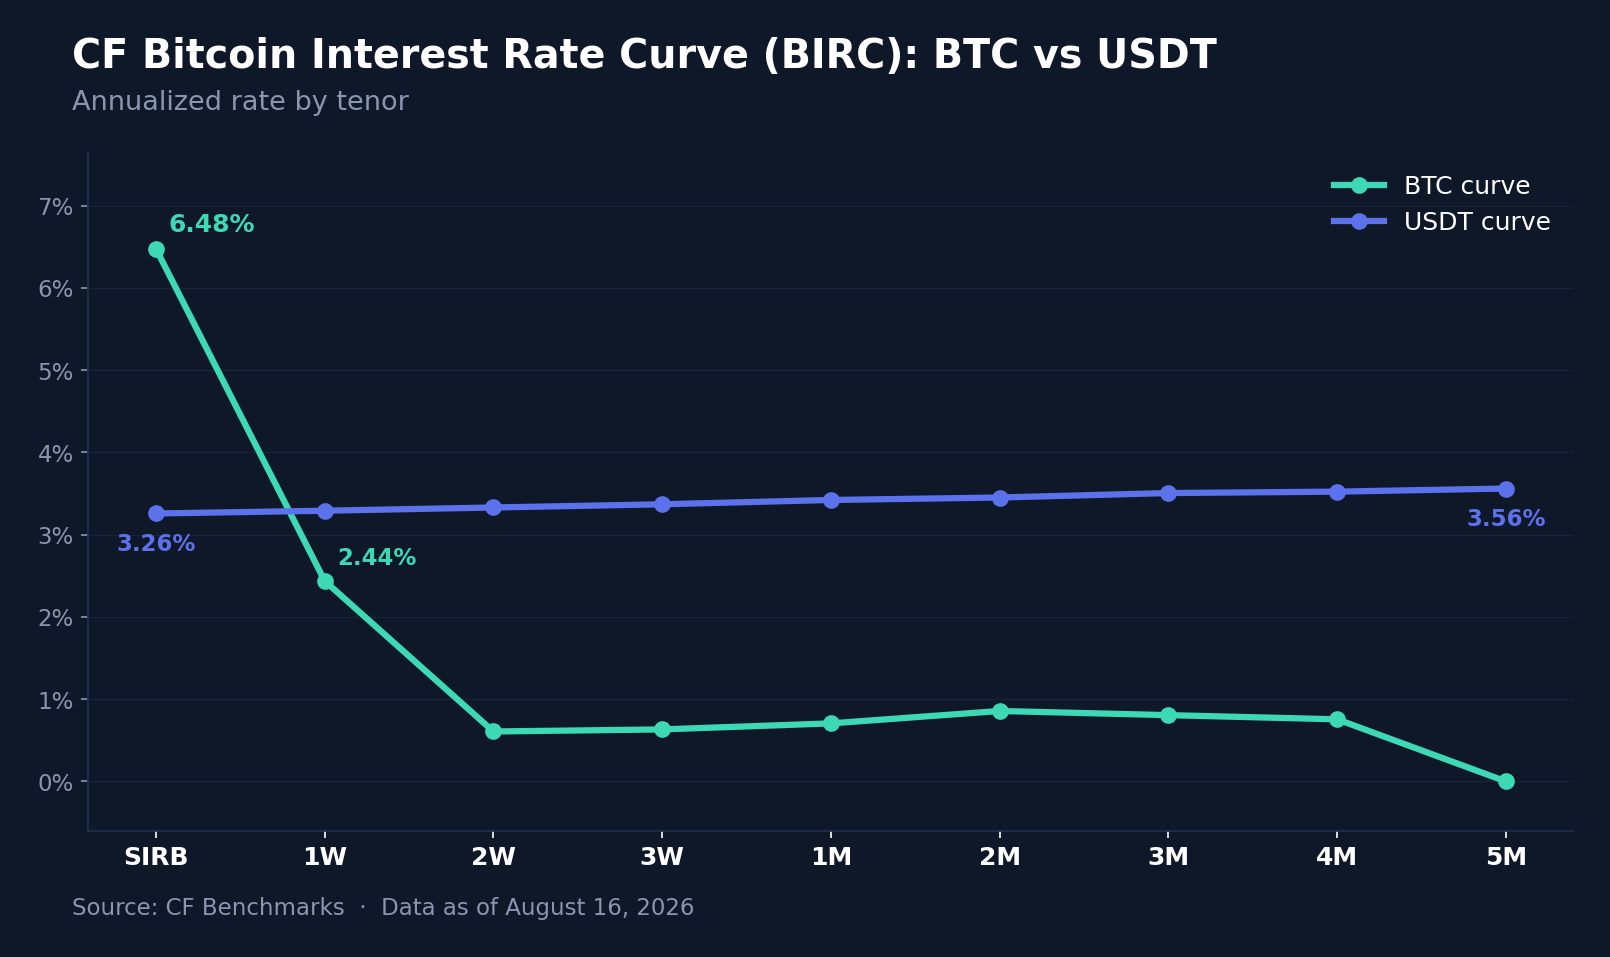
The CF Bitcoin Interest Rate Curve (BIRC) unwound the prior week's front-end squeeze. The Bitcoin Session Rate (SIRB) fell 192.4 bps to 6.4777%, and the BTC curve came down with it: 1-month lower by 114.6 bps to 0.7062%, 2-week by 93.8 bps to 0.6076%, 3-week by 88.7 bps to 0.6329%, 2-month by 39.7 bps to 0.8570%, 3-month by 29.9 bps to 0.8063% and 4-month by 20.1 bps to 0.7557%. Only the 1-week rose, by 16.0 bps to 2.4380%, and the 5-month printed 0.0000% for a third consecutive week, a real level that marks the continued absence of a bid for term BTC lending at that tenor. The curve stays inverted, by 572.2 bps from SIRB to the 4-month, though that is 172.3 bps less inverted than a week ago. The USDT curve moved the other way and moved together, rising 17.0 to 20.0 bps at every tenor and holding its upward slope from 3.2584% at SIRB to 3.5619% at five months. Across both curves tenor changes ran from -192.4 bps to 20.0 bps. Bitcoin collateral came back to the market while the cost of term dollars rose, which is two different pressures rather than one funding impulse.
Closing Synthesis
The week is best read as a demand failure rather than a risk event. Two cooler inflation prints cut September hike odds by 23 pp and put US equities at a record close, and digital assets declined into it, with the largest spot Bitcoin redemptions in six weeks coming through the biggest vehicles. The internals carry no stress: realized volatility fell 3.61 vol. points, the Bitcoin Session Rate gave back 192.4 bps of the prior week's squeeze, and factor dispersion more than halved. What did get priced was idiosyncratic, sitting in the gap between the week's best and worst CF DACS constituents and in a settlement index that firmed while the market moved less. A market that will not price a discount-rate improvement is a market waiting on a buyer, and for now that buyer is not in the largest Bitcoin funds.
The information contained within is for educational and informational purposes ONLY. It is not intended nor should it be considered an invitation or inducement to buy or sell any of the underlying instruments cited including but not limited to cryptoassets, financial instruments or any instruments that reference any index provided by CF Benchmarks Ltd. This communication is not intended to persuade or incite you to buy or sell security or securities noted within. Any commentary provided is the opinion of the author and should not be considered a personalised recommendation. Please contact your financial adviser or professional before making an investment decision.
Note: Some of the underlying instruments cited within this material may be restricted to certain customer categories in certain jurisdictions.
Factor Friday - September 18, 2026
Value led CF Benchmarks' factor table for a third straight week at 1.85%, even as its pace cooled. Growth flipped positive while Downside Beta turned negative for the first time in three weeks, and the Market's decline eased sharply to 0.70% from last week's near-5% drop.

Mark Pilipczuk
Changes to the Token Market Price Benchmarks Series - Market Prices – 15 September 2026
The Administrator has confirmed changes to the Token Market Price Family for the period 08 September 2026 to 15 September 2026
CF Benchmarks
Emerging Leaders, Established Activity
The CME CF Emerging Crypto Index provides rules-based exposure beyond Bitcoin and Ether, capturing networks that account for most observed protocol fees and user activity while applying the institutional standards required for a credible benchmark.
CF Benchmarks
By clicking Accept, you consent to CF Benchmarks's use of cookies.
Visit Cookie Settings to learn how CF Benchmarks uses cookies and to adjust your preferences.