
Oct 19, 2025
CF Benchmarks Newsletter Issue 93
Reset
After reportedly the biggest incidence of mass ‘degen’ account implosions in the history of crypto, it’s a fair expectation that markets will remain on edge for a spell.
From a realized volatility view, this downturn is a relatively committed one. The move down from Bitcoin’s daily top above just $124k, on October 6th, to the current cycle low on Friday October 17th, circa $103k, represents a ~2.5–3.0 standard deviation collapse, on a 30-day volatility basis. That’s larger than the ~1–1.7 sigma tariff scare of late-May, and the even more moderate wobble in early-August.
The obvious (largely unanswerable) question is: how extended of a spell might this be?
Subscribers to CF Benchmarks’ Research & Insights have additional credible ‘signal’ at their disposal, regardless of market conditions, with our research team’s Q4 Outlook 2025 report dropping days before the rout.
Packed with macro and price return forecasts, plus projections of the most critical secular trends to watch during the quarter and more, our readers have the informed context required to better understand the drawdown in the round.
Scroll down now for a summary and excerpts from the Q4 Outlook report, or carry on here, where we’ll integrate select insights.
Top to bottom
Our CME CF Bitcoin Reference Rate (BRR) – flagship of the most liquid family of regulated BTC benchmarks (the CME CF BRRNY variant equates to $100 billion in ETF AuM alone) – printed what could turn out to be a particularly memorable top, at $124,961.8, on October 6th.
BRR’s low, so far, for this ‘crash’ was marked on Friday October 17th at $105,294.67.
The ‘streaming’ per-second variant, BRTI, scraped as low as $103,986.58 (using 30-minute measurement intervals) on Friday morning.
Meanwhile, CME Ether-Dollar Reference Rate (ETHUSD_RR) the most trusted institutional ETH benchmark, recorded a drawdown of similar severity to Bitcoin over the same window, tumbling from $4,654.96 on October 6th, to print at $3,759.03 on October 17th.
De-risking vs. credit stress
Our Weekly Index Highlights edition published following the initial wave of the sell-off noted a “broad de-risking, with the heaviest pressure in higher-beta names.” With the market slide entering a third week, the risk retreat seems backed by momentum, as a revival of tariff-related jitters is compounded by the emergence of at least four instances of credit-market related distress.
CME BTC vol. on the rise
With our prior weekly report landing at the start of the week, during a short-lived pause in pronounced selling, it’s section on Volatility Analysis spotlighted a divergence between realized vol., and our CF Bitcoin Volatility Index Settlement Rate (BVX), the only true measure of the CME Bitcoin options implied volatility. BVX rose 3.10 points, while realized eased 0.15 pts.
By the end of that week, realized vol. had ticked even lower, while BVX ended the week +8.68% at 51.98, maintaining the dynamic of hedging premia being “rebuilt faster than delivered vol."
In turn, that tentatively suggested a combination of selling pressure and pricing in of further downside risk.
Meanwhile, as shown by a visualization of CME Bitcoin’s 30-day constant maturity skew, the 10-delta to 25-delta skew is currently indicated -15% to -10%.
This clearly confirms that the bias remains bearish, as put demand prevails (i.e. shows higher premia than for calls), with the skew steepening in recent days to the downside.
The visualization, as seen in the screenshot below, is available on our BVX web page.
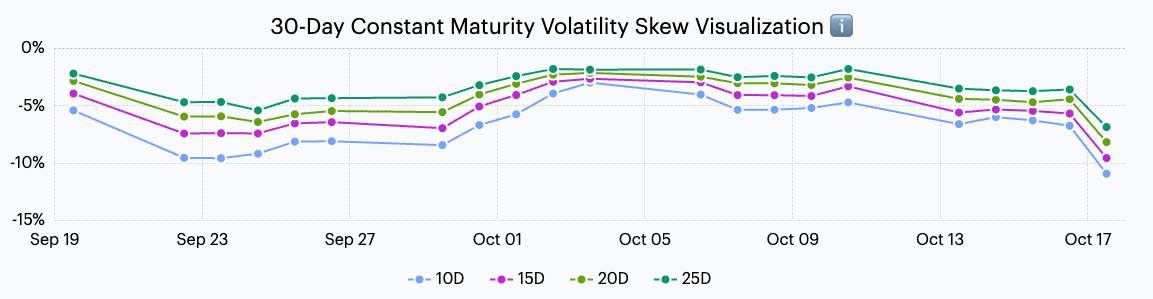
Re-steepening reflects increasingly defensive implied vol. pricing, consistent with an anticipated risk of increased market upsets, which, of course, can be precipitated by economic, political or geopolitical events.
That said, this isn’t quite a panicked set-up, yet; as the trend in this 30-day window looks quite literally orderly, for now.
On the charts
The scope of chart technicals that we can do justice to in the CF Benchmarks Newsletter is rudimentary.
Still, with large swathes of participants keeping at least a cursory eye on them, their influence is often nowhere near trivial. For instance, Bitcoin's 200-day simple moving average (200-DMA) is touched on by Bloomberg, here.
Sure enough, taking CME Bitcoin Micro futures (MBT) as proxy, note the continuation chart of its front-month contracts below depicts typical enduring price support above the 200-DMA.
Even if at times price breaks below, the typical historical trend for risky assets, including BTC, is generally towards relatively swift recovery back above the trend.
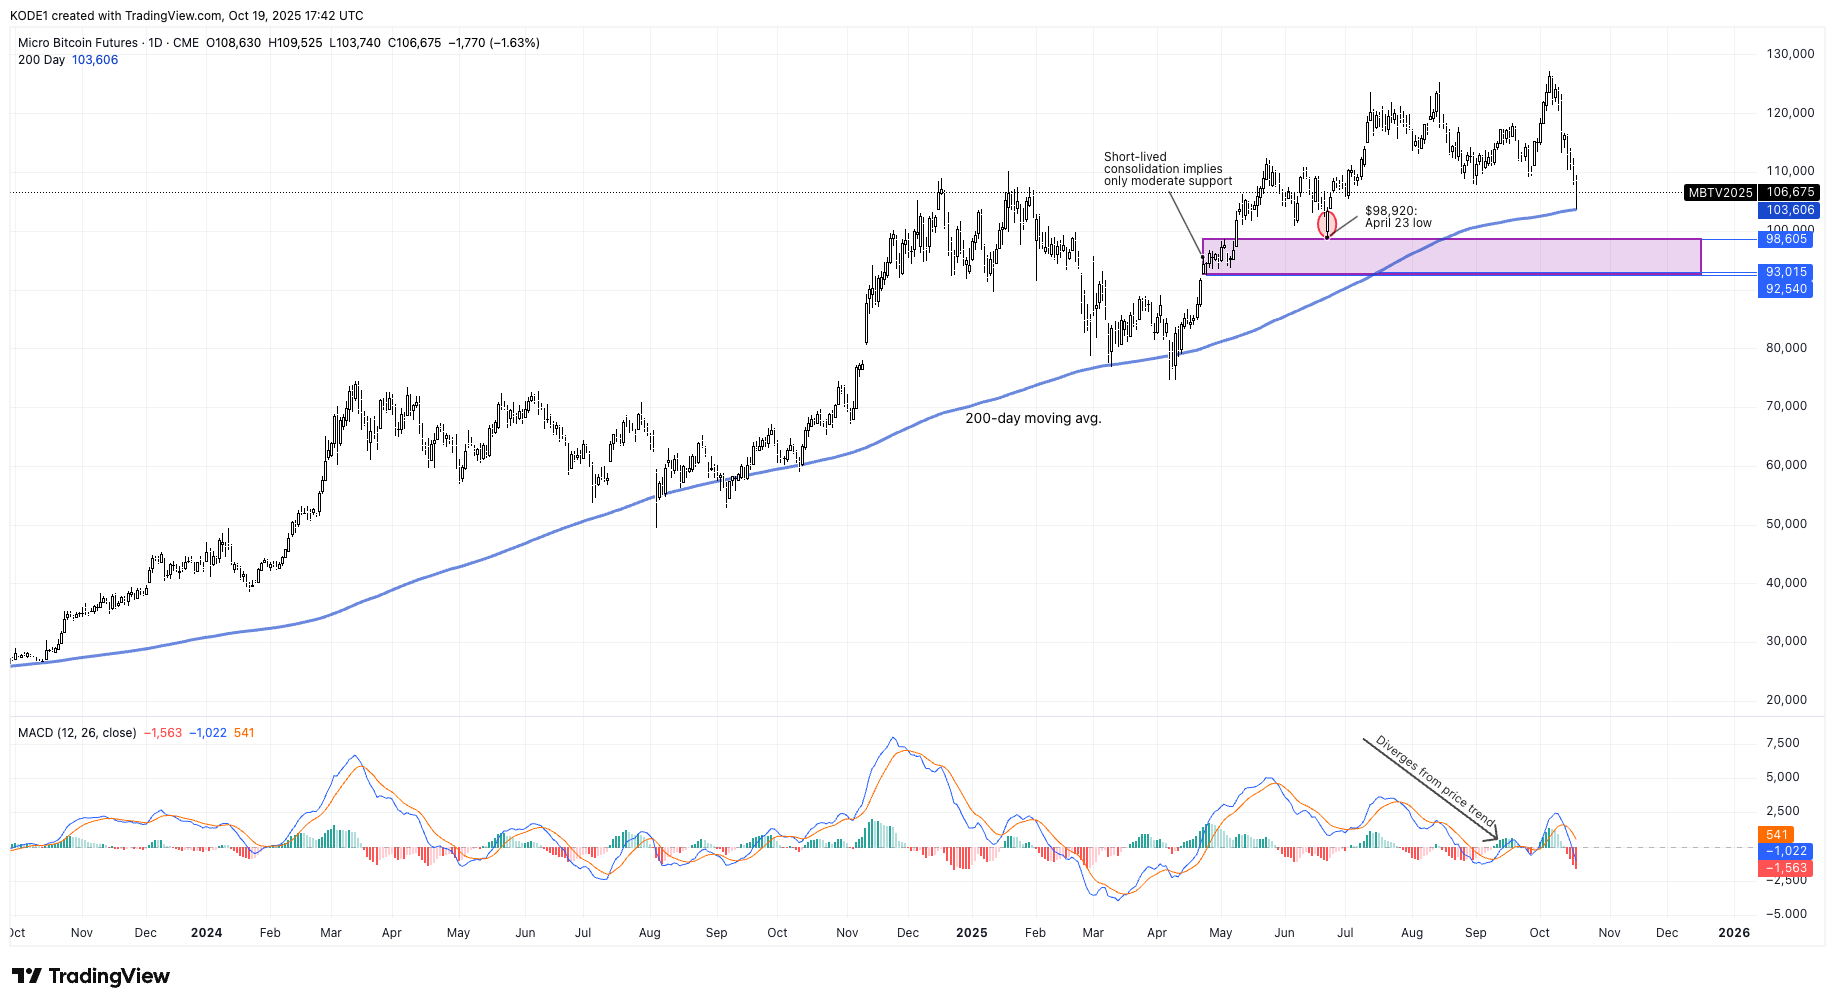
Conversely, the Moving Average Convergence Divergence (MACD) module (bottom) another trending indicator, though a much finer one, diverged from Bitcoin's price direction, roughly during June-August. It's an occurrence typically interpreted as presaging 'exhaustion'.
Meanwhile, although periods of consolidation, like the one in late-April to early-May, are often looked to for subsequent price support, that tendency can be weak if consolidation is relatively short (lower attention, fewer stops, etc.)
All the more reason why confirmed support around ~$98k on April 23 will be closely watched.
BTC-M2 correlation
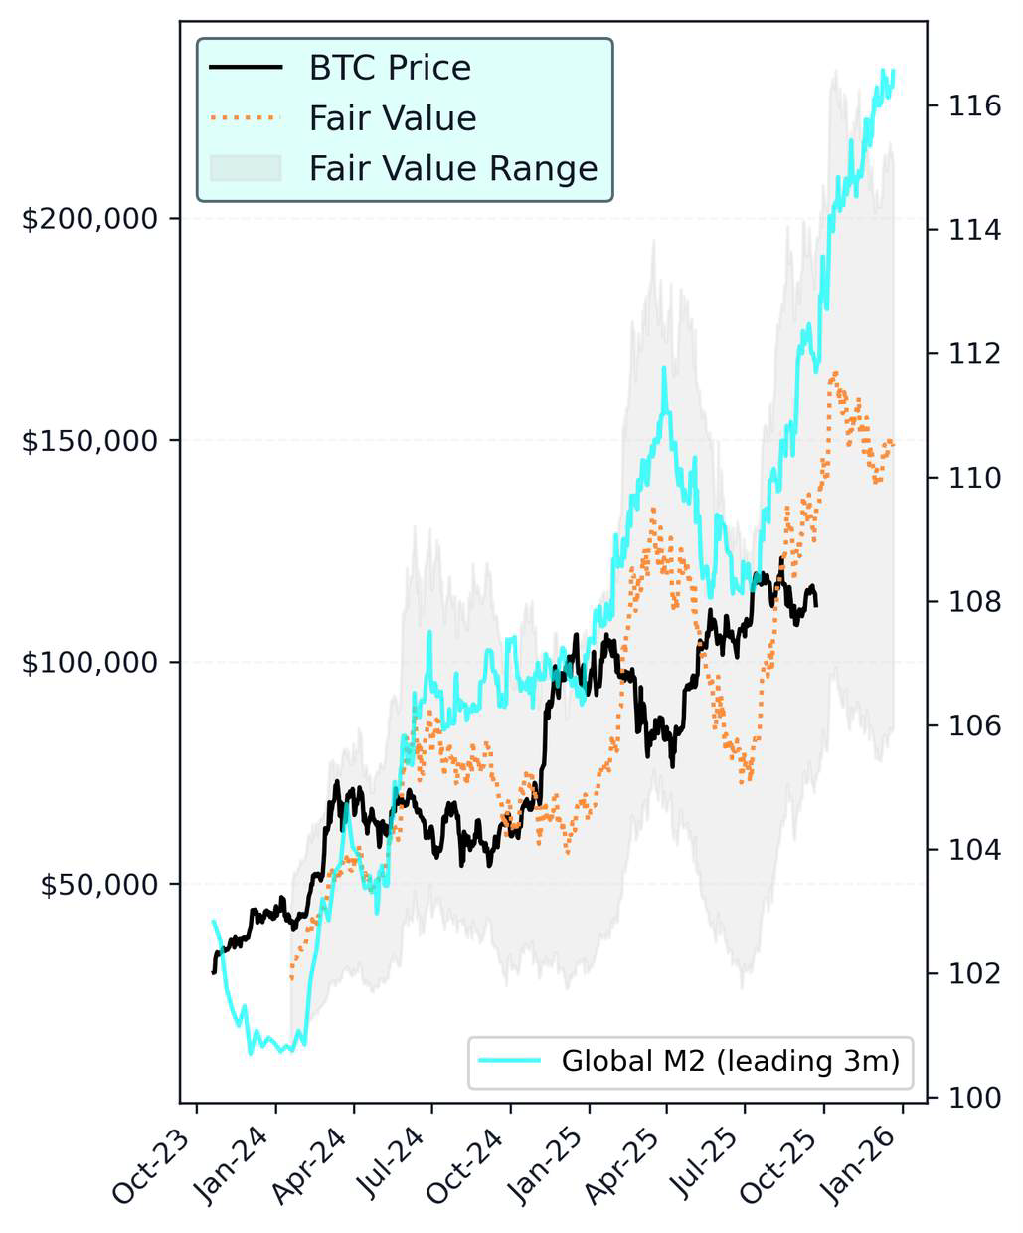
As outlined at the top, for a longer-term perspective we can look to the Bitcoin price projection presented by CF Benchmarks' Gabe Selby, CFA and Mark Pilipczuk, in their Q4 2025 Outlook section titled ‘M2 Expansion to Lead BTC Higher’.
Find more details in the report itself, or the summary below, but as the title suggests, the model is based on the correlation between Bitcoin and the measure of U.S. dollar domestic broad money supply.
With a 95% confidence interval, Selby and Pilipczuk estimate a fair value of $148.5k by quarter end, with a range between $85k - $212k.
Regardless of any potential further severe volatility or not, the range will be a compelling one to observe throughout the remainder of the year.
- Subscribe to CF Benchmarks Research & Insights to receive alerts when new content is published, including for Weekly Index Highlights, reports by our research team, and more.
- To explore exclusive CME Bitcoin volatility tools, like the volatility surface and 30-day skew, head to the CF Bitcoin Volatility Index Settlement Rate (BVX) page.
A Bitcoin Fair Value for Q4 2025
Bitcoin looks underpinned on a longer-term horizon, according to CF Benchmarks' research team.
Below, we summarize and excerpt key parts from the Market Outlook 2025 report by CF Benchmarks' Head of Research, Gabe Selby, CFA, and Research Analyst Mark Pilipczuk.

With the commencement of the final few months of the year, CF Benchmarks’ Research team have published their customary, comprehensive set of market, macro and thematic forecasts.
As usual, ahead of each quarter, Head of Research Gabe Selby, CFA, and Research Analyst Mark Pilipczuk, survey salient developments across digital and traditional asset markets and economies, from their vantage point as institutional practitioners, through the qualified lens of CF Benchmarks’ breadth of regulated single-asset and portfolio indices, plus our proprietary taxonomy of the investible digital asset universe – the CF Digital Asset Classification Structure (CF DACS).
Selby and Pilipczuk’s latest Market Outlook Q4 2025 – ‘Rate Cuts & Regulatory Clarity: From Red Tape to Greenlights’ – follows the top-level framework established since the inception of this series, to land on their distinct expectations for the quarter: a Market Recap, a Macro Backdrop, Secular Themes and an Asset Class Overview & Forecasts.
A Bitcoin proprietary fair value
With much market attention on the aftermath of the recent drawdown, it's cogent to spotlight their timely commentary on Bitcoin’s 3-month price trajectory, as a sample from one pillar of that framework, ‘Secular Themes’.
Within that section, Selby and Pilipczuk unveil a “proprietary fair value (FV) framework for Bitcoin.” It’s based on a regression of BTC (proxy: CME CF Bitcoin Reference Rate) against CF Benchmarks’ internal Global M2 money supply index, “where changes in M2 lead Bitcoin by approximately three months.”
A strong correlation of 0.8 emerged from a ten-year back test, leading the analysts to conclude that a divergence between M2 growth and Bitcoin in recent months looks “temporary” given that “Bitcoin’s price tends to adjust with a lag to shifts in monetary condition.”
With a 95% confidence interval, Selby and Pilipczuk estimate a fair value of $148.5k by quarter end, ranging between $85k - $212k, as illustrated in the excerpted chart below.
The analysts round off their commentary on the Bitcoin/M2 correlation with a 'Portfolio Perspective' synopsis that's the key takeaway for investment considerations.
"The continued fiat debasement is likely to act as a tailwind for Bitcoin in the fourth quarter. With Bitcoin currently trading at the lower bound of its fair value range, we believe this presents a compelling tactical entry point. The current setup of persistent M2 growth, elevated inflation concerns, and sideways consolidation mirrors conditions that have historically preceded meaningful re-rating phases. For investors seeking a hedge against currency debasement, the risk-reward profile appears favorable. However, the lower target of $85,100 remains within our 95% confidence interval, meaning further downside is possible before a move toward the model's $148,500 fair value estimate."
Read an executive summary for 'Rate Cuts & Regulatory Clarity: From Red Tape to Greenlights' here.
The information contained within is for educational and informational purposes ONLY. It is not intended nor should it be considered an invitation or inducement to buy or sell any of the underlying instruments cited including but not limited to cryptoassets, financial instruments or any instruments that reference any index provided by CF Benchmarks Ltd. This communication is not intended to persuade or incite you to buy or sell security or securities noted within. Any commentary provided is the opinion of the author and should not be considered a personalised recommendation. Please contact your financial adviser or professional before making an investment decision.
Note: Some of the underlying instruments cited within this material may be restricted to certain customer categories in certain jurisdictions.
Changes to the Token Market Price Benchmarks Series - Market Prices – 21 July 2026
The Administrator has confirmed changes to the Token Market Price Family for the period 14 July 2026 to 21 July 2026.

CF Benchmarks
Softer CPI Reprices July Hike Risk & Lifts Digital Assets
Digital assets extended their recovery over the past week as cooler US inflation prints repriced Fed expectations; the bid was broad across the large cap indices, growth factor leadership returned, stablecoin funding repriced lower, and stress stayed isolated in names hit by token-specific news.
Mark Pilipczuk
Notice of the Demising of CF Dai-Dollar Settlement Price and Spot Rate
The Administrator announces that it will demise the CF Dai-Dollar Settlement Price (DAIUSD_RR) and CF Dai-Dollar Spot Rate (DAIUSD_RTI) which are members of the CF Digital Asset Index Family.
CF Benchmarks
By clicking Accept, you consent to CF Benchmarks's use of cookies.
Visit Cookie Settings to learn how CF Benchmarks uses cookies and to adjust your preferences.