
Sep 07, 2024
CF Benchmarks Newsletter - Issue 70
- Nasdaq files to list options on our CME CF BRRNY index
- CME preps retail-friendly Bitcoin 'BFFs'
- QR Asset quietly launches Solana ETF wave
Normative
The CF Benchmarks research team’s regular Monthly Market Recap shows August's performance could well form the basis of the dominant trend for September, which is statistically among the weakest months for risky assets.
Scroll down to the 'Markets' section for an excerpt, or choose one of the reading options below.

Click here for the rich-media experience.
Jitters return
After the tail end of the summer saw previously indistinct and opaque Fed rate policy suddenly crystallise to an explicitly dovish stance, emerging jitters were salved for a spell, only to return, somewhat predictably, in recent weeks.
That left the fate of the near-term macro and market outlook hanging inordinately on monthly payrolls data, billed widely (though not uniquely) as "the most important jobs report we've had in years", ahead of their release on Friday September 6th.
In the event, the data confirmed the picture of a cooling U.S. labor market, with headline payrolls missing forecasts. But a dip in Treasury yields and the dollar underlined that rate cut expectations were intact.
Still, the lack of an alarming deterioration vs. expectations – hourly earnings ticked higher, and unemployment was in-line at 4.2% – meant the mildly positive immediate price reaction soon evaporated, as hopes of a larger change in policy than previously pencilled in faded.
Hours after the data, Fed funds futures projected a probability of just 30% that the U.S. central bank would cut by 50 basis points (bp) at the next FOMC meeting, instead of a more widely expected 25bp.
Bitcoin’s most established institutional benchmark, CME CF BRR, spent much of the session mildly higher on the day, having lost around 9% in August, and was trading 28% below the all-time highs near $74,365, notched in March.
Dwindling
After all, aside from macro discussions intertwined with equally intractable debates over traditional asset valuations, persistent related concerns have continued to apply additional pressure, likely contributing to dwindling large cap crypto prices since the spring: Mt. Gox distributions; the post-2022 liquidity abasement; 'regulation by enforcement' (see the Uniswap settlement and OpenSea's Wells Notice, etc.).
Meanwhile of course, cross asset participants are also contending with nerves stemming from broader concerns. Chiefly an all but confirmed recession in China, an emerging one in the Eurozone, U.S. pre-election uncertainties, and global geopolitical horrors.
Situation normal
From our perspective as the leading cryptocurrency Benchmark Administrator though, this is what ‘situation normal’ looks like, heading into the final quarter.
Most importantly, following the transitional events for crypto of the year so far, institutionalisation has continued to cogently evolve, with a view to further fill out the infrastructure one would expect to see for any emerging asset or financial product class.
Nasdaq eyes BTC options
With tens, and sometimes hundreds of millions of dollars worth of Bitcoin now traded by the financial establishment daily, we've latterly assumed it was only a matter of time before the pursuit of an increased set of facilities to enable institutions to further optimise risk management and trading efficiencies would emerge.
We previously spotlighted BlackRock's filing, in partnership with Nasdaq, to list options on the iShares Ethereum Trust ETF (ETHA).
At the time, we noted it was likely to be the first of many applications intended to widen the availability of regulated exchange traded Bitcoin option exposure. (ETHA's net asset value [NAV] is struck against our CME CF ETHUSD_NY.)
An additional filing by BlackRock and Nasdaq 0subsequently emerged. This one proposes to list options on what is now the largest Bitcoin ETF, iShares Bitcoin Trust ETF (IBIT); which deploys the CME CF Bitcoin Reference Rate - New York Variant (BRRNY) for NAV calculation.
Furthermore, Nasdaq has now lodged a separate application to launch index options that will settle to the same benchmark.
BRRNY is the 4 PM, New York Time variant of the most liquid, regulated Bitcoin price, the CME CF Bitcoin Reference Rate (BRR), which references our Bitcoin price at 4 PM London Time.
Among other benefits, Nasdaq's BRRNY-settled contracts could serve as an alternative to the only CFTC-regulated BTC options suitable for major institutions: those offered by the CME Group.
Additionally, as CF Benchmarks CEO Sui Chung noted in a DL News article:
“ETFs plus spot options will give individual investors the ability to do the same sorts of things as more sophisticated investors and institutions do today with ETFs futures and options on the CME."
Long-term readers will recall we're seldom inclined to second-guess the SEC; or indeed any particular regulator. Even so, the hurdle to potential regulatory approval for both options on existing Bitcoin ETFs and additional Bitcoin index options, would appear to be more 'straightforward' than was witnessed for Bitcoin and Ether ETFs. Especially given that the latter are now trading on the same exchanges where these related options would be transacted.

CME preps weekly BTC futures
Reflecting a gap similar to the one identified by Nasdaq, CME Group has unveiled plans to increase access to its regulated Bitcoin contract marketplace for individual participants.
Bitcoin Friday futures (BFF), which are weekly expiring contracts with a correspondingly cut-down contract size, are slated to begin trading from September 30th.
Each contract will be sized at 1/50th of a Bitcoin, as opposed to the 5-Bitcoin contract unit of the firm's regular Bitcoin futures, which launched almost seven years ago. BFF will thereby require a fraction of the upfront financial commitment that's needed to take a position in the CME's full-sized BTC futures.
The CME notes BFF will "offer a precise and flexible way to trade bitcoin exposure", and "may better track Bitcoin's spot price", partly due to BFF's shorter duration than CME's monthly BTC contracts.
Meanwhile, Friday futures also represent a further widening of the CME's exclusive digital asset index partnership with CF Benchmarks.
What's more, Friday futures are set to converge with the CME CF Bitcoin Liquidity Complex, given that they'll settle to our regulated Bitcoin index methodology.
That said, BFF will be distinct from existing CME BTC contracts as they'll be the first to feature a New York 'cut'; i.e., the price of Bitcoin at 4 PM New York Time, BRRNY, instead of BRR, the price at 4 PM London Time.
Still, BFF will extend CME's suite of more compact crypto products that began appearing in 2021, including Micro Bitcoin and Micro Ether futures and options, and even arguably Event Contracts on Bitcoin Futures (ECBTC), which are sized at just $100 per contract.
Overall, this latest expansion of the CME's BTC product suite points to the group's continuing efforts to meet retail crypto demand, particularly as earlier instruments in the range continue to edge increasingly out of reach as the underlying appreciates.

QR launches Solana ETF wave
QR Asset was one of the earliest firms to list a spot crypto exchange traded fund - and in one of the first regulatory jurisdictions to approve them. That also placed the Sao Paolo based firm among CF Benchmarks' first investment management clients, with its BRR-powered Bitcoin fund and ETHUSD_RR-powered ETF trading since 2021.
Now, QR has quietly become the first firm to list an ETF investing in spot Solana, QR Solana ETF (QSOL 11), following B3's approval in late August.
The fund is also the first to deploy our regulated CME CF Solana-Dollar Reference Rate (SOLUSD_RR) for NAV calculation.
QSOL11's first day of trading was a relatively modest one, with around $3m in assets gathered, but it does represent more than the symbolic commencement of stock market trading for funds investing in the third largest digital asset by market capitalisation.
Hashdex, another longstanding CFB client with a major presence in the same region as QR, was waiting in the wings with it's own SOLUSD_RR-powered ETF application, even before QSOL11 received final approval.
Meanwhile, both Brazilian firms look set to pip a filing to list the first North American Solana ETF to the post, with Canada's 3iQ awaiting OSC approval for The Solana Fund (QSOL)
Interestingly, 3iQ's offer is the only one among the three mentioned here to publicly express a commitment to offer exposure to both Solana's price returns and staking yields. Even so, whilst The Solana Fund will also utilise SOLUSD_RR for NAV calculation, details of how staking rewards will be calculated are still awaited.
Markets
The following is an excerpt of the Monthly Market Recap for August 2024, produced by the CF Benchmarks Research team, Gabriel Selby, CFA, and Mark Pilipczuk.

Macro Influences Rekindle Market Uncertainty
- Volatility returned for digital assets in August, driven by the unwinding of the "Yen Carry Trade," which negatively impacted risk appetite across the broader array of markets. Among other major macroeconomic factors, the Federal Reserve announced a dovish pivot at their annual Jackson Hole Symposium, which helped pare some of the earlier losses. Ether, while initially lagging, continued to see inflows into the newly launched U.S. spot ETFs, signaling long-term institutional interest despite a lower debut of inflows. Bitcoin prices also responded to these potential rate-cut signals, with Bitcoin benefiting from its perceived inverse relationship with interest rates.
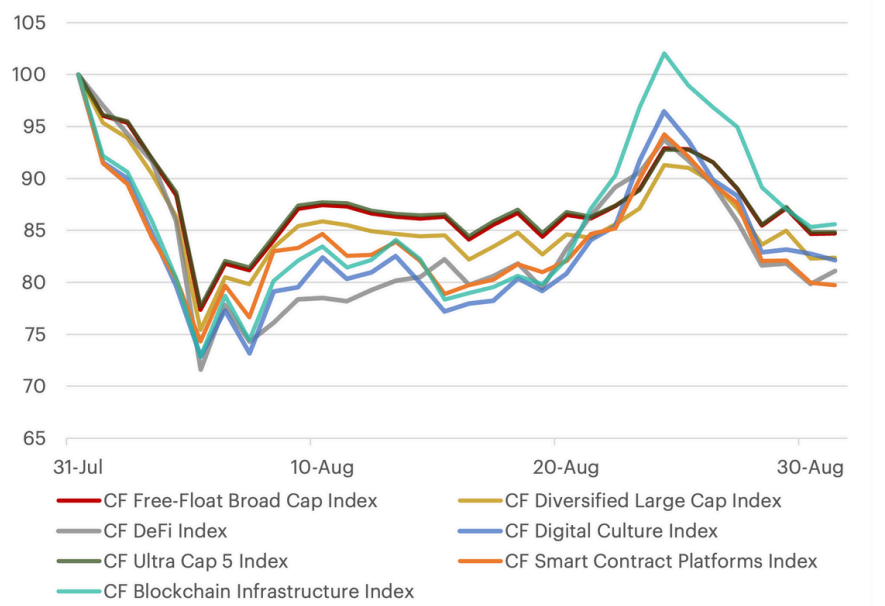
- Our cryptocurrency indices displayed broadly negative performance, with the CF Free-Float Broad Cap Index falling over 15%. This decline was led by the CF Smart Contract Platforms Index and CF DeFi Index, falling over 18% and 20% respectively. Conversely, the CF Blockchain Infrastructure Index emerged as the relative leader by posting a sub-15% decline.
Multi Token Index Performance - July 31st to August 31st, 2024
The information contained within is for educational and informational purposes ONLY. It is not intended nor should it be considered an invitation or inducement to buy or sell any of the underlying instruments cited including but not limited to cryptoassets, financial instruments or any instruments that reference any index provided by CF Benchmarks Ltd. This communication is not intended to persuade or incite you to buy or sell security or securities noted within. Any commentary provided is the opinion of the author and should not be considered a personalised recommendation. Please contact your financial adviser or professional before making an investment decision.
Note: Some of the underlying instruments cited within this material may be restricted to certain customer categories in certain jurisdictions.
Changes to the Token Market Price Benchmarks Series - Market Prices – 21 July 2026
The Administrator has confirmed changes to the Token Market Price Family for the period 14 July 2026 to 21 July 2026.

CF Benchmarks
Softer CPI Reprices July Hike Risk & Lifts Digital Assets
Digital assets extended their recovery over the past week as cooler US inflation prints repriced Fed expectations; the bid was broad across the large cap indices, growth factor leadership returned, stablecoin funding repriced lower, and stress stayed isolated in names hit by token-specific news.
Mark Pilipczuk
Notice of the Demising of CF Dai-Dollar Settlement Price and Spot Rate
The Administrator announces that it will demise the CF Dai-Dollar Settlement Price (DAIUSD_RR) and CF Dai-Dollar Spot Rate (DAIUSD_RTI) which are members of the CF Digital Asset Index Family.
CF Benchmarks
By clicking Accept, you consent to CF Benchmarks's use of cookies.
Visit Cookie Settings to learn how CF Benchmarks uses cookies and to adjust your preferences.