
Sep 09, 2022
Meet CF Benchmarks' Market Recap and Quarterly Attribution Analyses
We're excited to introduce a new quarterly series of in-depth, market-driven quantitative research reports by CF Benchmarks' Lead Research Analyst Gabe Selby, CFA.
Each quarter, shortly after CF Benchmarks' scheduled portfolio index Rebalances, Gabe will publish his insights on the most salient fundamental, macroeconomic, and market-technical trends (including any compelling on-chain factors) driving digital asset market returns.
These reports represent the first published research utilising CF Digital Asset Classification Structure (CF DACS) in a formal institutional format, thereby illuminating how CF DACS is the much-needed 'missing link' for attribution analysis and portfolio optimisation in the institutional digital asset management space.
The Quarterly Attribution Analyses will be published as separate individual reports for each CF Benchmarks portfolio index, and also as a compilation report containing all six quarterly analyses.
Read the first compiled report, CF Benchmarks' June - August 2022 Market Recap below.
Macro Forces Remain in Control For Now
The challenging macroeconomic environment continued for digital assets: inflation remained at multi-decade highs, central banks have made sizeable policy rate increases, and global growth has begun to stall. Markets continue to be sensitive to increases in central bank policy rates, which has led to a tightening of financial conditions in an effort to stymie inflation in most developed market economies. Although this dynamic has been visible across most risky assets, such as equities, the naturally higher volatility in the digital asset space has amplified downside price action.
It is worth noting that macro forces were not the only driving force this past quarter. Idiosyncratic catalysts stemming from the upcoming Ethereum Proof-of-Stake (PoS) upgrade, or “merge”, helped reverse negative price momentum in July. At one point, ETH prices rose as much as 90% from the late June lows, leading the world’s second largest token (by market capitalization) to be one of the top relative performers in the Large-Cap space. Merge bullishness also spilled over into the the Blockchain Infrastructure Index, with scaling solutions posting strong relative and absolute performance. Lastly, deposits in the DeFi ecosystem have begun to stabilize after regulatory uncertainty soured protocol demand in June.
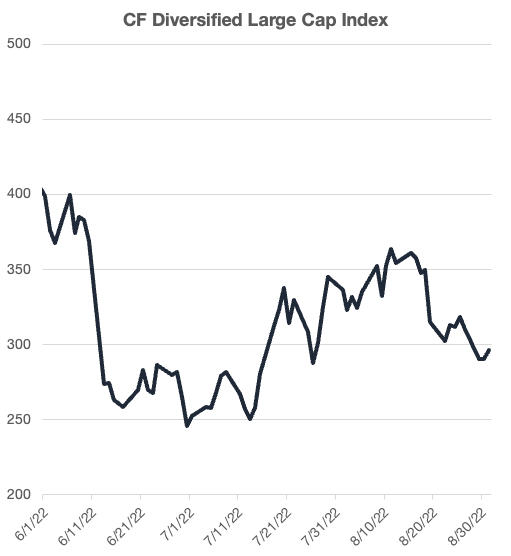
The CF Diversified Large Cap Index
The CF Diversified Large Cap Index - is a liquid, investible benchmark portfolio index designed to track the performance of large-cap digital assets. The index seeks to capture 95% of the total market capitalization of the investible digital asset universe as its constituents. Index constituents are weighted using the diversified market capitalization which is determined by the free-float market capitalization adjusted by the application of the harmonic series' terms. This has the benefit of discounting the higher capitalization assets within the portfolio in accordance with the CF Multi Asset Series Ground Rules and the CF Diversified Large Cap Index Methodology. The index is calculated and published every second. The index is re-constituted on a twice yearly basis and rebalanced quarterly. The CF Diversified Large Cap Index - was incepted on December 1st 2021 with a value of 1,000. The index was launched on February 14th, all values from inception date to launch date provided are backtested.
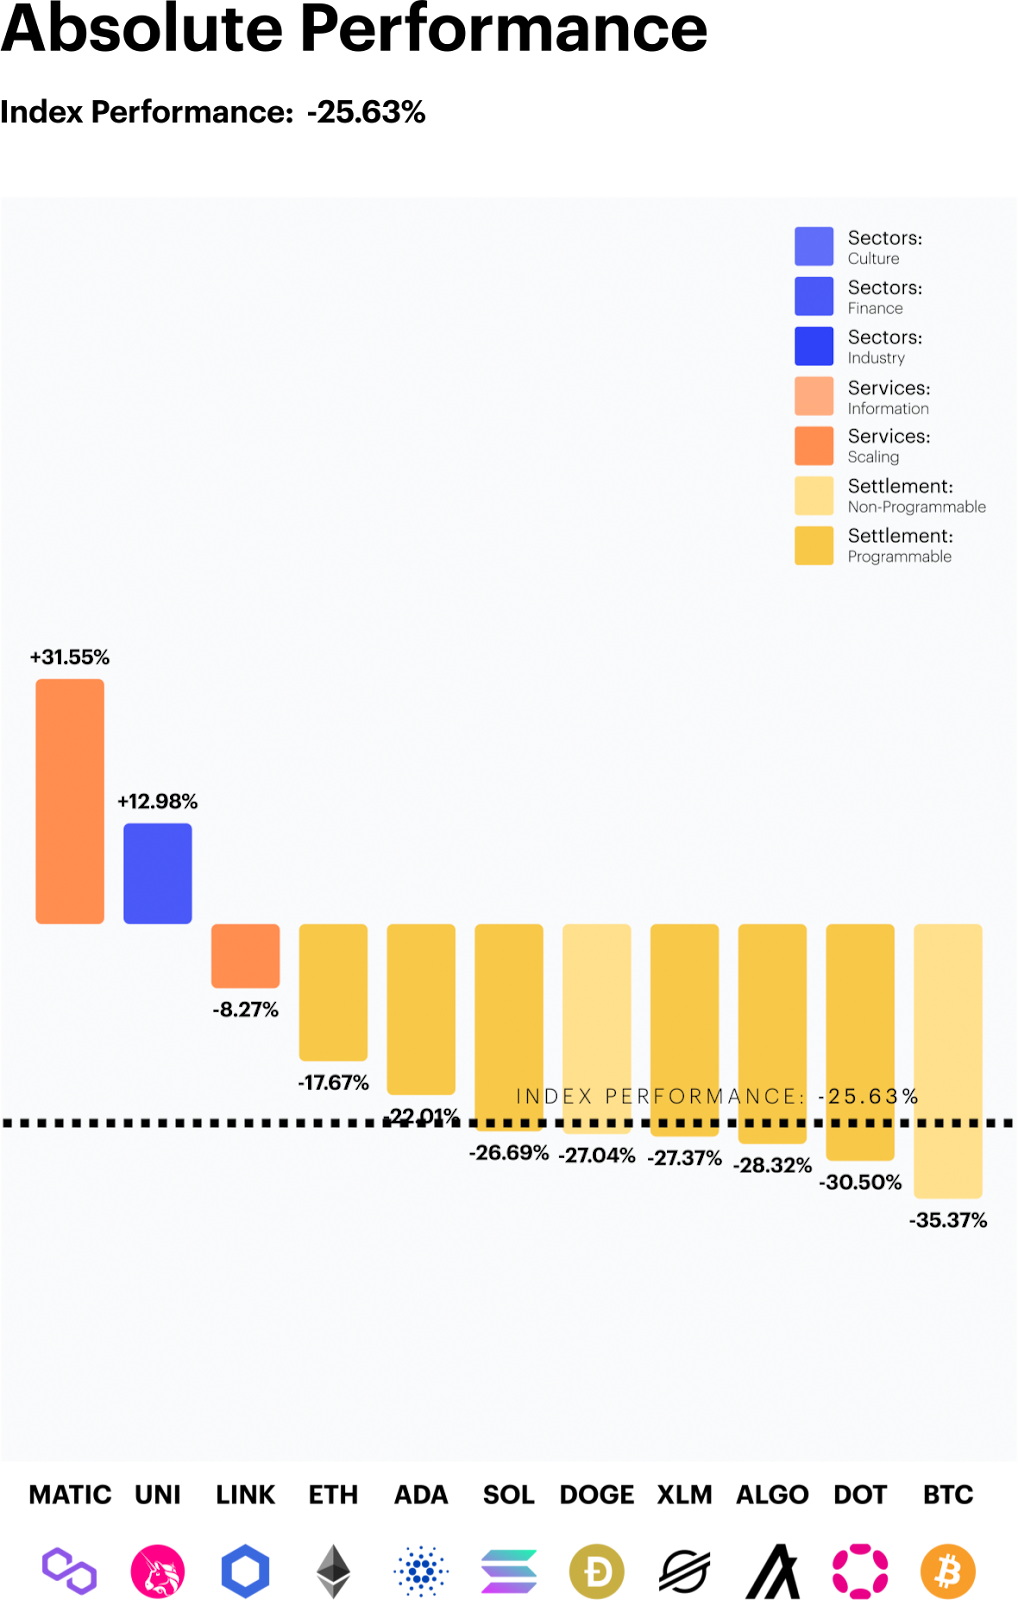
Scaling and DeFi Play Defense
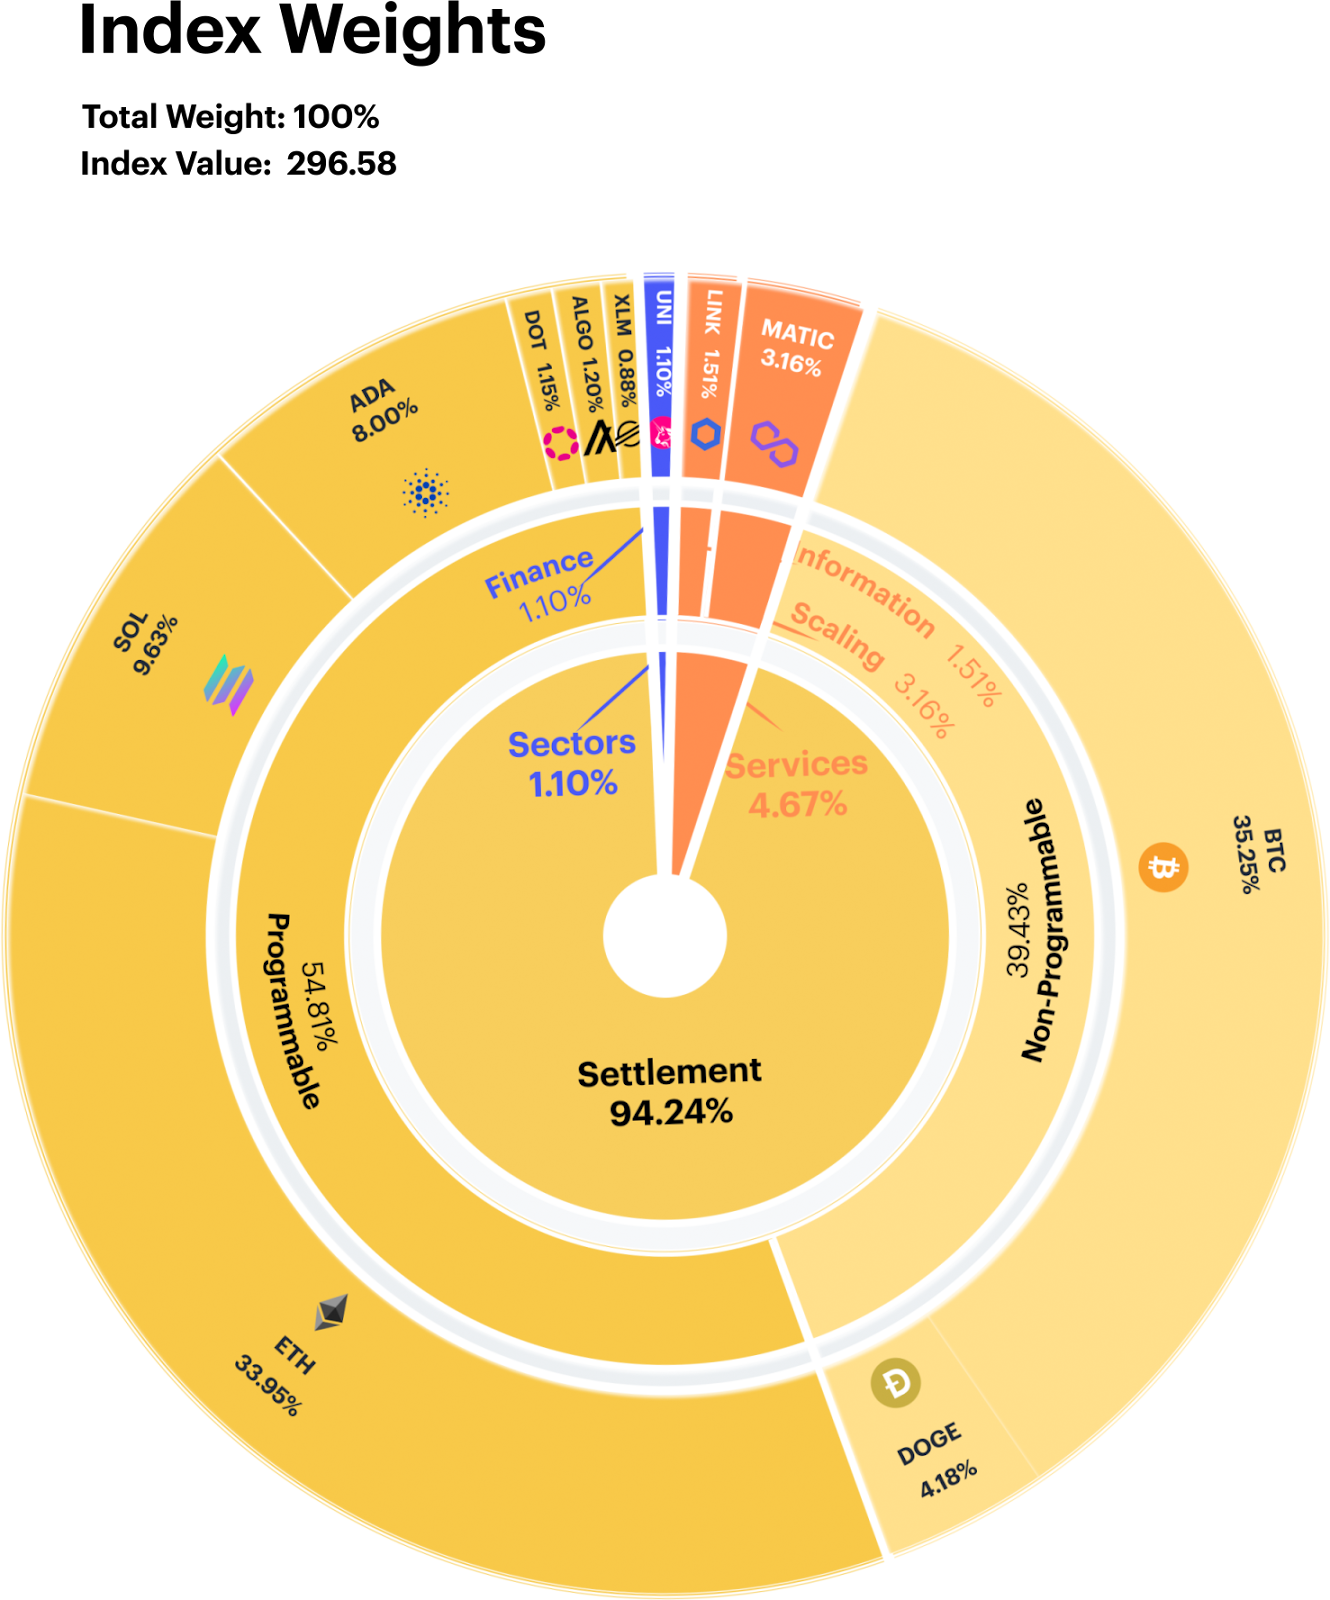
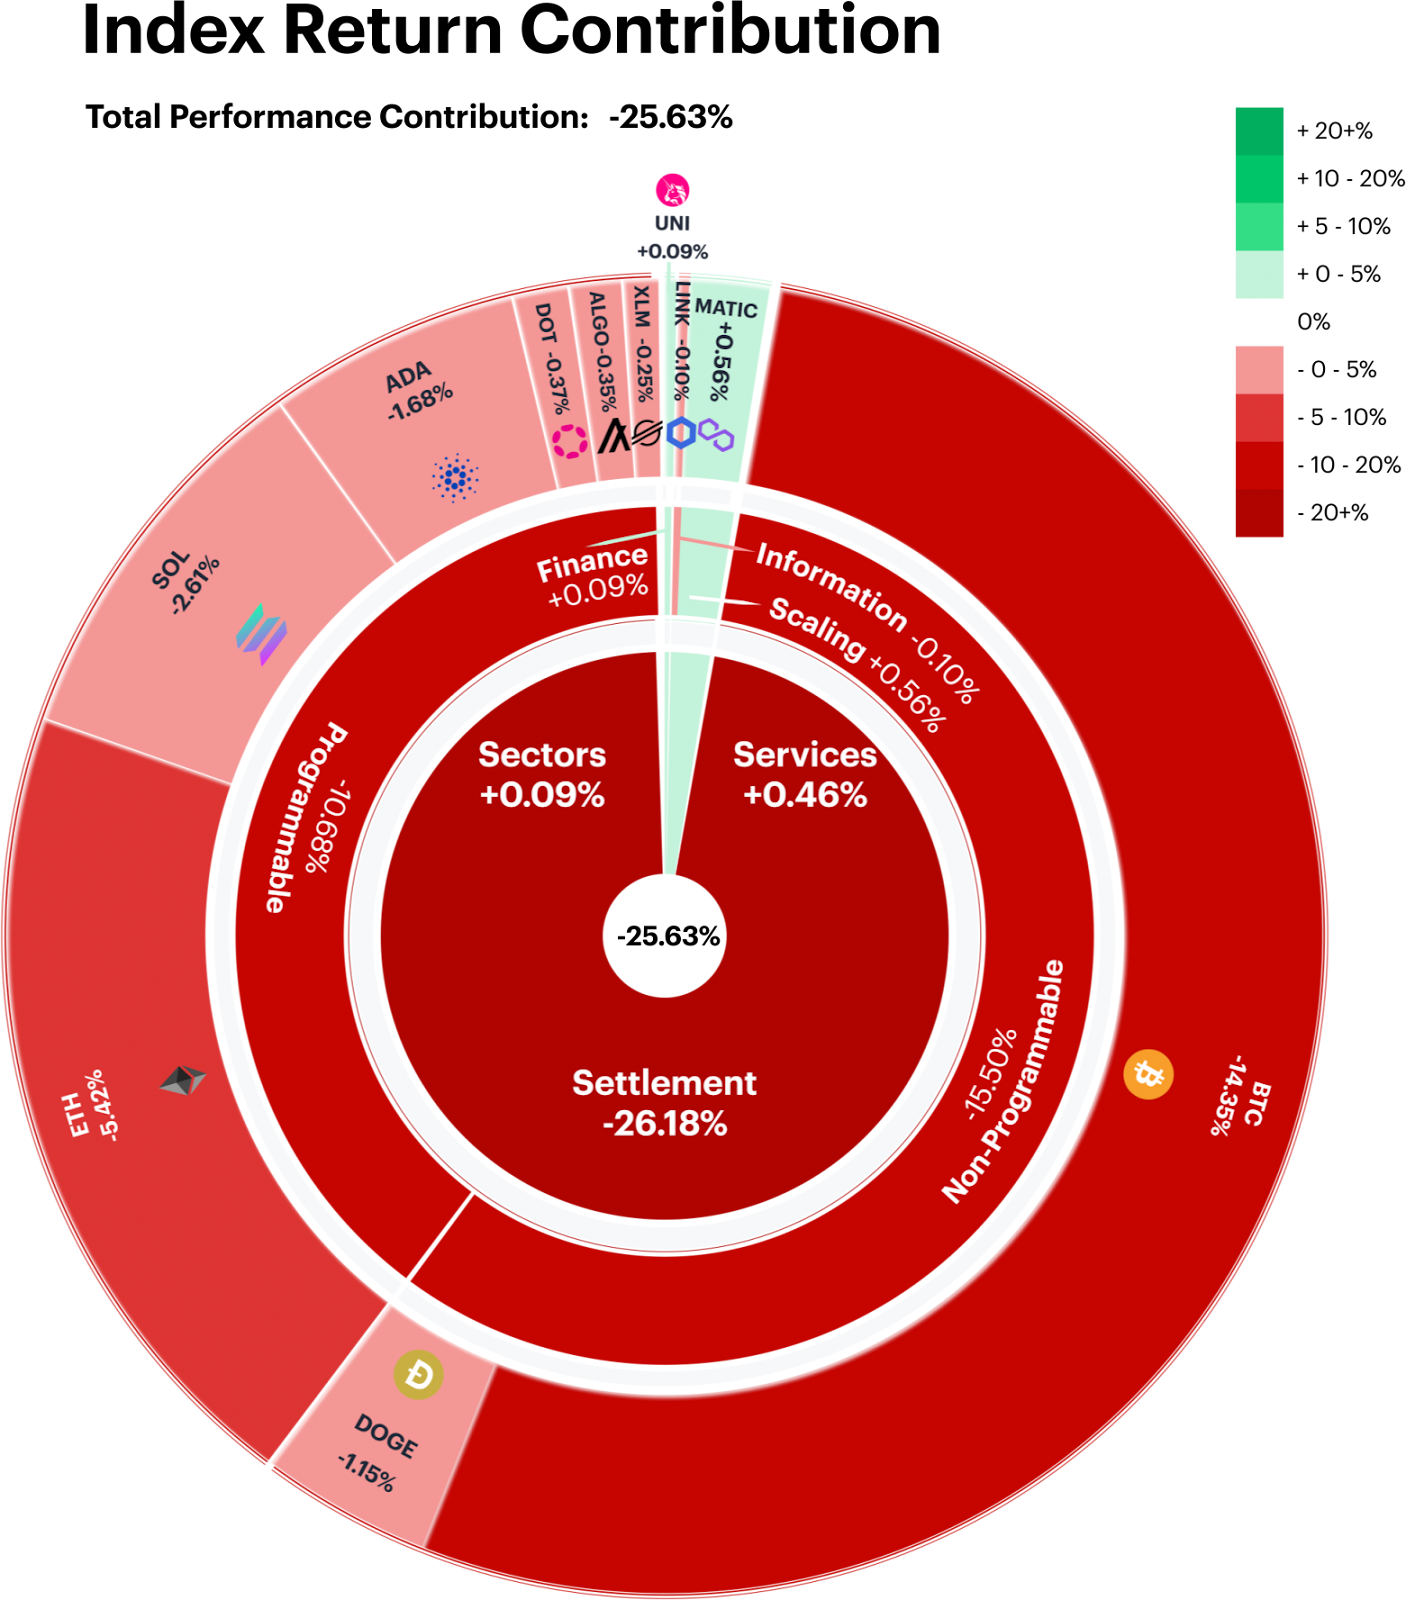
Large-cap tokens remained under pressure, falling over 25%. From a Level 1 Digital Asset Classification Structure (DACS) perspective, the heavily weighted Settlement segment contributed most (-26.2%) to the index’s decline, with Bitcoin, a non-programmable token, contributing the lion’s share of negative performance.
Conversely, the Services and Sectors segments, saw relative outperformance, each contributing slightly positive performance over the rebalance period.
Merge Hysteria lifts UNI and MATIC
The world’s most used programmable blockchain is set for a major upgrade this month which propelled ETH prices up over the $2,000 level before finally giving up some the gains over the last few weeks. The positive ETH sentiment spilled over segments like DeFi and Scaling. MATIC and UNI both finished the rebalance period up +31.5% and +13.0%, respectively. Investors see the potential merge as a fundamental catalyst for DeFi tokens and Layer 2 scaling solutions to attract more institutional development once the Ethereum blockchain performs its upgrade.
The decision to switch from Proof-of-Work (PoW) to Proof-of-Stake (PoS) is anticipated to increase ETH’s bull thesis. First off, miners will be replaced by validators who are required to stake at least 32 ETH which will offer potential yield for participating in the network. Secondly, developers are planning on decreasing annual ETH issuance by ~90%, adding a disinflationary element. Lastly, the upgrade is set to exponentially improve bandwidth and speed, while only using a fraction of the energy.
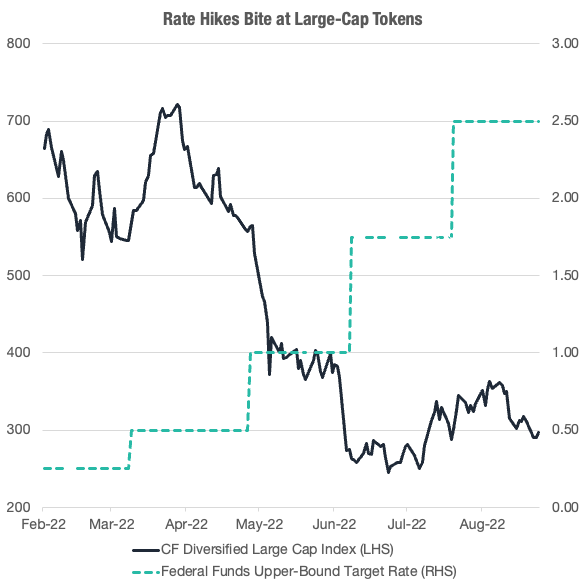
Crypto Fights the Fed
Central banks across the globe have embarked on an aggressive crusade in fighting historically high inflation. The Fed has even decided to super-size their rate increases by upping their policy rate by 150 bps over the last two meetings. Currently, markets are still anticipating a greater than 50% chance that the Federal Reserve and European Central Bank will both tack on another 75 bps in their upcoming September Meetings.
Meanwhile, rate speculators anticipated that the terminal funds rate should be around 350 bps for the U.S., which would imply that another supersized rate hike will set the central bank close to neutral. The chart below illustrates how the May and June rate increases coincidentally had a sizeable impact on Large Cap tokens, but it appears that this relationship has softened in July with markets coming to terms with a lingering hawkish monetary regime. Meanwhile, investors seem to be looking around the corner to an eventual pivot in hawkish policy stances, which would rekindle bullish sentiment.
What’s Driving Crypto? Rolling 30-Day Large Cap Correlations
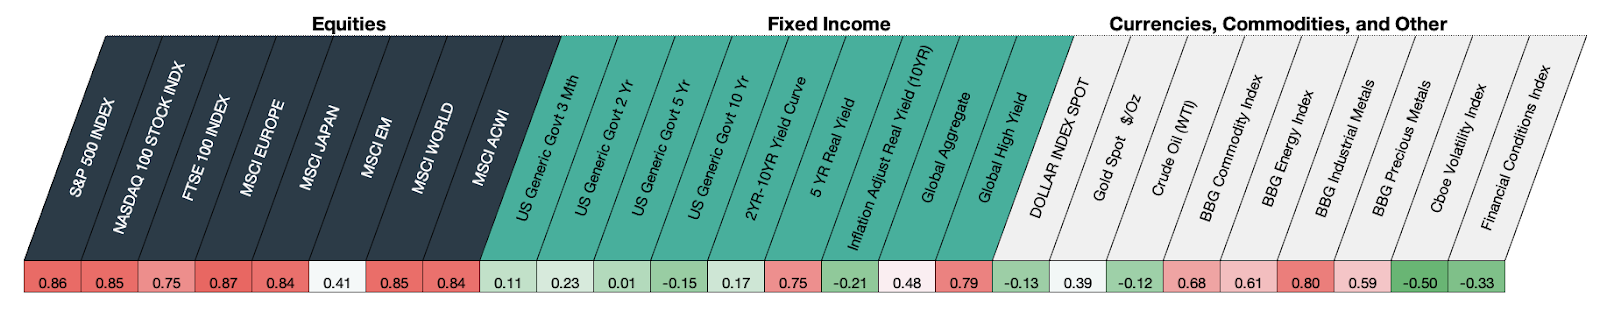
Overall, the CF Diversified Large Cap Index continues to trade with a strong correlation to equities prices. Emerging market equities (EM) displayed a relatively lower correlation despite the duo’s shared sensitivity to rising interest rates and a strong USD. In fixed income, we can see how speculative high yield moves directionally similar during periods of poor sentiment. Lastly, the strongest inverse relationships to large-cap tokens can be found in the volatility index (VIX) and financial conditions index.
Download the complete report here.
Find out more about CF Digital Asset Classification Structure here.
Additional Resources
For more information about our CF Benchmark indices and our methodologies, please visit the respective web links below:
- CF Diversified Large Cap Index
- CF DeFi Composite Index
- CF Web 3.0 Smart Contract Platforms Index
- CF Digital Culture Composite Index
- CF Blockchain Infrastructure Index
- CF Cryptocurrency Ultra Cap 5 Index
Contact Us
Have a question or would like to chat? If so, please drop us a line to:
The information contained within is for educational and informational purposes ONLY. It is not intended nor should it be considered an invitation or inducement to buy or sell any of the underlying instruments cited including but not limited to cryptoassets, financial instruments or any instruments that reference any index provided by CF Benchmarks Ltd. This communication is not intended to persuade or incite you to buy or sell security or securities noted within. Any commentary provided is the opinion of the author and should not be considered a personalised recommendation. Please contact your financial adviser or professional before making an investment decision.
Note: Some of the underlying instruments cited within this material may be restricted to certain customer categories in certain jurisdictions.
Digital Assets Absorb Hawkish Repricing Ahead of the FOMC
Digital assets traded through a hawkish macro surprise this week but closed mostly higher, with breadth holding across major names and indices. Sector leadership traced to a single regulatory catalyst, not a broad rotation, and implied volatility stayed firmer than realized into the weekend.

Mark Pilipczuk
Factor Friday - July 24, 2026
Beta's four-week grind higher stalled this week as style leadership rotated again: Momentum took the top spot, last week's leader Value fell to the bottom, and Growth stayed July's weakest factor. Size remains the only style factor positive on the year; beta, not style selection, is setting returns.
Mark Pilipczuk
Changes to the Token Market Price Benchmarks Series - Market Prices – 21 July 2026
The Administrator has confirmed changes to the Token Market Price Family for the period 14 July 2026 to 21 July 2026.
CF Benchmarks
By clicking Accept, you consent to CF Benchmarks's use of cookies.
Visit Cookie Settings to learn how CF Benchmarks uses cookies and to adjust your preferences.