Apr 16, 2021
BRR Power: updated research backs the index again
The CME CF Bitcoin Reference Rate has rapidly become the only regulated Bitcoin benchmark backed by a large body of published research
 Those familiar with the research on the CME CF Bitcoin Reference Rate (BRR) published last year probably won’t be surprised that an update of the analyses based on more recent price data corroborates the original findings.
Still, it was an update well worth doing.
For one thing, with the earlier BRR Constituent Exchange data covering the stretch between January 2019 to November last year, the time elapsed since then obviously offers a rich data seam to be mined, particularly given Bitcoin’s near-500% return between October and March.
More to the point, taking the opportunity offered by the passing of time to update the analyses would strengthen the conclusions drawn in the December paper, regarding the market integrity, representativeness, and replicability of the BRR.
Ultimately, demonstrating that the BRR continued to meet the most stringent standards of those qualities underpins the stated aim of the research in the first place: to validate the BRR as a superior reference price for providers of regulated Bitcoin financial products, chiefly ETFs.
In fact, since the initial publication, several ETF providers – like Evolve in Canada and QR Asset in Brazil - have affirmed the BRR’s watertight qualities by launching Bitcoin ETFs based on the BRR. Others have applied to regulators to launch Bitcoin ETFs based on the BRR, or one its regulated benchmark sister indices, like the CF Bitcoin Settlement Price (US Close), with which WisdomTree will power its WisdomTree Bitcoin Trust.
As well, the largest and most established institution with products referencing the BRR – the CME Group, with its Bitcoin futures and options contracts – has announced that it will launch Micro Bitcoin Futures (MBT) in May. One-tenth the size of CME’s existing Bitcoin Future contract, MBT will offer increased efficiency and cost effectiveness to institutional traders whilst also providing easier access to individual participants.
The steady increase of assets referencing the BRR is a further reason to re-examine the capabilities of the regulated benchmark with updated data.
Thankfully, the latest data reconfirm that the BRR is a solid benchmark price on all three of the crucial qualities examined in the original paper and the updated version:
We defined those qualities as ‘Representativeness’, ‘Integrity’ and ‘Replicability’. The research determined how well the BRR matches the most stringent standards of these qualities by means of quantitative analyses. The data were then summarised in several tables. We’ve excerpted a few of them below and added some explanations.
- Representativeness
It was possible to trade 1,763 Bitcoins, on average, per day at the BRR price, over an average of 6,656 transactions worth more than $15m per day – at the time of the research. Overall, the takeaway is that there’s little doubt that the BRR price represents a sizeable chunk of the Bitcoin market.
Table 1
- Integrity
Though the BRR’s potentially erroneous data parameter (PEP) is a contingency that CF Benchmarks hasn’t needed to use since January 2019, it serves as a useful threshold for quantifying market and price integrity. PEP is one of myriad safeguards deployed as integral aspects of the BRR’s benchmark methodology. The parameter mandates that if an instance of a Constituent Exchange’s volume-weighted median price deviates more than 10% from volume-weighted median prices of other Constituent Exchanges, then prices from the Constituent Exchange in question are excluded from index calculations.
For sure, a potential trigger of the PEP might turn out not to have been due to market manipulation. But the standards that CF Benchmarks holds itself to – as befits an EU-authorised Benchmark Administrator—require a response that eliminates risk of a nefarious cause. As such, the data in table two confirm that the PEP hasn’t been triggered for over two years whilst showcasing tight spreads between Constituent Exchanges; as well, the readings are a strong indication of the BRR’s market integrity.
Table 2
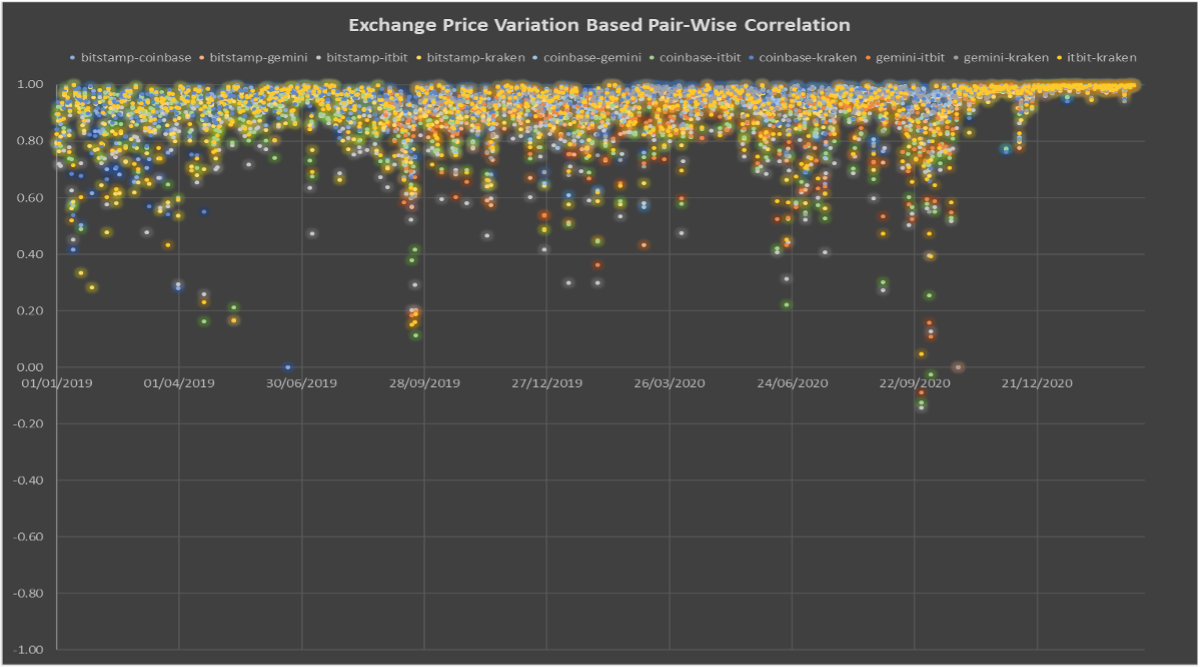
Likewise, an analysis that was intended to expose the degree to which each individual Constituent Exchange was correlated individually with all other Constituent Exchanges produced results that were just as striking in the updated research as from the initial data. The approach is called a pair-wise correlation and it could reveal inconsistencies—even potential manipulation—within Constituent Exchange prices that might not be spotted within the BRR index value itself due to the aggregated methodology of its construction.
Figure 1
The scatterplot in Figure 1 charts all possible pair-wise correlation values daily between January 19th, 2020 and February 28th, 2021. Quoting from the paper: “The clustering towards correlation coefficients of 1.00 and less than 1% of days when any exchange had a correlation with another exchange below 0.5 demonstrate strong price correlation between the Constituent Exchanges.” This represents compelling evidence that the market integrity of the BRR continues right down to the level of each individual exchange.
- Replicability
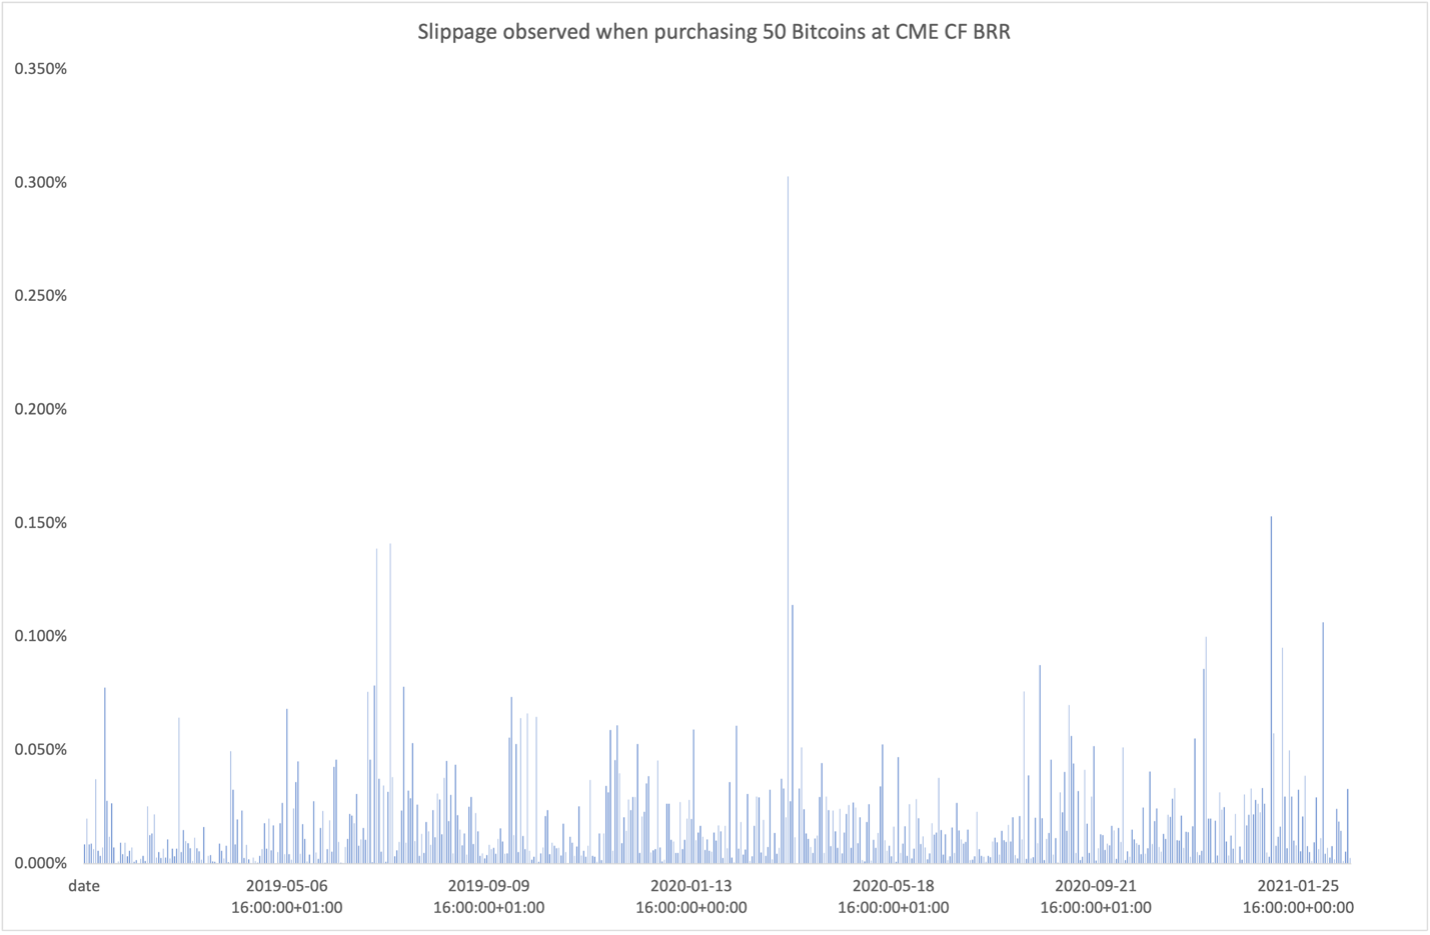
It’s all very well having a high-quality benchmark price but if it’s not consistently achievable in practice—i.e., in the market—what’s the point? Fortunately, as the chart in Figure 1 shows, slippage—the difference between the benchmark BRR price and the price at which it was possible to buy Bitcoin during the two-year study—was negligible. To ensure we addressed potential Bitcoin buys at a truly institutional scale, we simulated a huge volume of transactions—aiming for one transaction per second during a daily 1-hour window between January 2019 and end-February 2021. The biggest ‘spike’ in slippage is obviously the one visible in March 2020, when the BRR/market price deviation approached 0.3%. Apart from that, slippage was mostly in the range of 0% to approximately 0.15%. Objectively, that equates to a high degree of replicability that remained relatively stable during the course of our research.
Figure 2
With institutional Bitcoin adoption well underway and subsequent demand for regulated Bitcoin investment products only likely to increase further, we expect prospective regulated Bitcoin product providers to continue coalescing towards price indices evincing the highest integrity, representative volume and replicability. In the meantime, the latest Constituent Exchange data continue to corroborate that the CME CF Bitcoin Reference Rate, the only regulated Bitcoin benchmark index, maintains those qualities to a stringent verifiable standard.
The information contained within is for educational and informational purposes ONLY. It is not intended nor should it be considered an invitation or inducement to buy or sell any of the underlying instruments cited including but not limited to cryptoassets, financial instruments or any instruments that reference any index provided by CF Benchmarks Ltd. This communication is not intended to persuade or incite you to buy or sell security or securities noted within. Any commentary provided is the opinion of the author and should not be considered a personalised recommendation. Please contact your financial adviser or professional before making an investment decision.
Note: Some of the underlying instruments cited within this material may be restricted to certain customer categories in certain jurisdictions.
Weekly Index Highlights, November 10, 2025
Softer mega-caps brought a rotation in top-assets, while Services and Programmable led on data and scaling strength, and mid-caps outperformed, propelled by Web3, DeFi, and Culture. Staking was mixed with modest shifts. Implied BTC volatility firmed, while USDT rates stayed firm and Bitcoins' eased.

CF Benchmarks
CFB Talks Digital Assets Episode 51: How MicroBit Capital created one of Hong Kong's fastest-growing Bitcoin ETFs, with CIO Kenny Khuong
We’re delighted to welcome MicroBit Capital Management's Chief Investment Officer, Kenny Khuong, as our first Hong Kong-based investment management guest on the CFB Talks Digital Assets podcast.

Ken Odeluga
Policy Progress & Portfolio Pressures
Our market recap offers a concise overview of key blockchain categories and their recent price action within the broader market context, providing valuable insights for investors and industry practitioners.

Gabriel Selby