
Nov 02, 2026
Binance Hack Turns a Post-FOMC Drift Lower Into a Sharp Decline
Weekly Index Highlights, November 2, 2026
Digital assets had already eased from Wednesday's post-FOMC close after the Fed's hawkish hold: the CME CF Crypto Market Index (CMI) set its weekly high at Wednesday's close and slipped 0.40% into Thursday's. The theft of roughly $6.36 billion from Binance hot wallets, which began at 20:05 UTC on Thursday, October 29th, five minutes after the New York close, accelerated the move: CMI fell 5.12% into Friday's close as Bitcoin (BTC) dropped 5.31% and BNB 6.30%, and a partial weekend recovery left it down 3.28% week-on-week (w/w). The hack also left clear outliers in the on-chain metrics we track. Ethereum network fees reached $6.71 million on October 29th, 17.5 times their 30-day median and the highest daily total since our tracking began in February, coinciding with the swapping of stolen stablecoins into ETH and driven largely by MEV bots trading around those swaps; the validators' share peaked at $4.02 million a day later and carried the CF ETH staking reward rate to 7.20%, the highest print in its available history. Uniswap fees rose to 5.2 times their median on its busiest Ethereum day of 2026. Aave froze new supply and borrowing across 292 reserves on its V3 and V4 deployments for about 16 hours after the attacker used it to borrow ETH; the USDC borrow rate on its main Ethereum market jumped from about 5% to about 14% before risk managers capped stablecoin rates at 10%, cut borrow caps and set zero loan-to-value on nine assets, with no date set for lifting that restriction. Friday's equity sell-off and spot Bitcoin ETF outflows coincided with further weakness but did not start the decline.
Market Performance Update
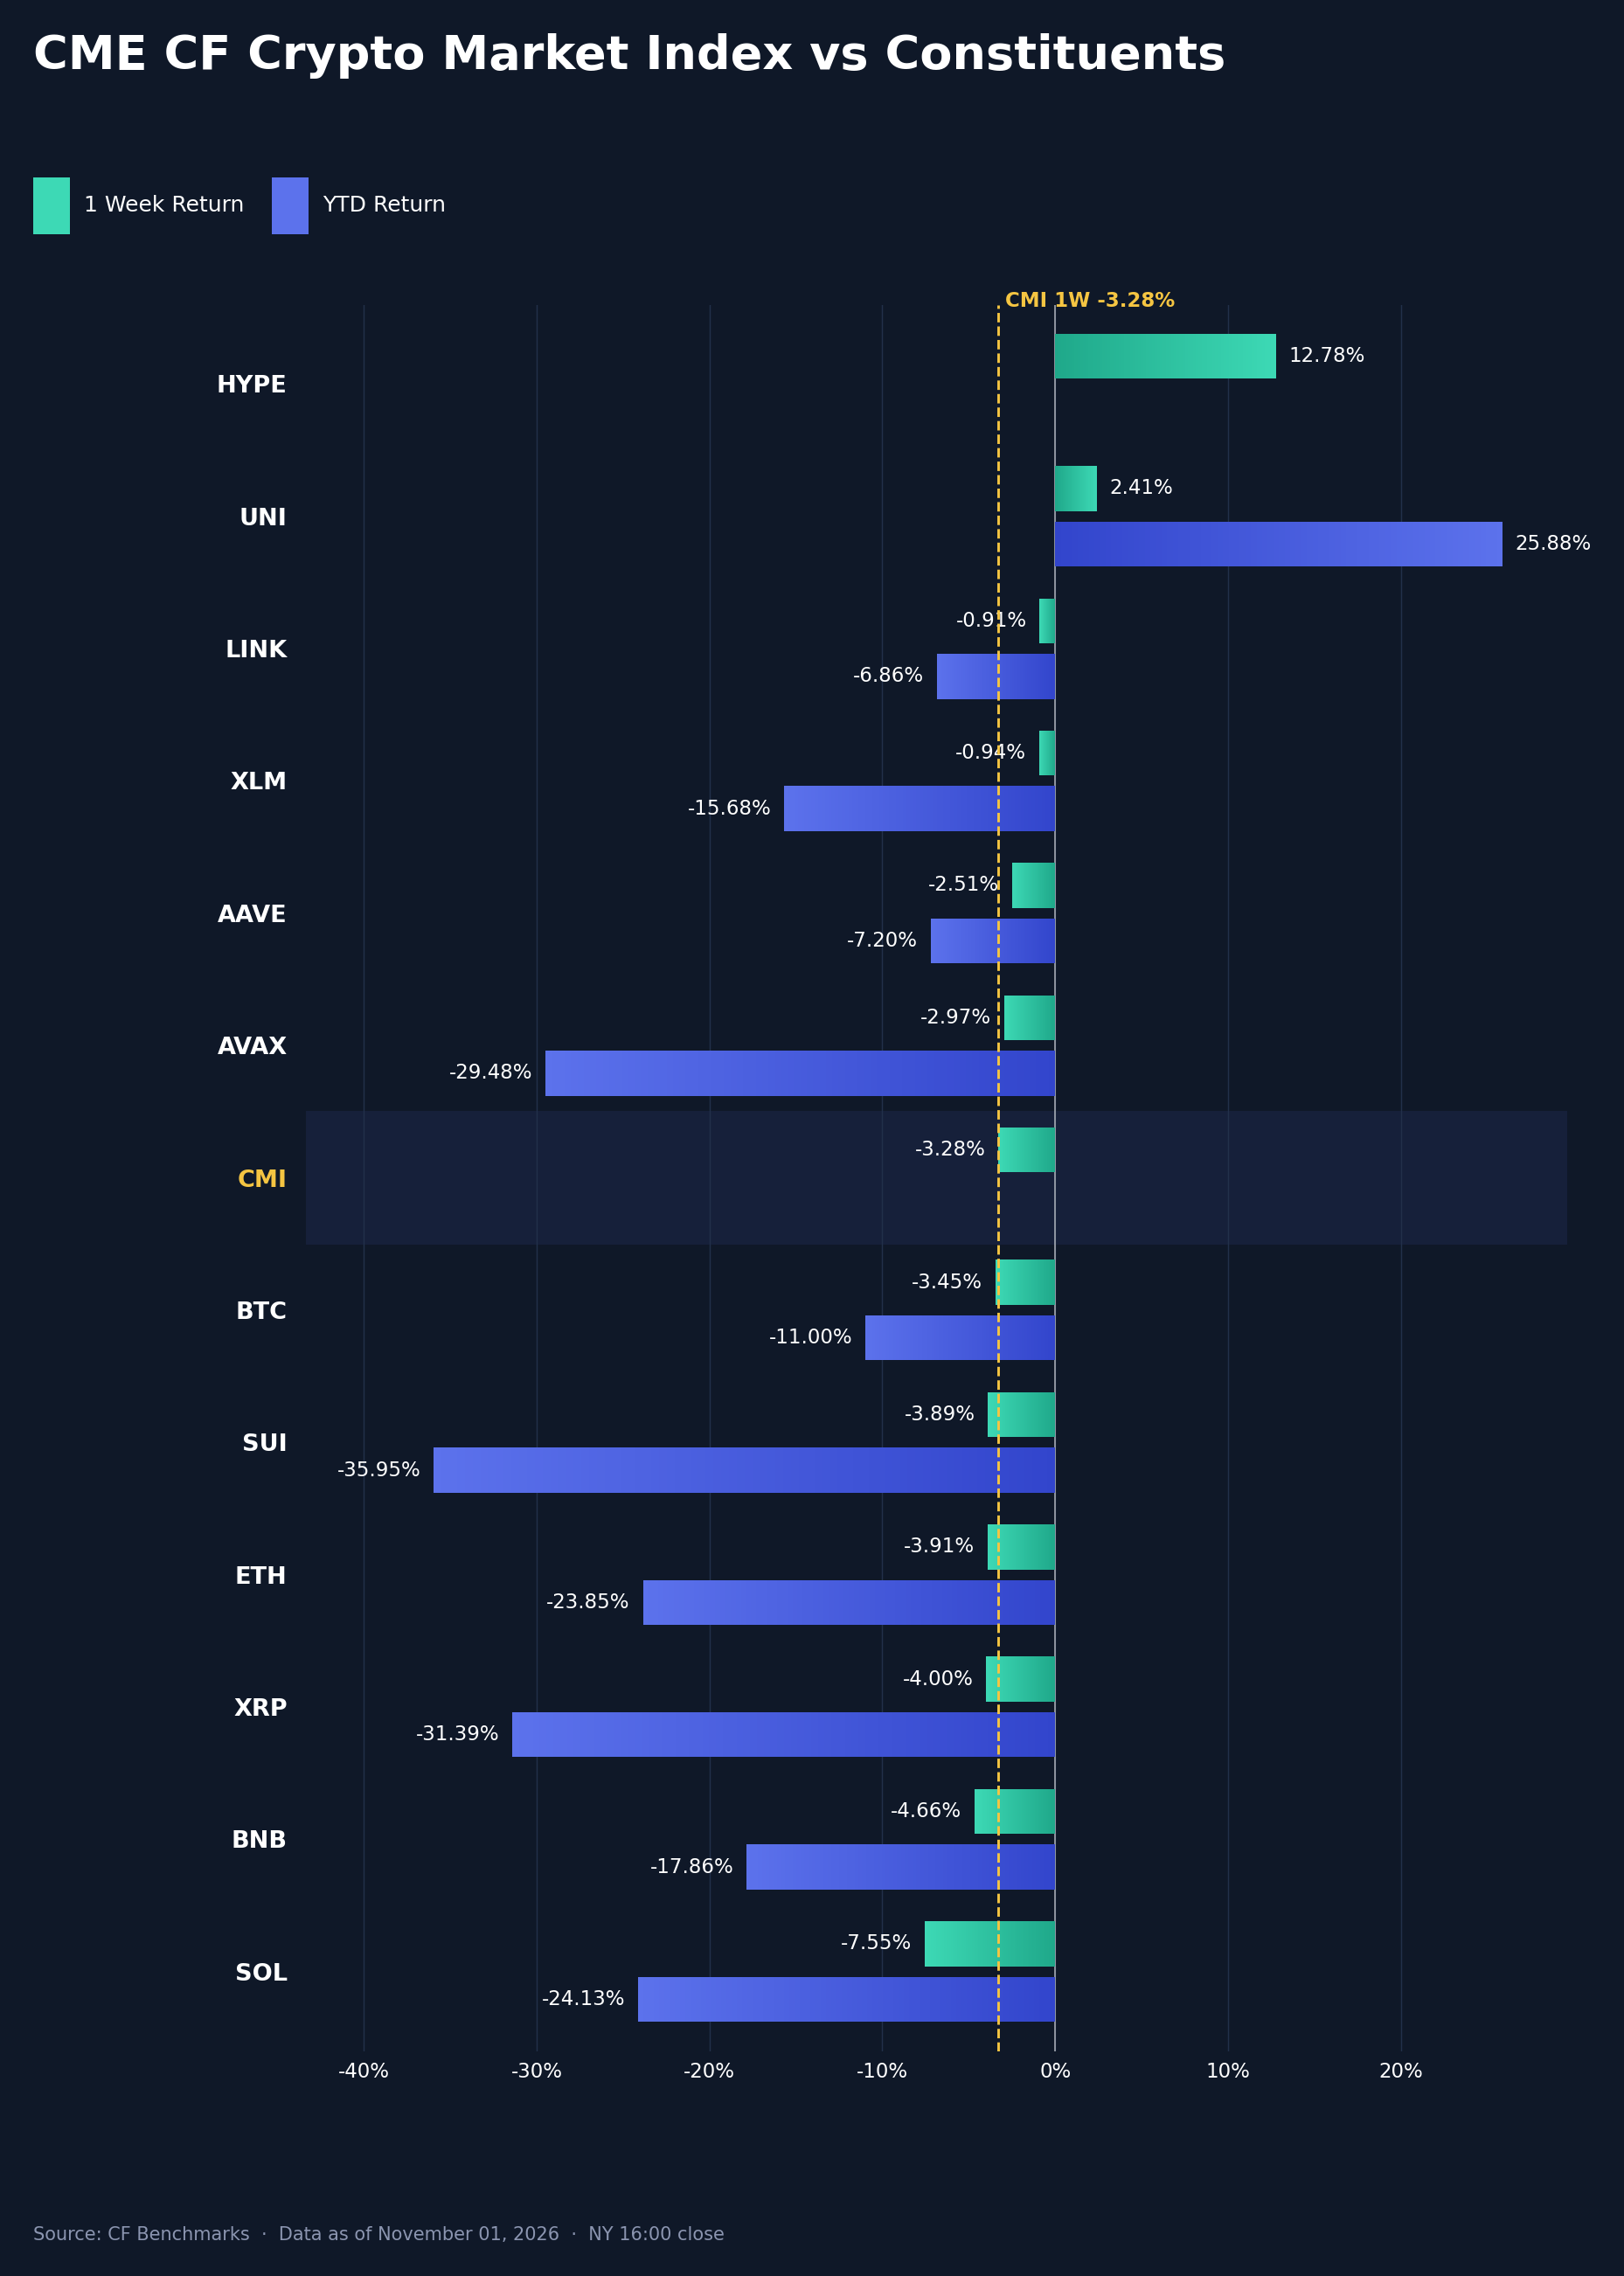
The CME CF Crypto Market Index (CMI), the measure of the market in this section, fell 3.28% w/w from October 25th to November 1st, after a 0.08% decline a week earlier. The index was up 1.01% through Wednesday's close and 0.61% through Thursday's, then fell 5.12% on Friday, the first New York fix after the Binance outflows began, before recovering 1.31% over the weekend. Six of the twelve constituents beat the market. Hyperliquid (HYPE) led by a wide margin, 16.06 percentage points (pp) ahead with a 12.78% gain, driven by a 15.92% rise on Thursday before the hack, after Intercontinental Exchange (ICE) announced an agreement with trade[XYZ] to develop a US market and clearing structure for perpetual futures built on Hyperliquid, subject to regulatory approval; HYPE gave back part of that gain over Friday and the weekend. Uniswap (UNI) followed at +5.69pp, Chainlink (LINK) at +2.37pp, Stellar (XLM) at +2.34pp, Aave (AAVE) at +0.77pp and Avalanche (AVAX) at +0.32pp. Bitcoin (BTC) trailed by 0.17pp with a 3.45% decline, followed by Sui (SUI) at -0.61pp, Ether (ETH) at -0.62pp and XRP (XRP) at -0.72pp. BNB (BNB), the exchange's own token, lagged by 1.38pp and fell 6.30% on Friday alone, and Solana (SOL) was the weakest at -4.27pp, a 7.55% decline. The spread between the best and worst relative performers, HYPE and SOL, was 20.33pp. BTC subtracted 2.50pp from the index return and the rest of the basket 0.78pp, with HYPE's gain adding back 0.32pp. On a year-to-date (YTD) basis BTC is down 11.00%, ETH 23.85% and SOL 24.13%, with UNI the standout at +25.88%. The index had already eased before the hack: after the Fed held at 3.75% to 4.00% on Wednesday with two dissents in favor of a hike, BTC's Wednesday fix was 0.72% higher, but the index closed Thursday 0.40% below its Wednesday high as the Nasdaq fell 1.4% on Alphabet's decline. Friday's 2.0% fall in the S&P 500 and $643 million of spot Bitcoin ETF outflows coincided with further weakness intraday, but based on exchange prints, BTC's weekly low was only about $160 below Thursday night's post-hack trough. BTC closed Sunday at $77,713.55, 1.63% above Friday's fix.
Volatility Analysis
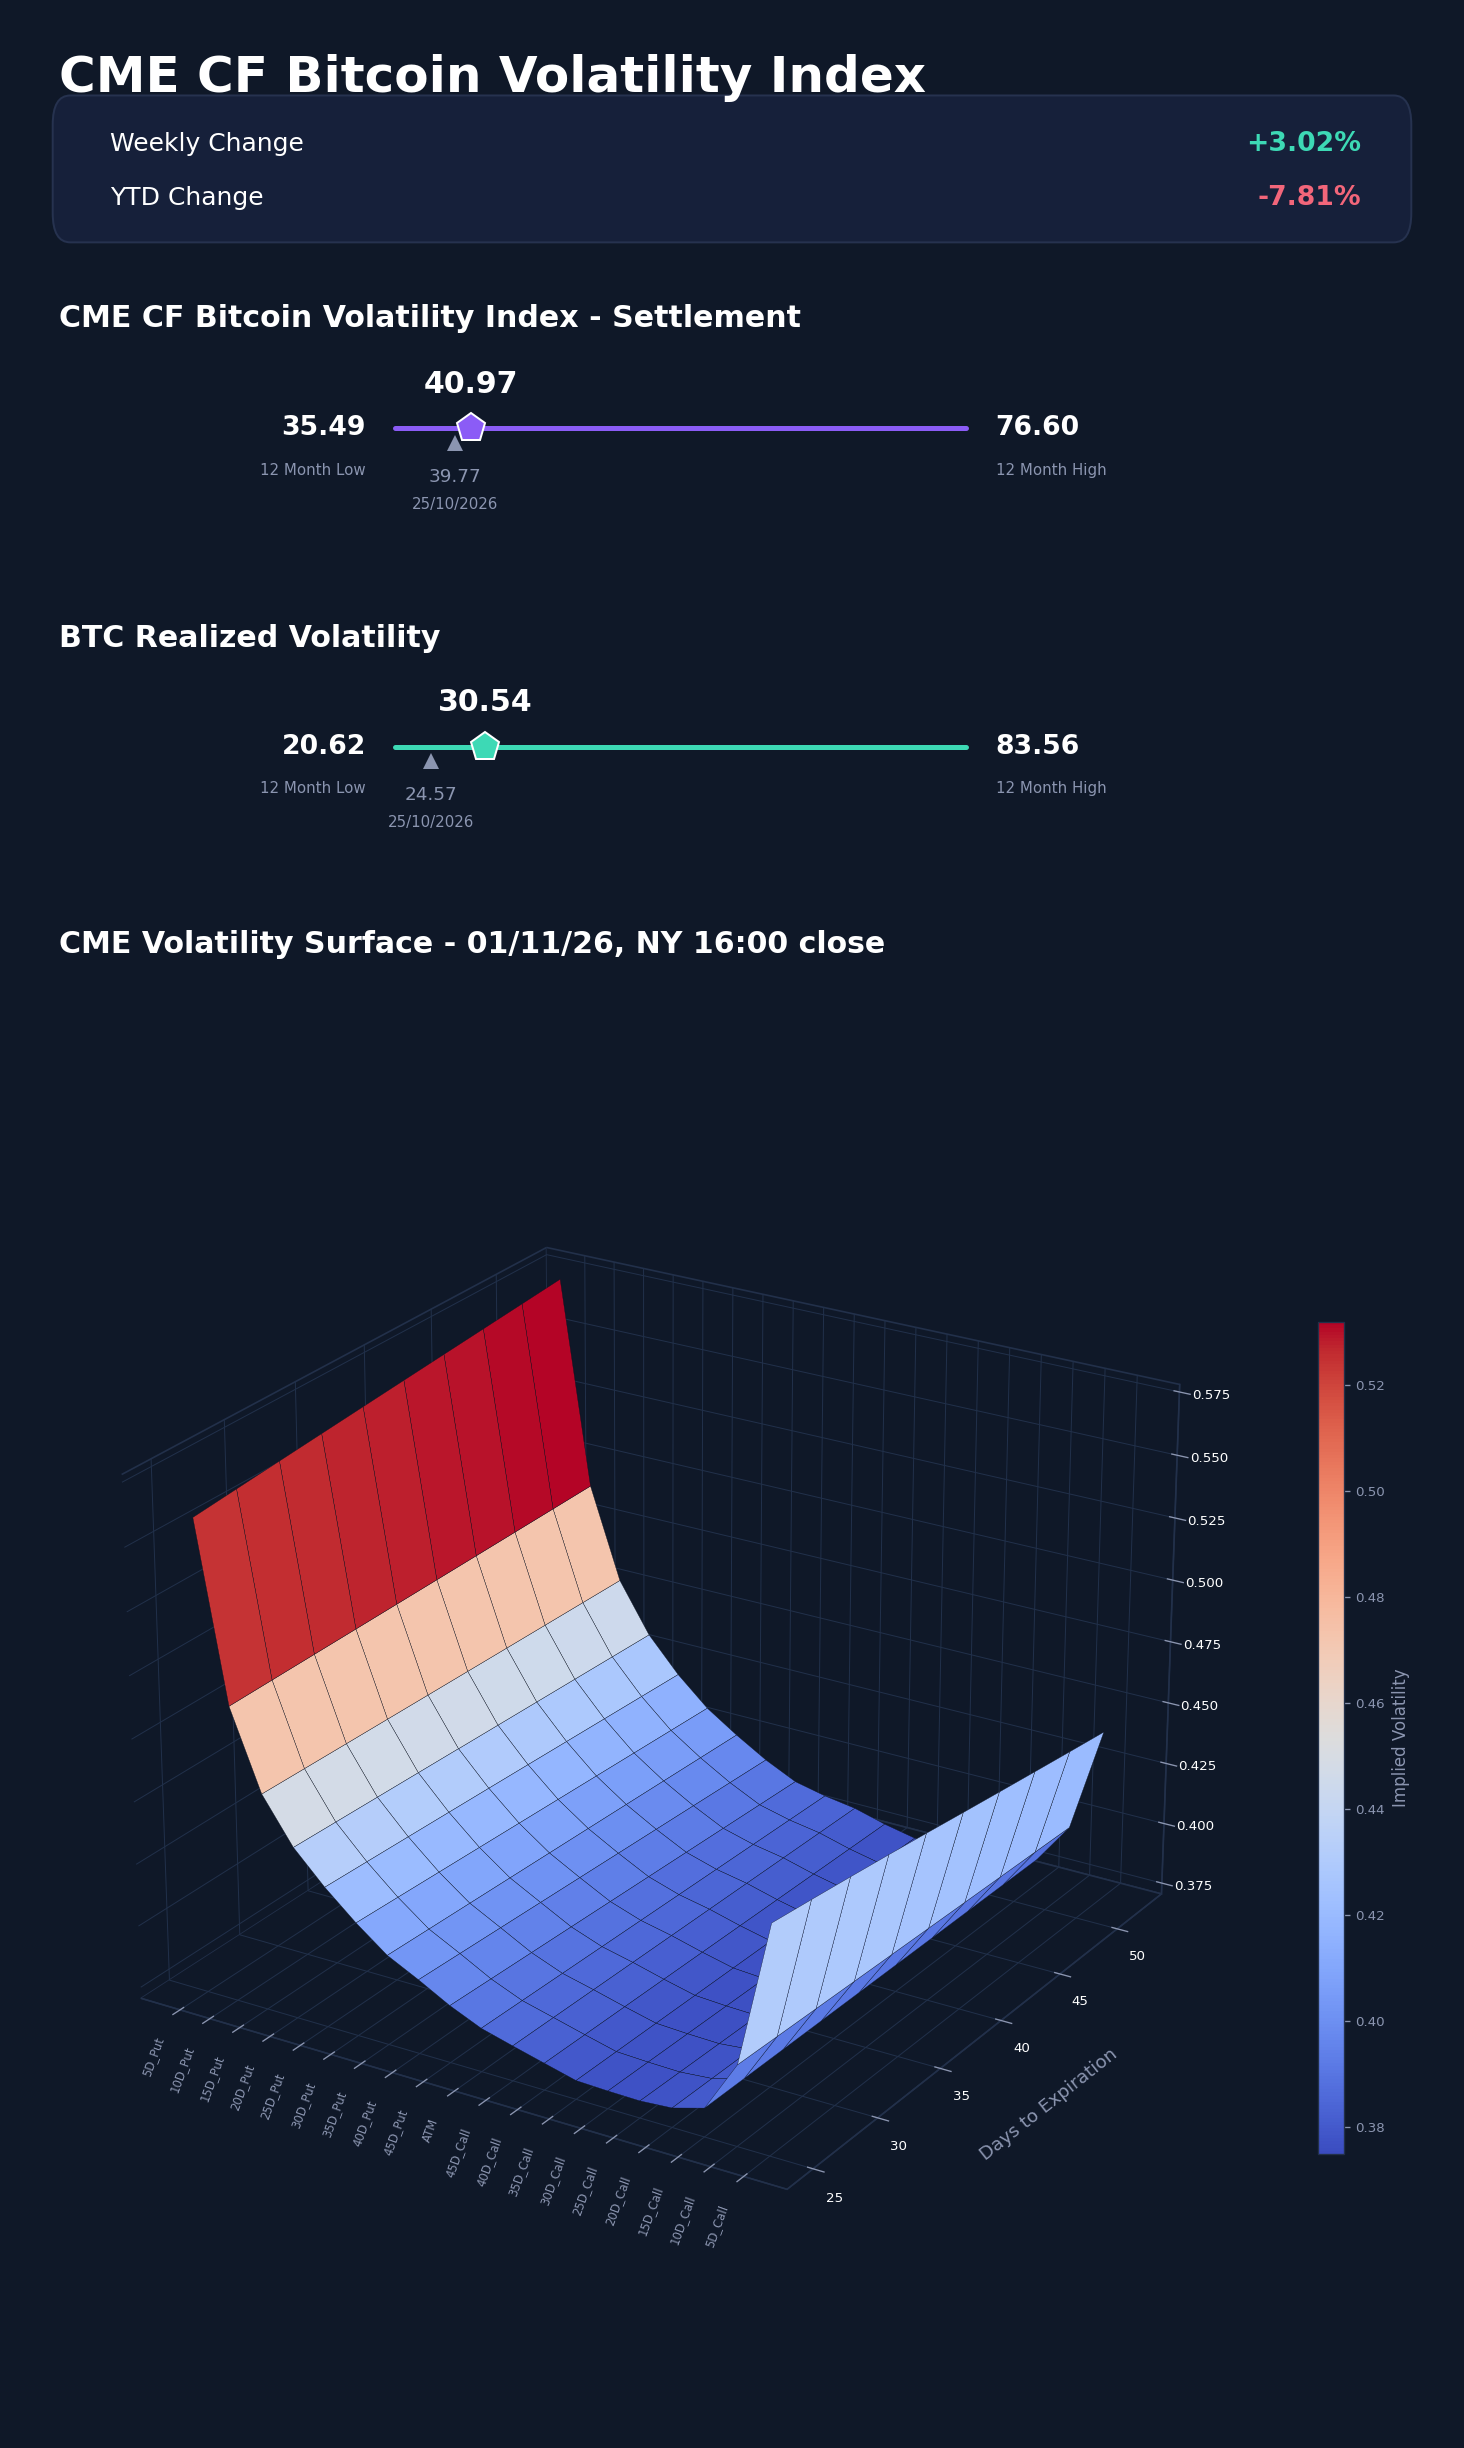
The CME CF Bitcoin Volatility Index Settlement (BVXS) rose 3.02% on the week, to 40.97 on November 1st from 39.77 a week earlier, but the path was uneven. Across the business week BVXS drifted lower, from 39.58 on Monday to 37.23 on Thursday, and held at 37.27 on Friday even after the hack, before repricing to 41.45 on Saturday and settling at 40.97 on Sunday. Realized volatility moved first: Friday's 5.31% BTC decline lifted 30-day realized volatility to 30.39 from 24.43, and it ended the week at 30.54 against 24.57 a week earlier. That narrowed the implied-realized spread to 10.43 vol points from 15.20, so options now price less excess movement over what BTC has recently delivered. BVXS sits 5.48 points above its 12-month low of 35.49, well below the 76.60 high, and is down 7.81% YTD from its 44.44 start-of-year reference. On the surface, the one-month at-the-money (ATM) implied volatility (31 days this week against 32 days a week earlier) rose to 38.71 from 36.29, while the 5-delta put wing over ATM narrowed to 17.54 vol points from 19.23. The shock lifted the level of implied volatility rather than demand for deep downside protection, consistent with a market repricing near-term movement without positioning for a disorderly crash.
Market Cap Index Performance
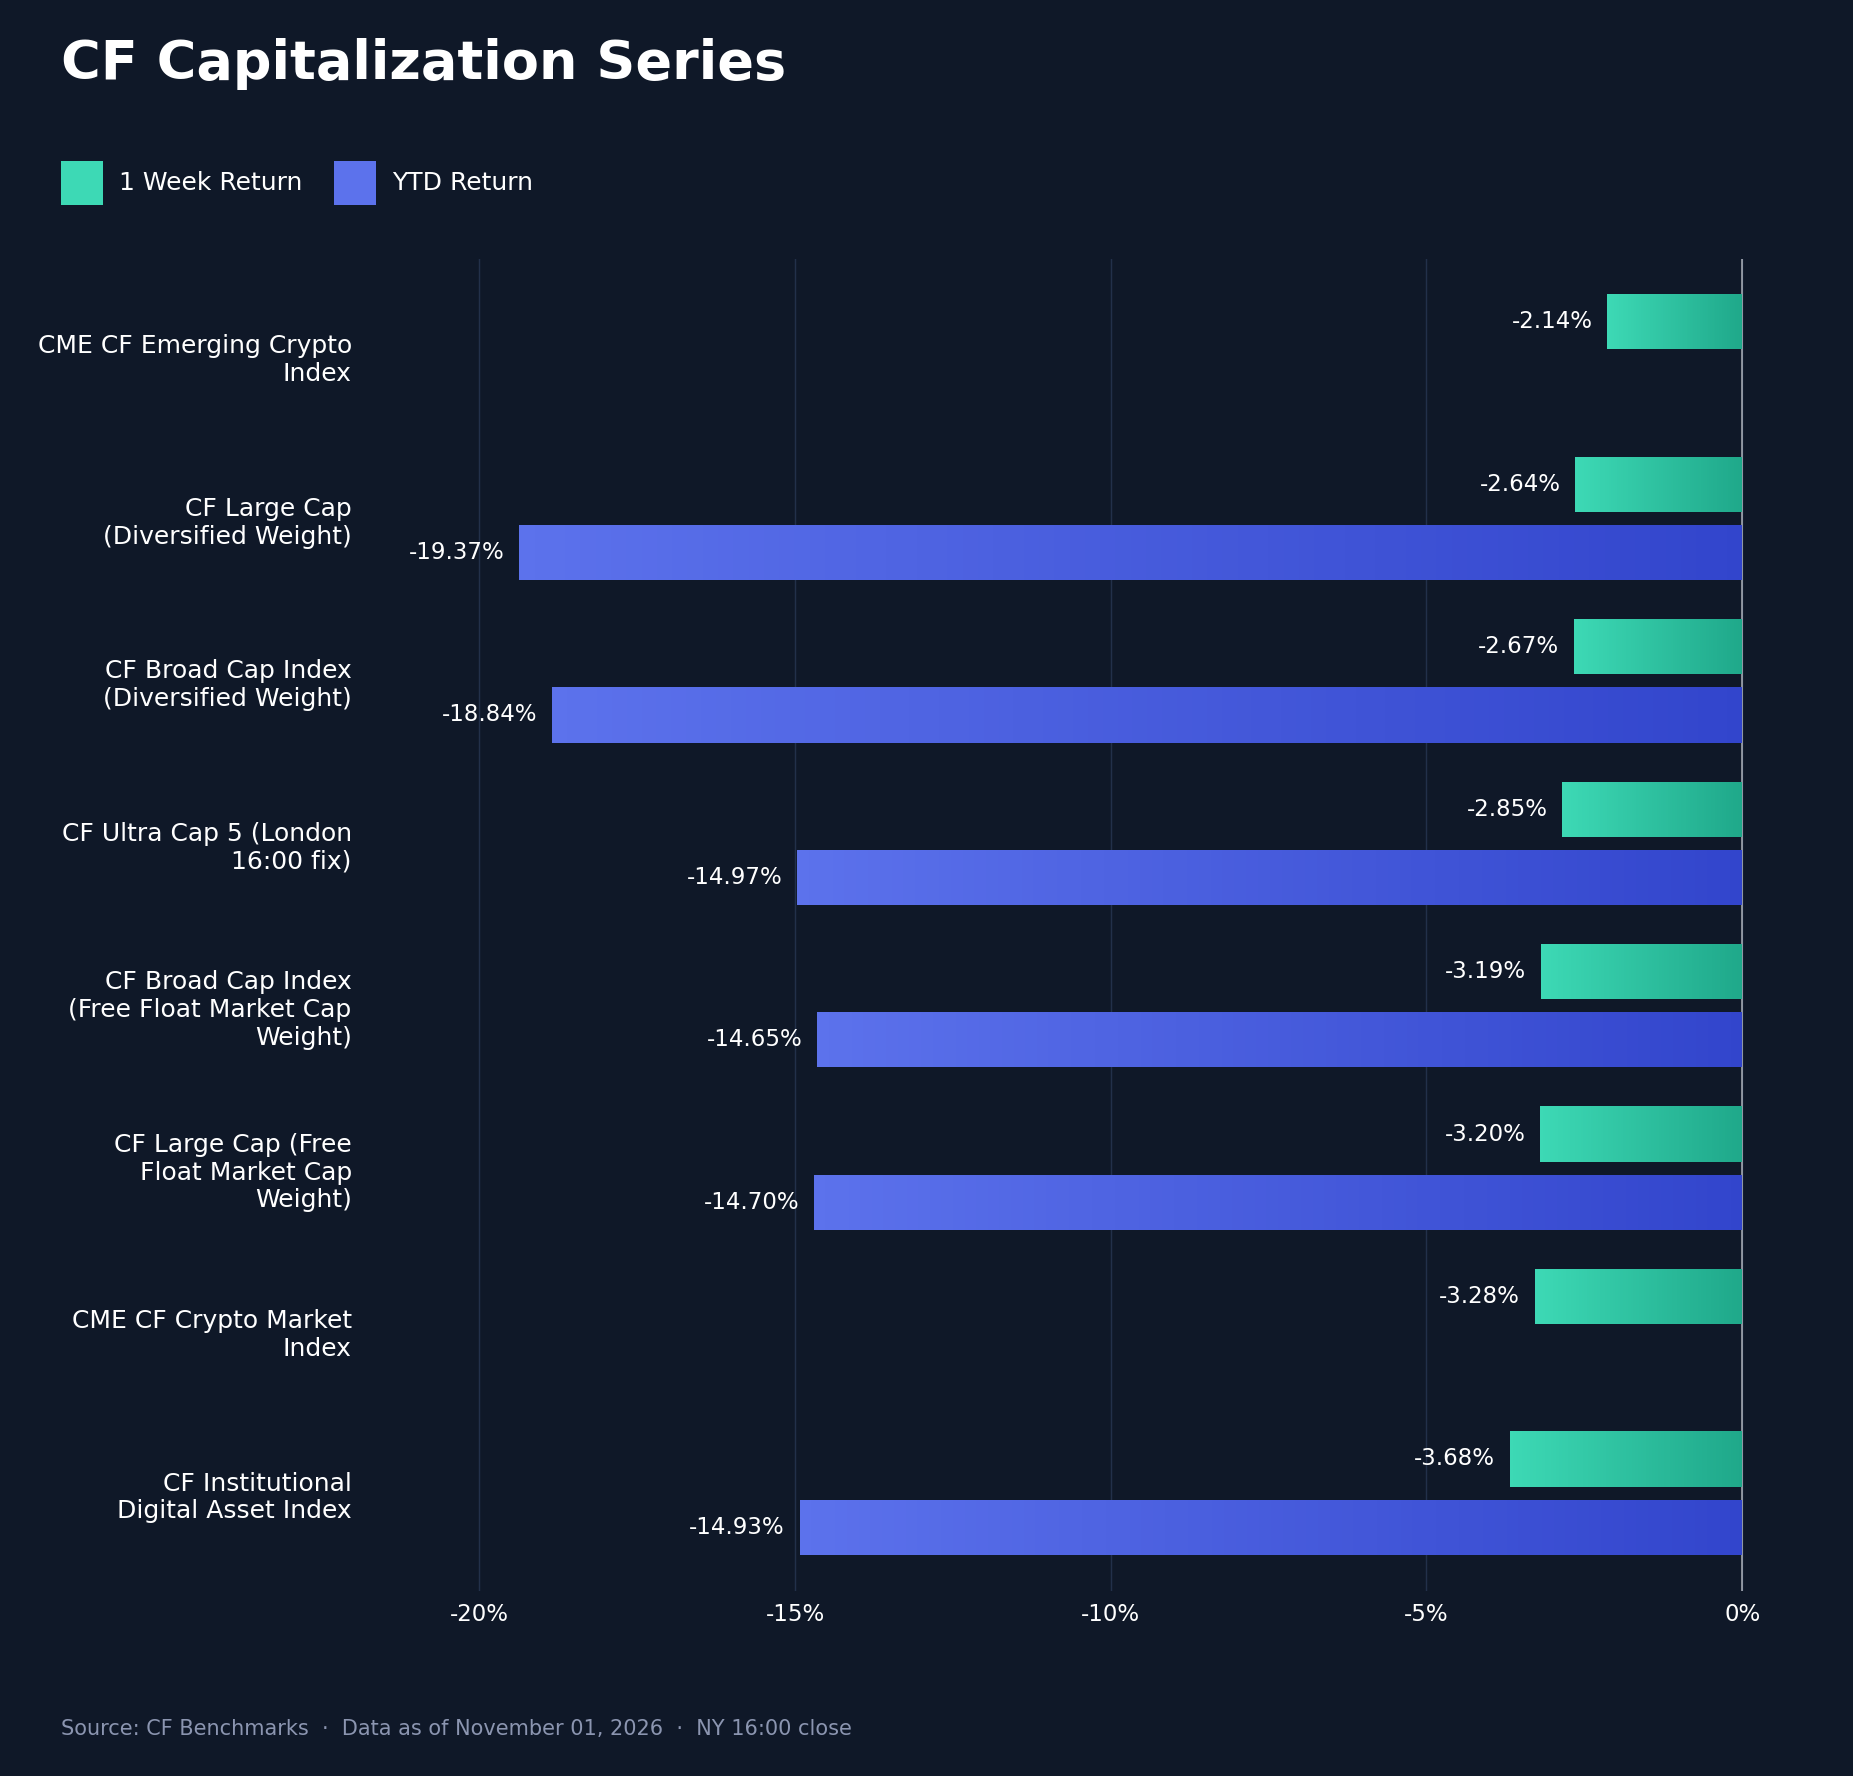
The CF Capitalization Series fell across the board, with every index down between 2.1% and 3.7%. The CME CF Emerging Crypto Index held up best at -2.14%, after +2.01% a week earlier, followed by CF Large Cap (Diversified Weight) at -2.64% and CF Broad Cap (Diversified Weight) at -2.67%. CF Broad Cap (Free Float Market Cap Weight) fell 3.19%, CF Large Cap (Free Float Market Cap Weight) 3.20%, the CME CF Crypto Market Index 3.28% and the CF Institutional Digital Asset Index 3.68%. The weekly range between the Emerging Crypto Index's -2.14% and the Institutional Digital Asset Index's -3.68% was a 1.54pp spread. CF Ultra Cap 5 fell 2.85% on the London 16:00 fix, a different basis from the New York close used for the other indices, so it is not ranked against them. The diversified-versus-free-float gap (Broad Cap Diversified minus Large Cap Free Float) widened to +0.53pp from +0.31pp, the second consecutive week in which equal-leaning baskets held up better. On a YTD basis the free-float indices remain well ahead, with Large Cap Free Float at -14.70% against -18.84% for Broad Cap Diversified. The pattern is consistent with an exchange-specific shock rather than a macro deleveraging: the heaviest losses sat in the largest names, with BTC and ETH near the market and SOL, BNB and XRP the weakest CMI constituents, which weighs more on the free-float indices than on the equal-leaning ones.
Factors Analysis
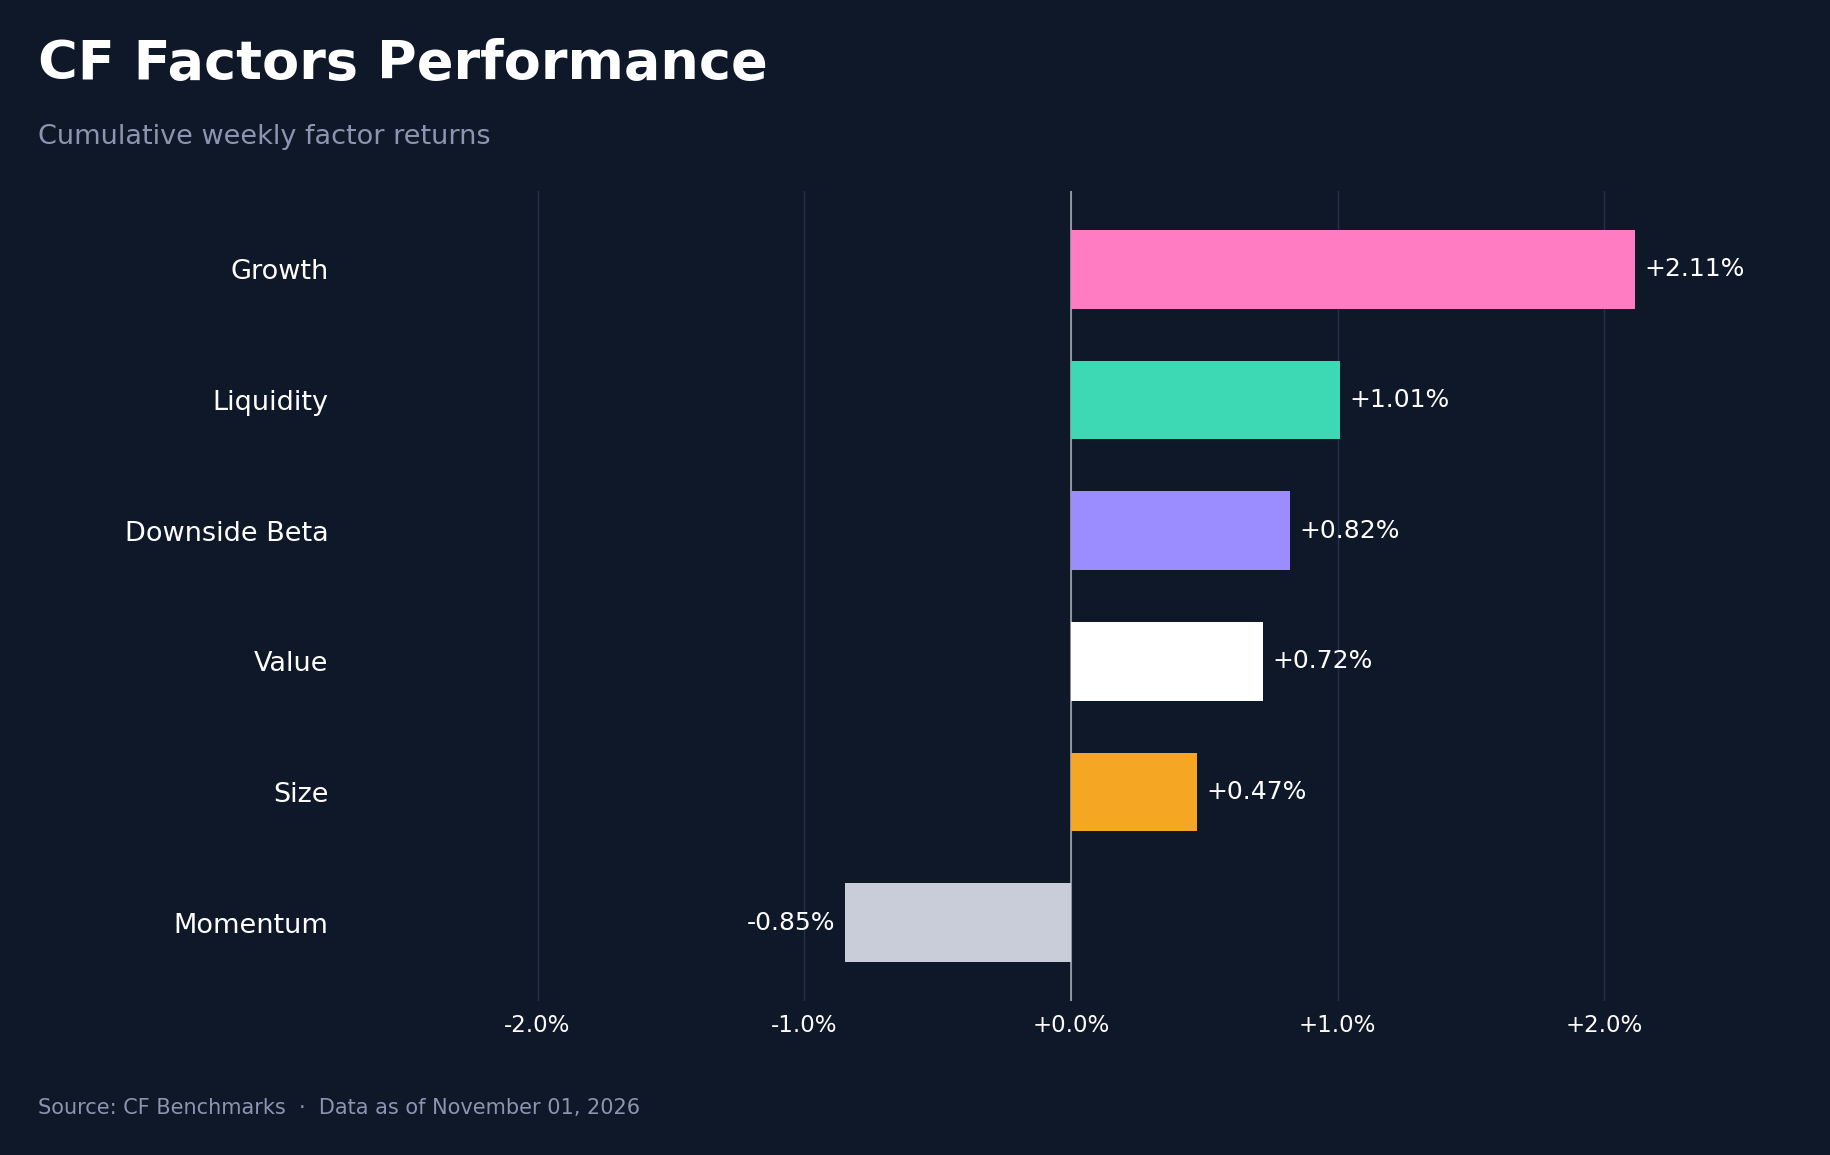
CF factor returns turned positive even as the market fell, with five of six factors higher after five of six were negative a week earlier. Growth led at +2.11%, followed by Liquidity at +1.01%, Downside Beta at +0.82%, Value at +0.72% and Size at +0.47%, while Momentum was the only negative factor at -0.85%. The weekly range between Growth's +2.11% and Momentum's -0.85% was a 2.96pp spread, wider than the 1.98pp range a week earlier. The biggest rotation was in Growth, which swung 3.74pp from -1.62%, having been the weakest factor over the prior two weeks. Value improved by 1.91pp, Liquidity by 1.56pp and Downside Beta by 1.40pp, while Size and Momentum were little changed. Downside Beta gained most on Friday, +0.82% on the day of the hack-driven decline, meaning assets with lower downside beta held up better as the market fell. The pattern points to a tilt toward lower-downside-beta, growth and value exposure, alongside smaller and less liquid assets (positive Size and Liquidity), rather than a broad risk-off rotation in factor terms.
Read our latest weekly crypto factors report: Factor Friday - October 30, 2026
Classification Series Analysis
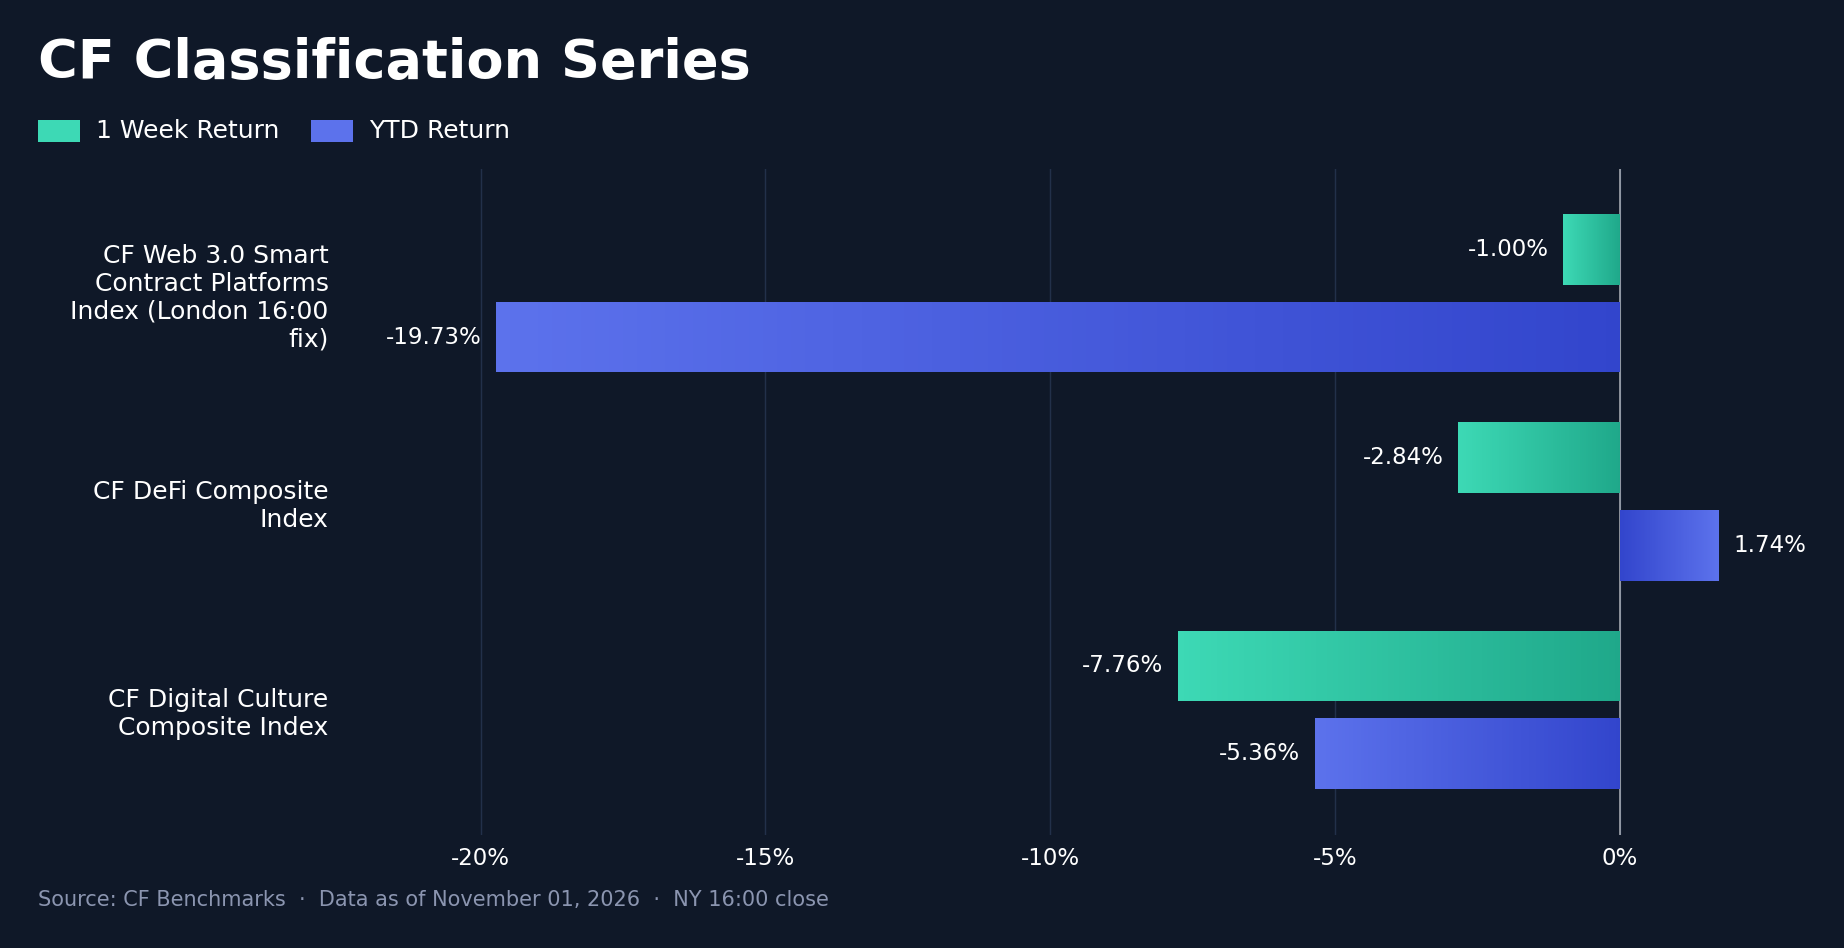
Within the CF Classification Series, the CF DeFi Composite Index fell 2.84%, after a 0.09% decline a week earlier, while the CF Digital Culture Composite Index fell 7.76% after a 3.22% drop. DeFi led Digital Culture by 4.92pp. The CF Web 3.0 Smart Contract Platforms Index fell 1.00% on the London 16:00 fix, which is not comparable with the New York close used for the two composites. On a YTD basis DeFi is up 1.74% and Digital Culture down 5.36%, while the Smart Contract Platforms Index is down 19.73%. Digital Culture bore the higher-beta end of the sell-off, with gaming and metaverse tokens among the week's weakest DACS constituents, while UNI (+2.41%) was among the few DeFi gainers.
Sector Analysis
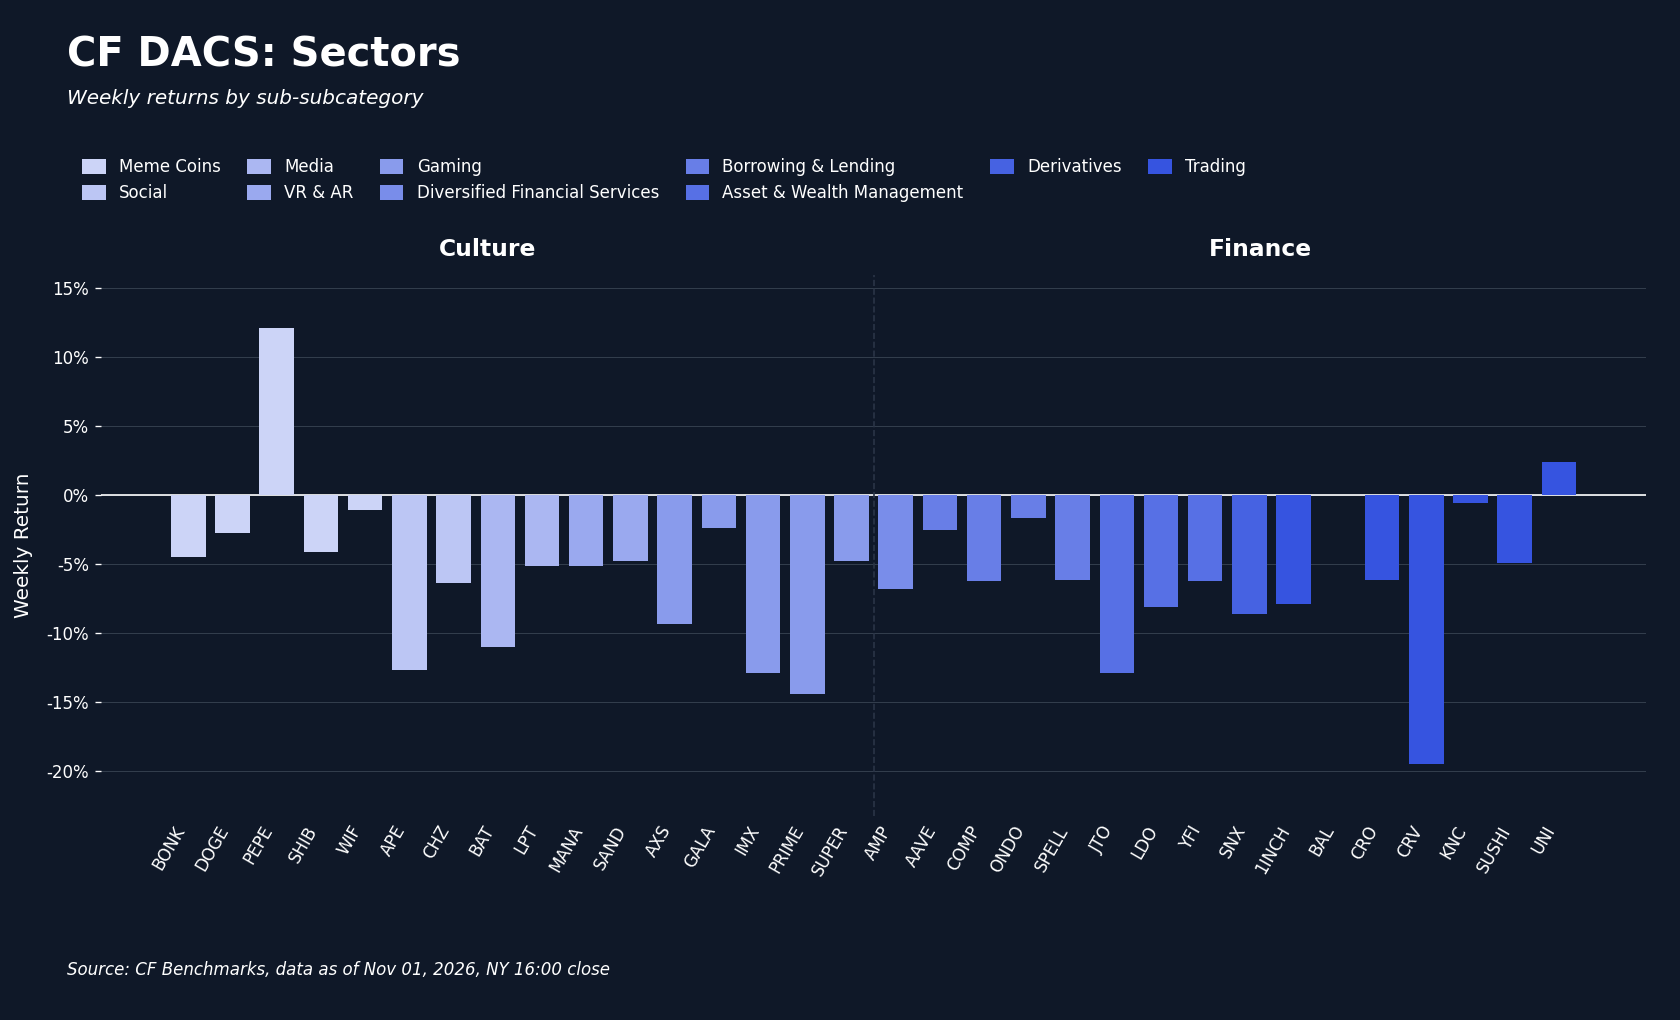
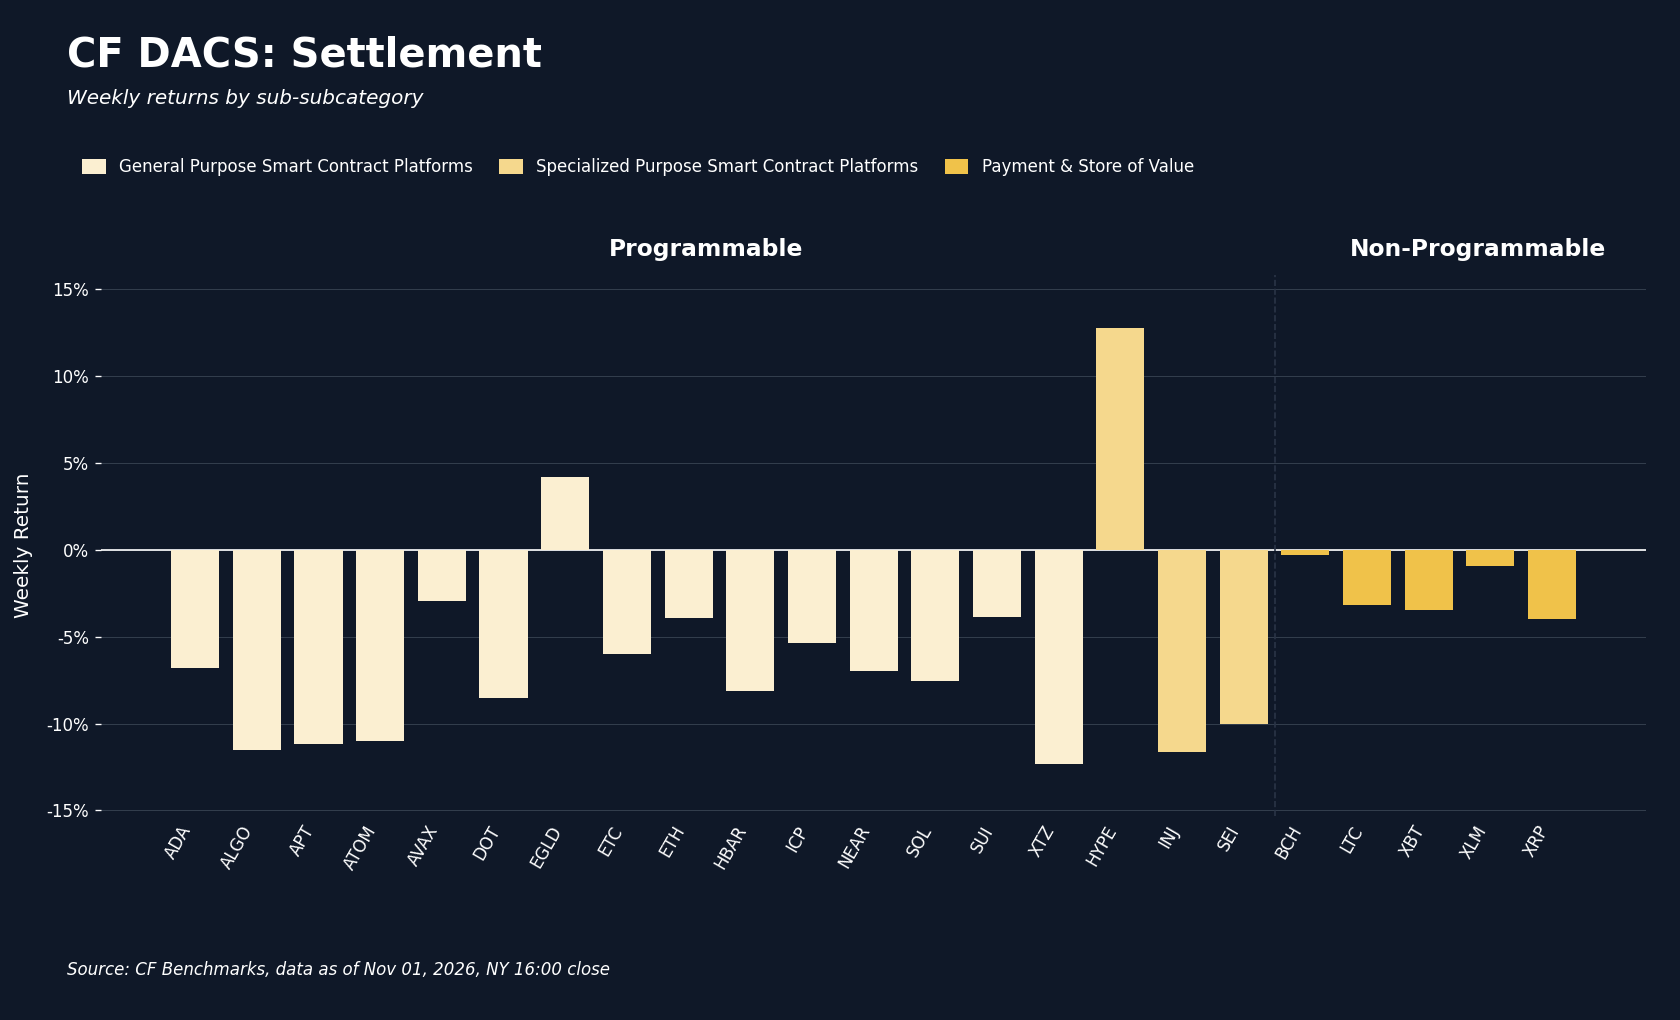
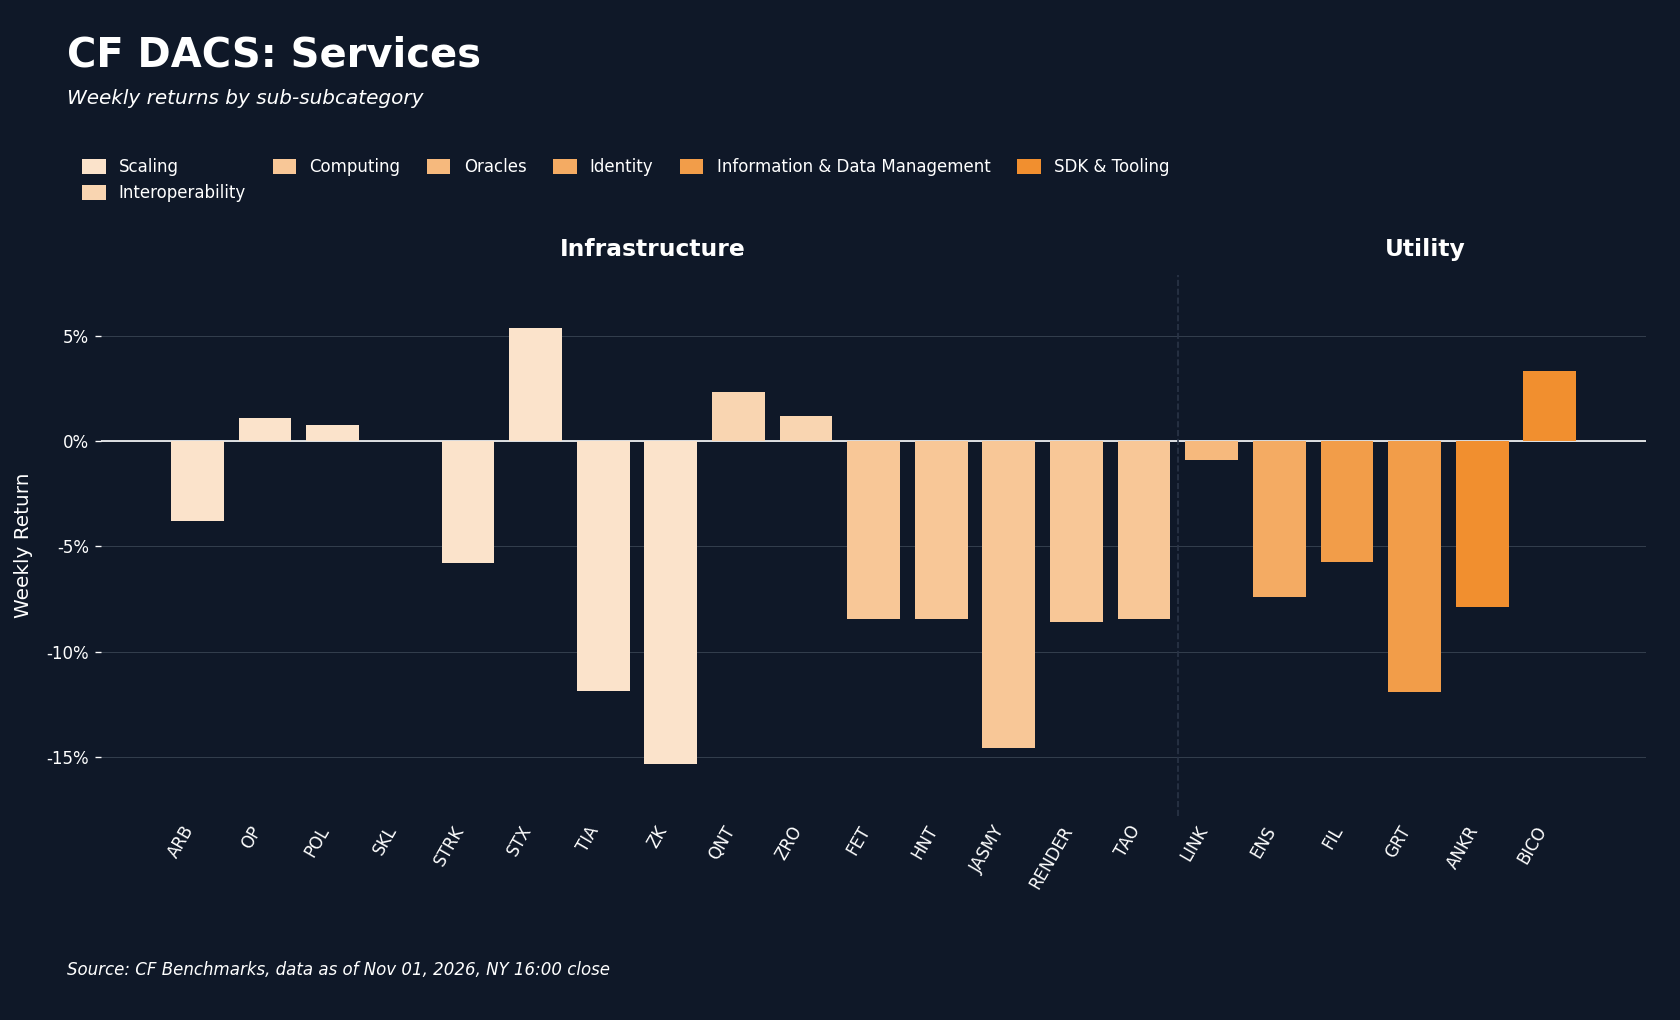
Across the CF DACS sub-categories, every average was negative and only 10 of 76 constituents with a weekly return finished higher. Non-Programmable fell least, at -2.37%, with Bitcoin Cash (BCH) -0.28% at the top and XRP -4.00% at the bottom. Infrastructure averaged -4.96% and had the most gainers, five of fifteen, led by Stacks (STX) +5.37% and Quant (QNT) +2.31%, against ZKsync (ZK) -15.30% and JasmyCoin (JASMY) -14.57%. Utility averaged -5.09%, with Biconomy (BICO) +3.30% against The Graph (GRT) -11.89%. Culture averaged -5.58%: Pepe (PEPE) rose 12.13% for a second strong week, while Echelon Prime (PRIME) fell 14.46% and Immutable (IMX) 12.94%. Finance averaged -6.00%, with UNI +2.41% the only gainer against Curve (CRV) -19.48% and Jito (JTO) -12.91%. Programmable was the weakest sub-category at -6.16%, despite holding the week's best constituent: HYPE rose 12.78% on the week after a 15.92% gain on the day of the ICE announcement, while Tezos (XTZ) fell 12.31%, Injective (INJ) 11.66% and SOL 7.55%. The widest token-level spread, between HYPE's +12.78% and CRV's -19.48%, was 32.25pp. The Binance hack touched several sub-categories directly. In Finance, the attacker deposited 60 million stolen USDT into Aave to borrow 19,762 ETH, and Aave froze new supply and borrowing across its markets for about 16 hours; AAVE fell 5.36% on Friday, rebounded 6.50% on Saturday and ended down 2.51%. In Infrastructure, the Arbitrum Security Council moved 8,426 ETH and 74.6 million ARB out of the attacker's reach, and Arbitrum (ARB) fell 3.78% on the week. BNB, the exchange's own token, is not a DACS constituent and is covered in the market section above.
CF Staking Series
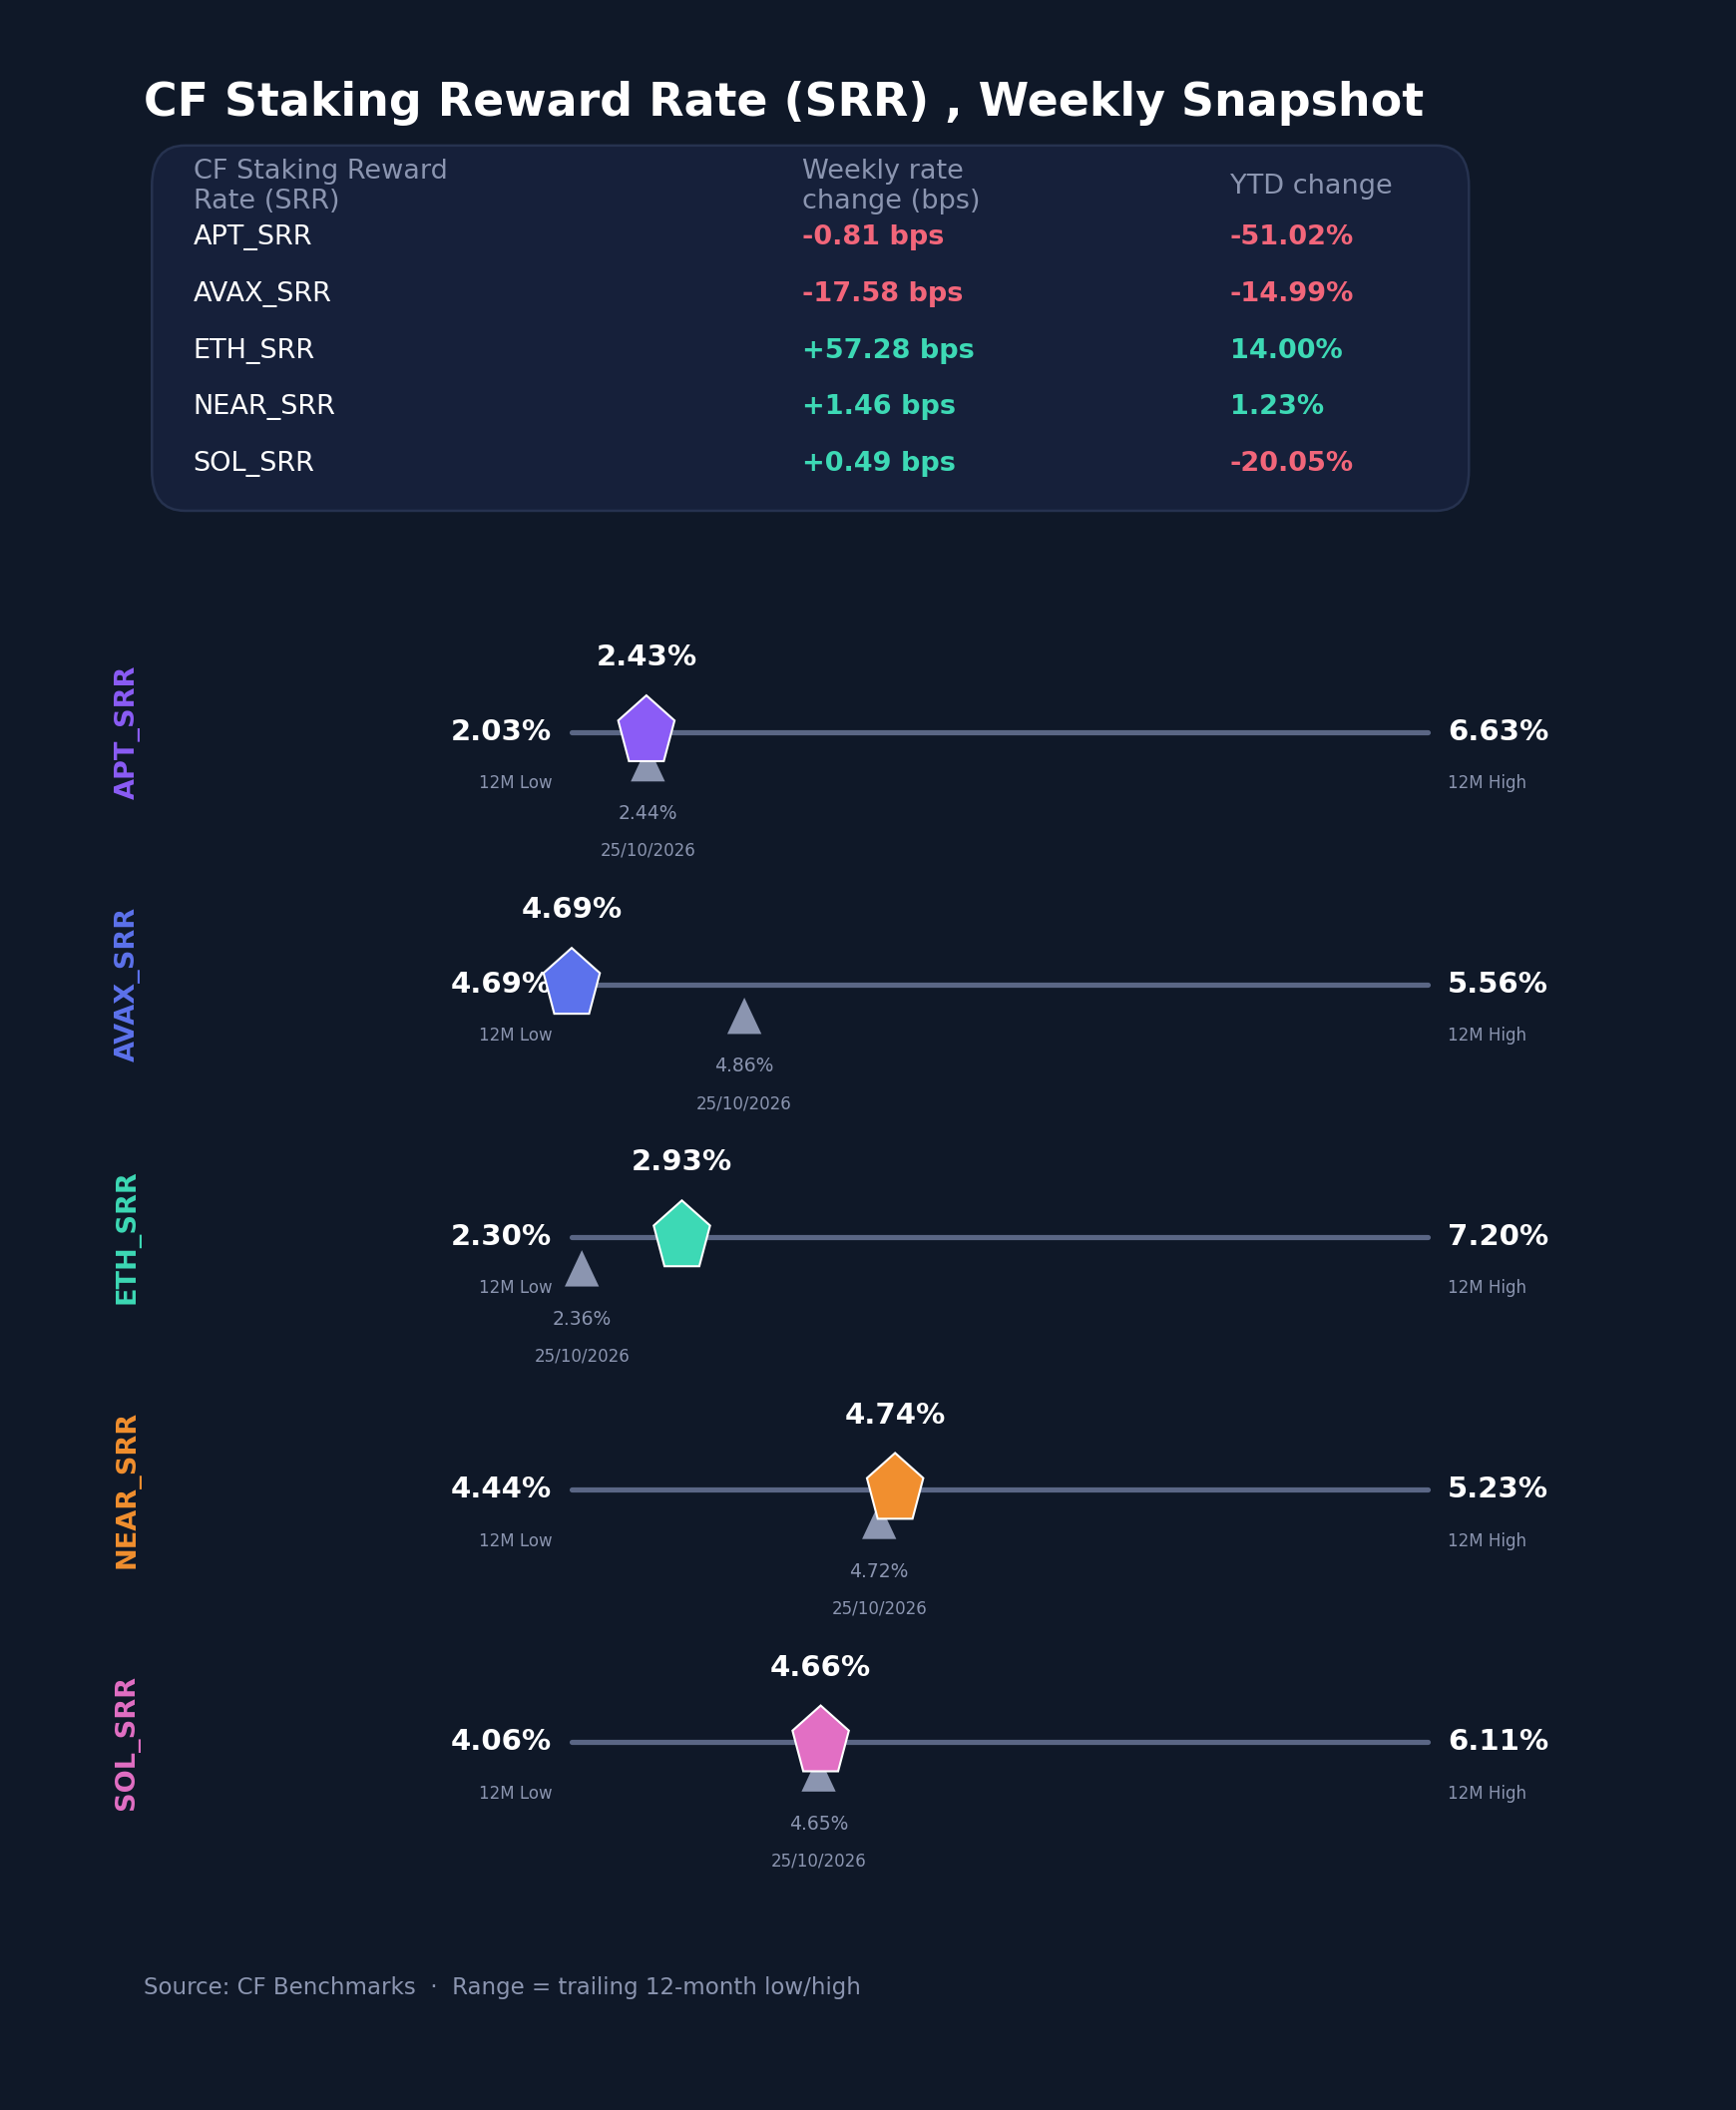
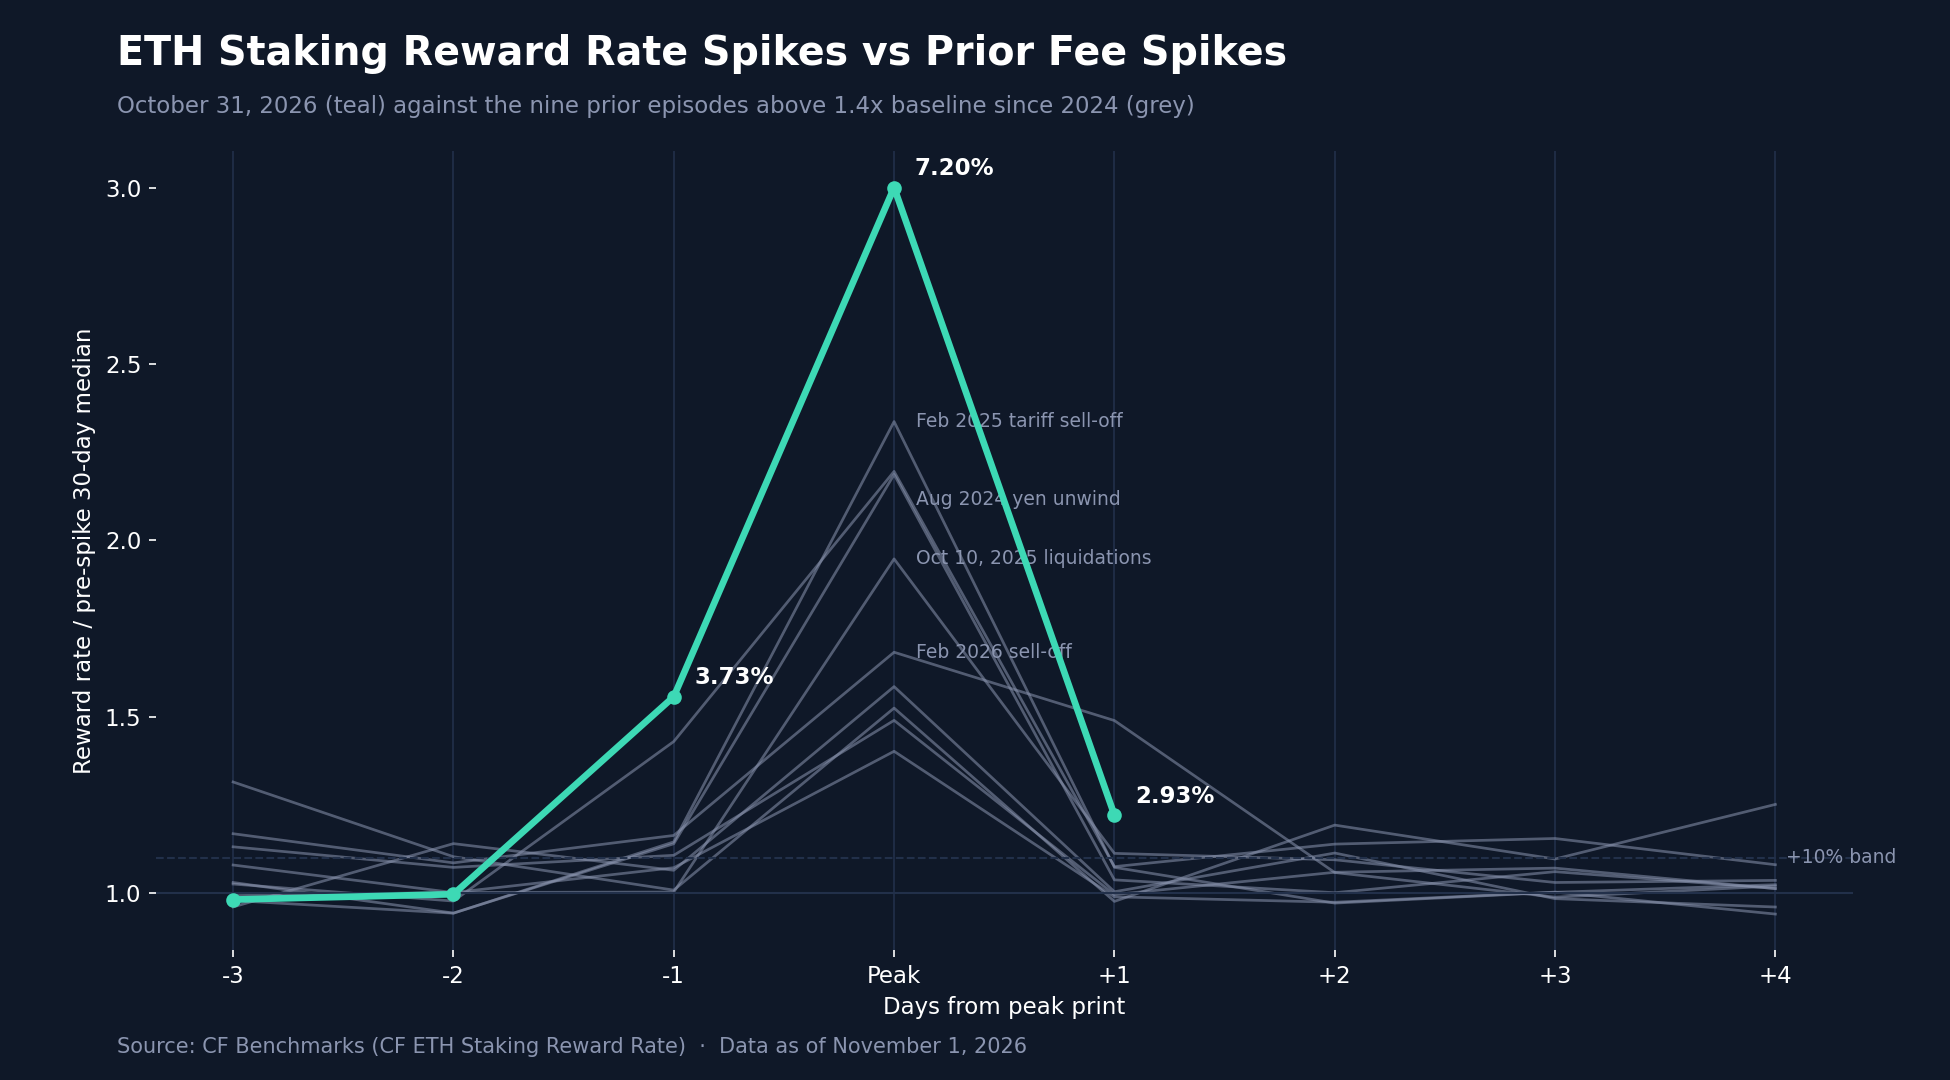
The CF Staking Series was dominated by ETH. The ETH reward rate rose 57.3 basis points (bps) on the week, from 2.3554% to 2.9282%, a 24.32% relative index gain, after printing 7.1988% on October 31st, the highest reading in the series' available history since November 2023 and three times its 2.40% pre-spike 30-day median. The rate tracks Ethereum priority fees with a one-day lag (correlation 0.87), and the spike followed the movement of the stolen funds on-chain. As the attacker swept Binance hot wallets and swapped stablecoins into ETH from 20:05 UTC on October 29th, the base fee peaked near 253 gwei and priority fees paid to validators rose to 1,347 ETH that day and 1,794 ETH on October 30th, against roughly 85 to 92 ETH a day earlier in the week, with arbitrage and sandwich bots trading around the swaps paying most of them. The base fee is burned rather than paid to stakers, which is why the October 30th's elevated priority fees, rather than October 29th's higher total fees, produced the peak. Against history, the move stands apart: the nine prior fee-driven episodes since 2024 peaked between 1.40 and 2.33 times baseline, and seven were back within 10% of baseline on the next print. The two largest prior fee shocks, the October 10th, 2025 liquidation cascade and the February 2026 sell-off, took two days. One print after the peak, the ETH rate has retraced 89% of the spike but remains 22% above baseline, consistent with the two-day pattern of larger shocks. User withdrawals after Binance reopened on November 1st did not lift fees, which held near their lows for the fortnight. Elsewhere, reward rates rose 1.5 bps for NEAR, from 4.7250% to 4.7396%, and 0.5 bps for SOL, from 4.6518% to 4.6567%, while APT slipped 0.8 bps to 2.4308% and AVAX fell 17.6 bps, from 4.8618% to 4.6860%, a new 12-month low for a second week. Across the set, reward rates ranged from APT's 2.4308% to NEAR's 4.7396%, a 2.31pp spread. YTD, the ETH rate index is up 14.00% and NEAR 1.23%.
Bitcoin Basis Analysis
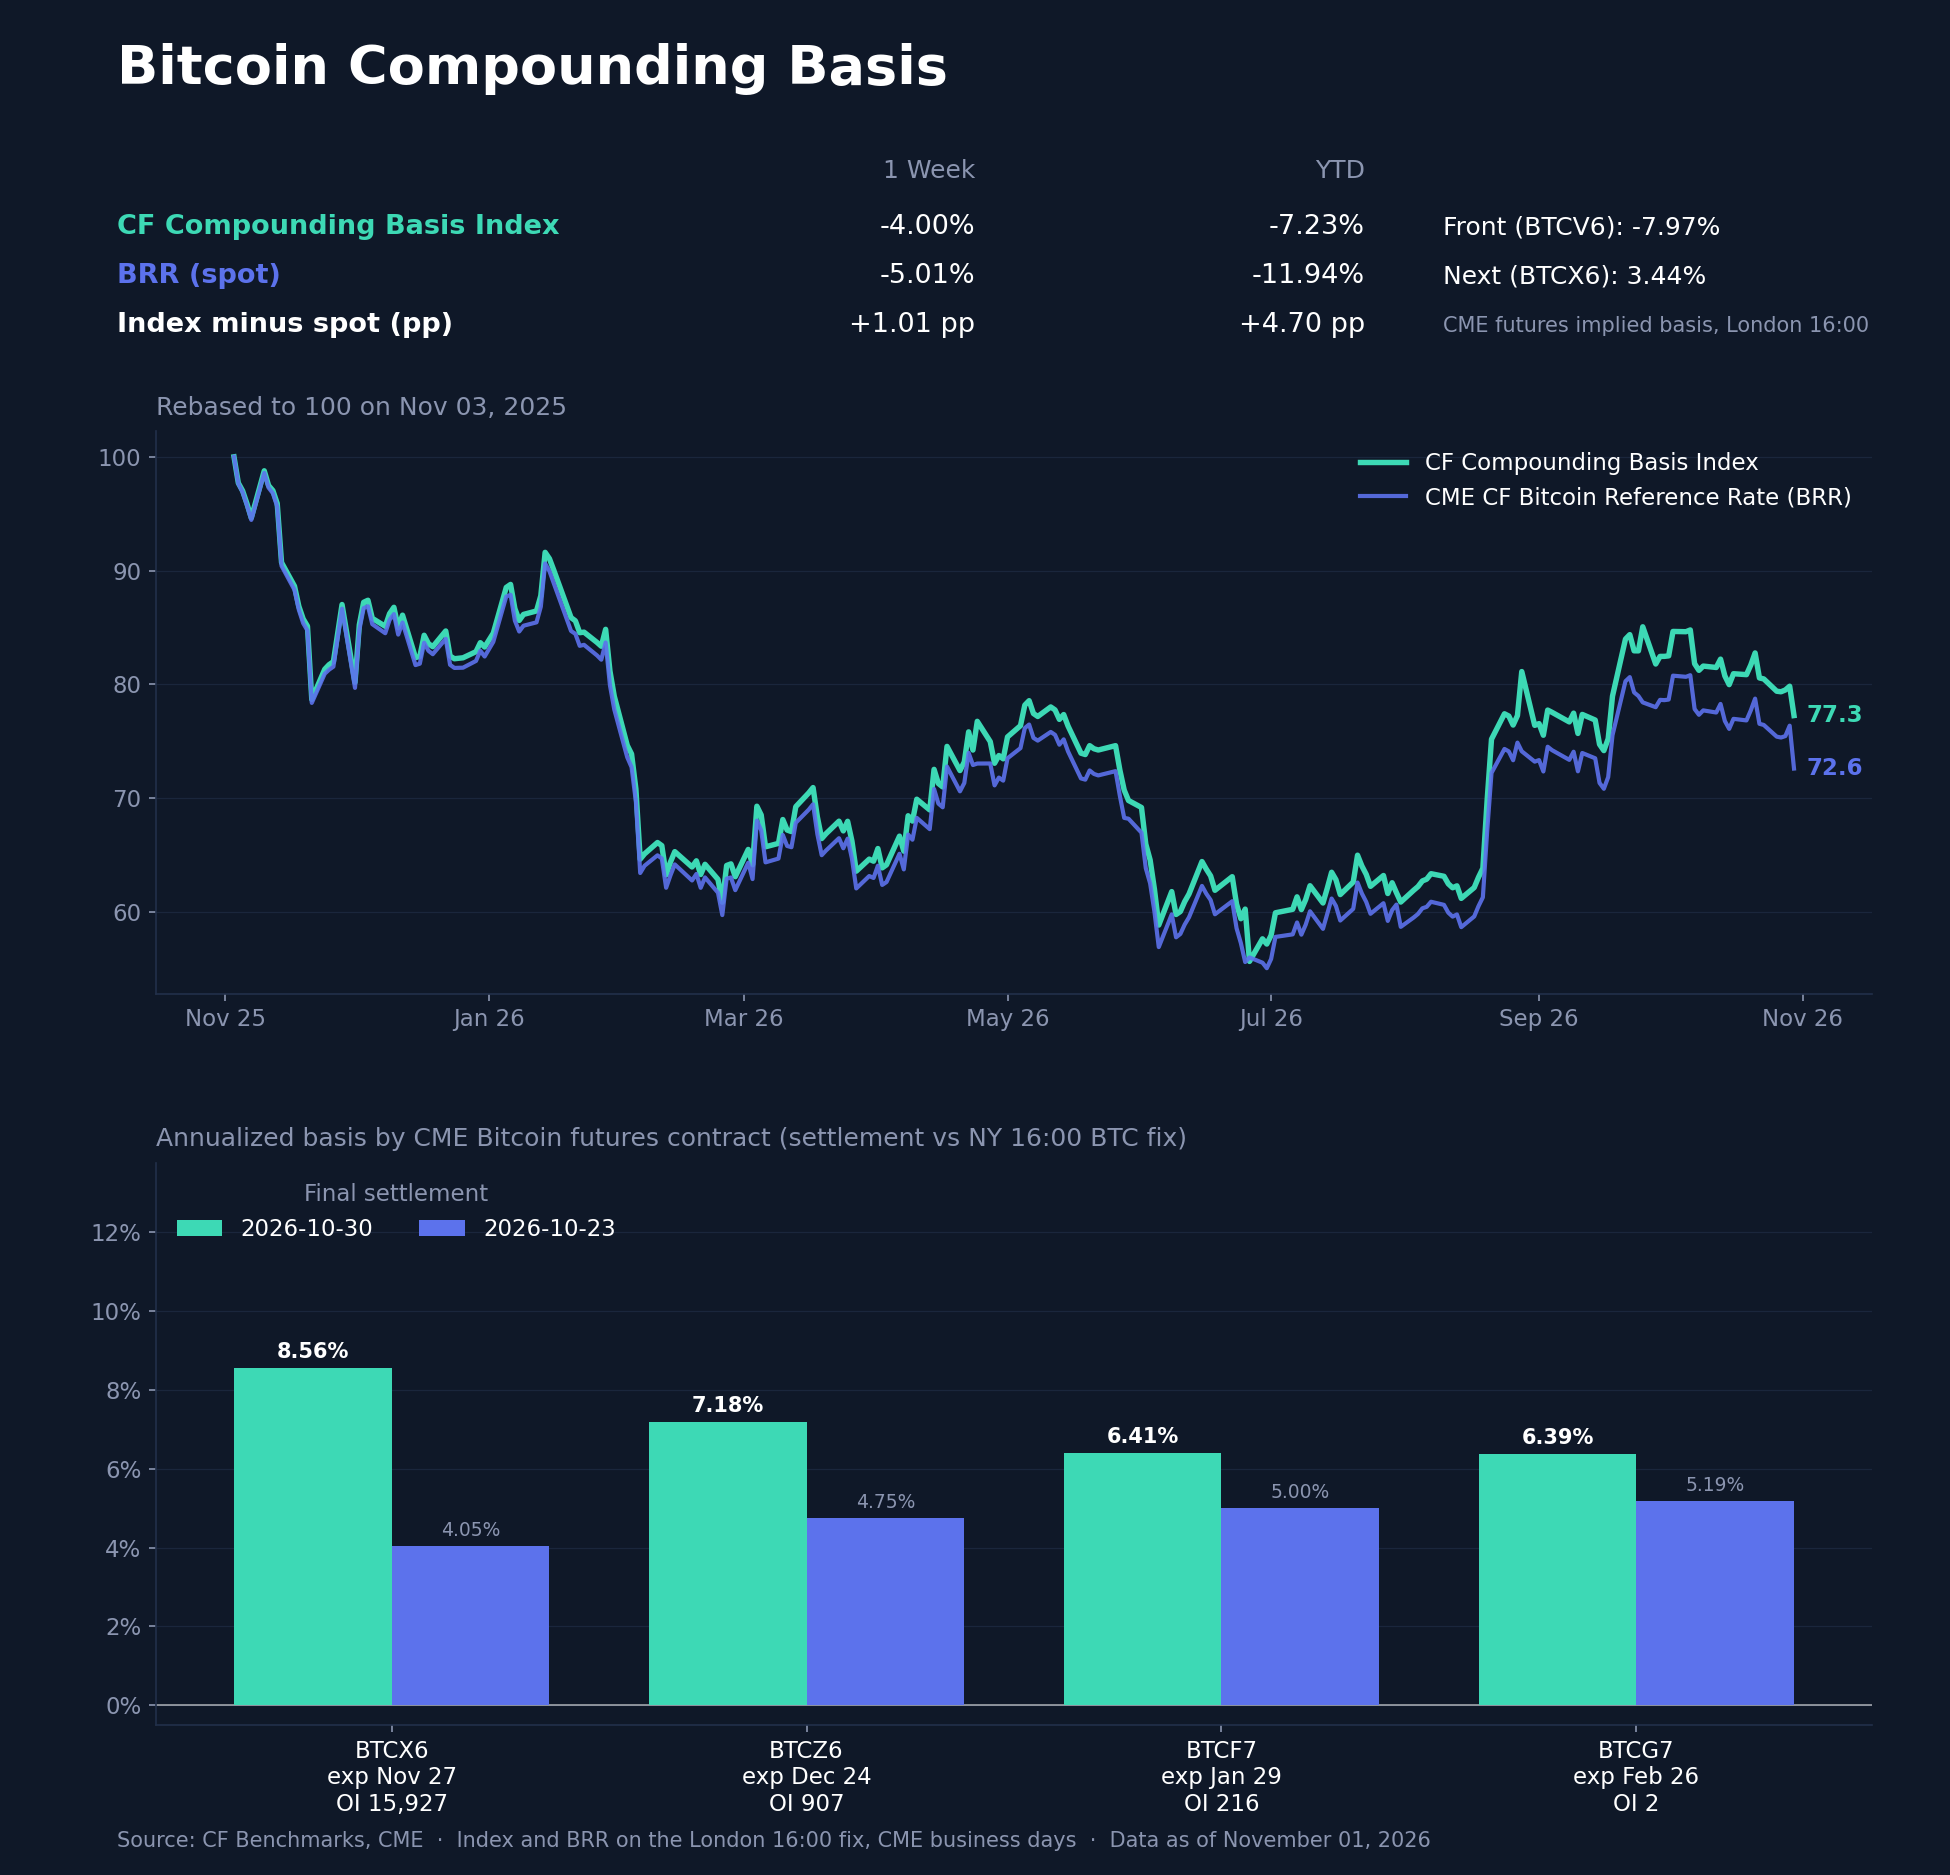
The Bitcoin basis widened as spot fell. The CF Compounding Basis Index fell 4.00% from October 23rd to October 30th against a 5.01% decline in the CME CF Bitcoin Reference Rate (BRR), so carry added 1.01pp over spot, and it leads spot by 4.70pp YTD; both print on the London 16:00 fix, so Friday's print captures the hack but is not compared with the New York close used elsewhere. October's contract (BTCV6) expired on Friday, leaving November (BTCX6), with 15,927 contracts of open interest, as the front. At Friday's settlement, annualized basis rose on every listed CME contract: November to 8.56% from 4.05%, up 452 bps, December (BTCZ6) to 7.18% from 4.75%, January (BTCF7) to 6.41% from 5.00% and February (BTCG7) to 6.39% from 5.19%. The curve now slopes down from the front, the reverse of a week earlier. Futures held a richer premium as spot sold off, consistent with demand for regulated exposure holding up through the exchange-specific shock rather than unwinding with spot.
Closing Synthesis
A modest post-FOMC drift lower became a sharp decline once the Binance outflows began minutes after Thursday's close. The CME CF Crypto Market Index fell 5.12% on Friday, with BNB and SOL the hardest hit, while HYPE, lifted by the ICE announcement on Thursday, was the main offset over the week. The movement of the stolen funds left a clear on-chain footprint: the highest daily Ethereum fees since our tracking began in February, which carried the CF ETH staking reward rate to a series high before it retraced most of the move within a day, Uniswap's busiest Ethereum day of the year, and a protocol-wide Aave freeze, with stablecoin borrow rates on its main Ethereum market pinned at a new 10% cap. Implied volatility repriced higher over the weekend without a jump in crash protection, and CME basis widened across the curve, so the market absorbed the largest theft on record with lower prices but without signs of disorderly deleveraging.
The information contained within is for educational and informational purposes ONLY. It is not intended nor should it be considered an invitation or inducement to buy or sell any of the underlying instruments cited including but not limited to cryptoassets, financial instruments or any instruments that reference any index provided by CF Benchmarks Ltd. This communication is not intended to persuade or incite you to buy or sell security or securities noted within. Any commentary provided is the opinion of the author and should not be considered a personalised recommendation. Please contact your financial adviser or professional before making an investment decision.
Note: Some of the underlying instruments cited within this material may be restricted to certain customer categories in certain jurisdictions.
Binance Hack Turns a Post-FOMC Drift Lower Into a Sharp Decline
Digital assets gave back ground over the past week as the Binance hack, not macro, set the tape. Losses were broad, led by exchange-linked and high-beta names, while Hyperliquid stood apart. Defensive factors led, implied volatility repriced higher, CME basis widened and ETH staking rewards spiked.

Mark Pilipczuk
Factor Friday - October 30, 2026
Less liquid tokens led CF Benchmarks' factor table as Liquidity gained 1.54% after last week's loss, ending Size's four-week run at the top. Growth fell 2.39% to rank last, while Size, down 0.79% on the week, still leads year to date at 22.76%.
Mark Pilipczuk
How CF Benchmarks treats a Bitcoin hard fork: the ECX case
Published thresholds, applied to observed trading, decide whether a new coin earns an index of its own or counts as a distribution in multi-asset indices. The eCash (ECX) fork around 31 October is a live test of both.
Mark Pilipczuk
By clicking Accept, you consent to CF Benchmarks's use of cookies.
Visit Cookie Settings to learn how CF Benchmarks uses cookies and to adjust your preferences.