
Nov 25, 2024
Weekly Index Highlights, November 25, 2024
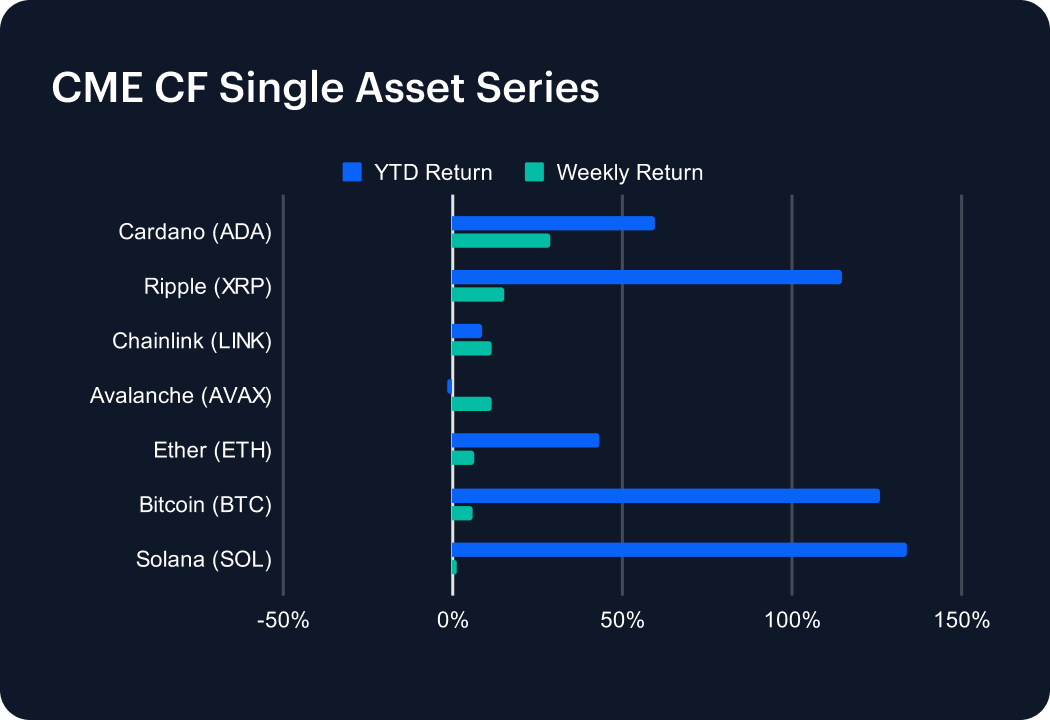
A banner week saw Bitcoin flirt with the symbolic $100,000 handle, but ironically equated to relatively modest progress for many mega and large cap token indices, amid evidence of increasing wariness over remaining momentum. Bitcoin added a moderate weekly +5.87%, taking 2nd place on a year-to-date (YTD) basis in this series, +126.15%. That compares to the biggest YTD outperformer, Solana (SOL), +133.77%, after it inched up just +1.36% for the week. Cardano (ADA) was weekly series outperformer, rising +28.86%; extending its YTD gain to +59.76%, as odds for its mainstream integration (via ETFs, etc.) shortened on news of SEC chair Gary Gensler’s confirmed exit.
This was a further consecutive week of solid average gains across key sub-categories (e.g., DeFi +11.10%, Culture +9.97%, Infrastructure +12.45%) and another sizable advance for Non-Programmable protocols, +24.19% on average. The latter were driven by a second weekly parabolic surge for Stellar (XLM), +84.64%, as unconfirmed reports emerged that XLM (and potentially XRP) were under consideration as part of a blockchain pilot of the Federal Reserve’s FedNow instant payment infrastructure. Polkadot’s (DOT) +45.03% outperformance of the Programmable sub-category, accompanied by Cosmos (ATOM), +32.09%, and others, propelled the General Purpose Smart Contract Platforms segment to a second straight weekly advance, this time of 15.38%, on average.
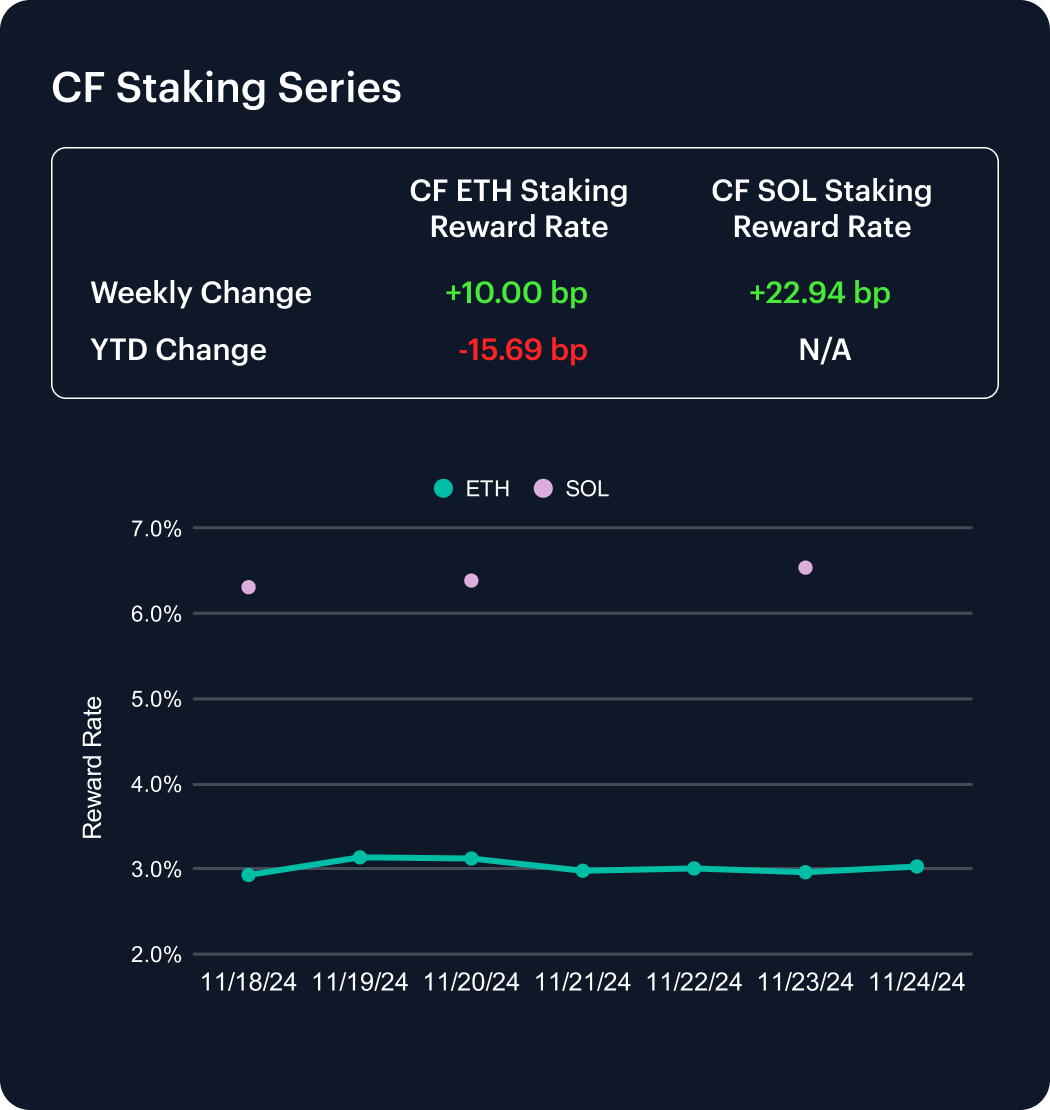
Modest week-on-week increases in our two staking reward rates were seen, with a +10 basis points (bp) change for the CF ETH Staking Reward Rate Index (ETH_SRR), and +22.94 bp for the CF SOL Staking Reward Rate Index (SOL_SRR). ETH_SRR has notably yet to flip definitively positive for the year, as that change still lags by -15.69 bp. Backtested values for our recently incepted SOL_SRR may be examined on the CF Benchmarks CF Staking Series product page, here. The chart there suggests this index has slipped -13.12% since early March 2024.
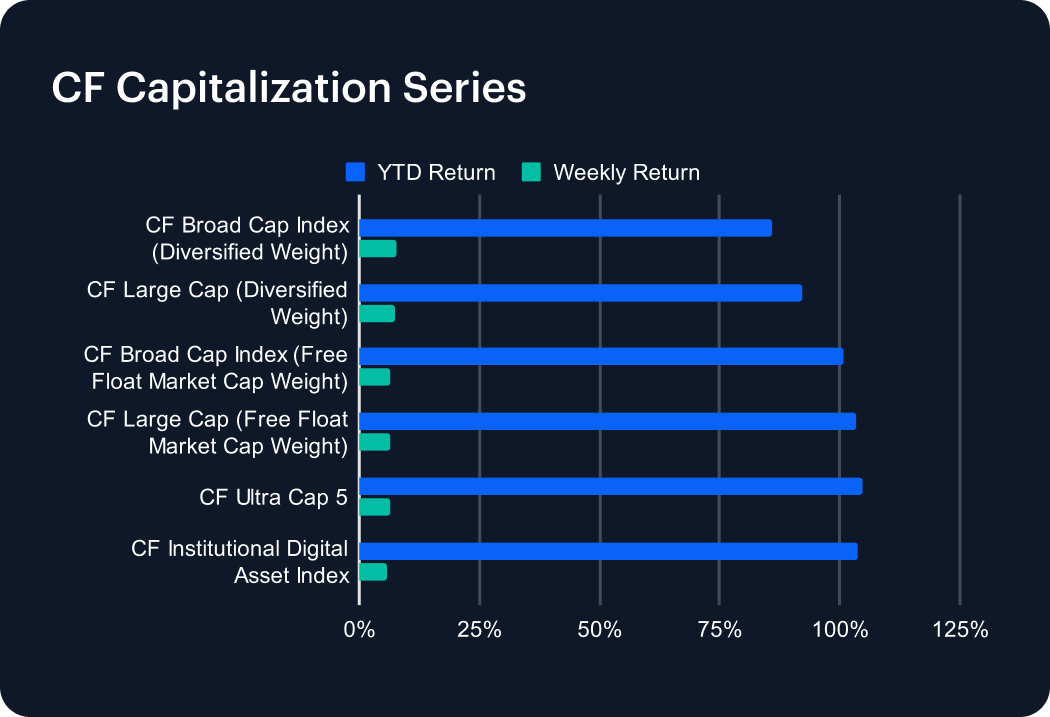
Indices measuring crypto’s highest capitalized beta advanced modestly across the board for a further week with, again, only nominal differentials between gains. Relative outperformer: CF Broad Cap Index (Diversified Weight), +7.81%. Relative underperformer: CF Institutional Digital Asset Index, +5.62%. Year-to-date (YTD) progress of individual indices within the series is of more interest. For instance, so far, a portfolio of the five largest cryptoassets by market capitalization, AKA the CF Ultra Cap 5, up +104.83%, has outshone all others in the series, narrowly topping the aggregate YTD return of Bitcoin and Ether (structured as the CF Institutional Digital Asset Index) +103.65%; and the CF Large Cap (Free Float Market Cap Weight) index, +103.43%.
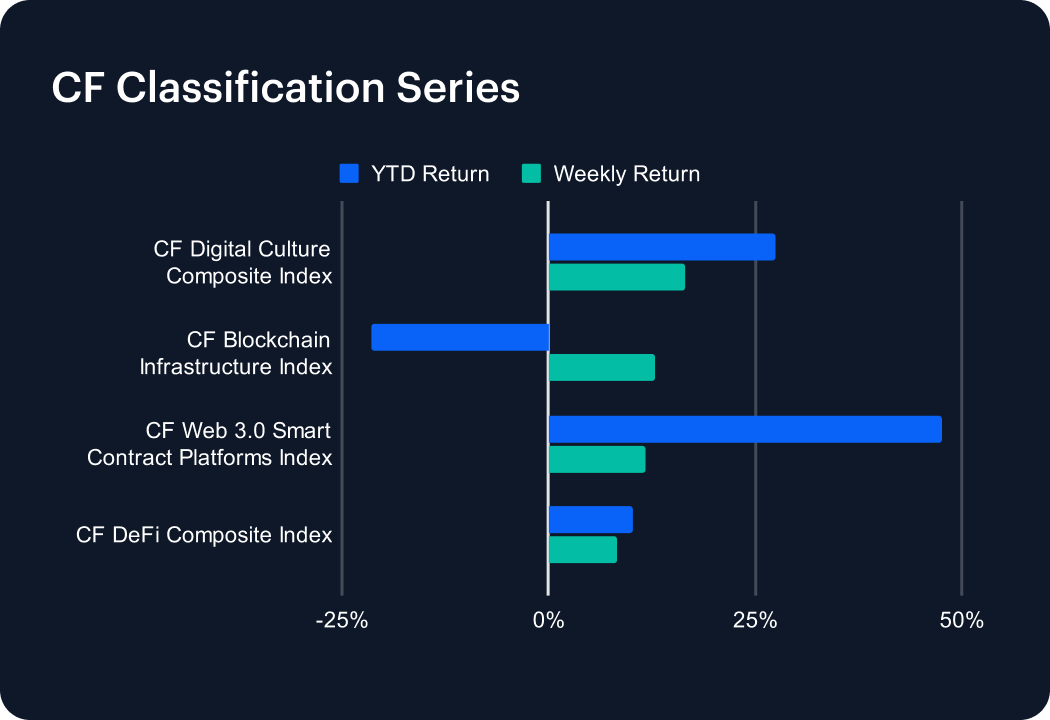
The CF Digital Culture Composite Index’s +16.49% week-on-week jump was assisted by the re-emergence of Gaming segment strength, as the recent meme coin semi craze appeared to largely fizzle out. Meanwhile, the CF Blockchain Infrastructure Index’s +12.93% progress still has a way to go to erase its -21.50% YTD decline. The CF Web 3.0 Smart Contract Platforms Index added +11.80% for the week (see the CF DACS section for more detail) confirming that index’s YTD series outperformance, +47.53%.
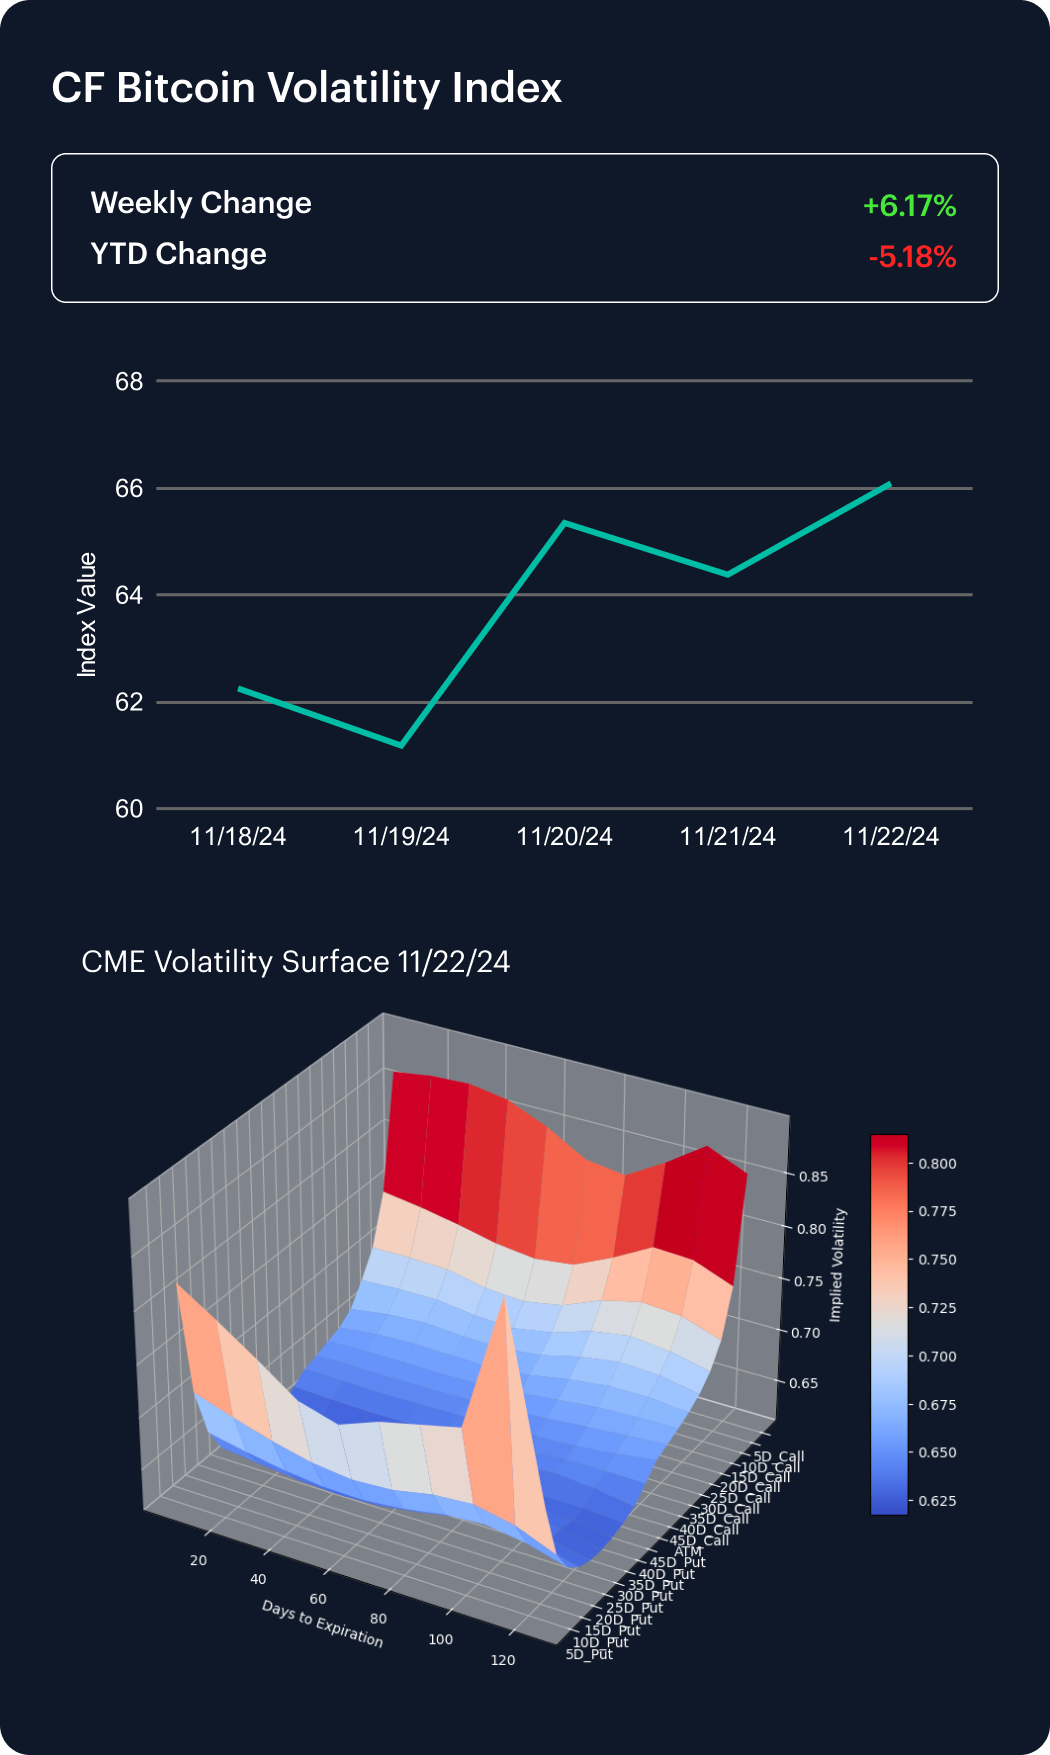
CME Bitcoin implied volatility drifted mildly higher for a second week, with the CF Bitcoin Volatility Index Settlement Rate’s (BVXS) weekly change +6.17%. This means the year-to-date performance is again approaching a balanced state, as that change has narrowed to -5.18%.
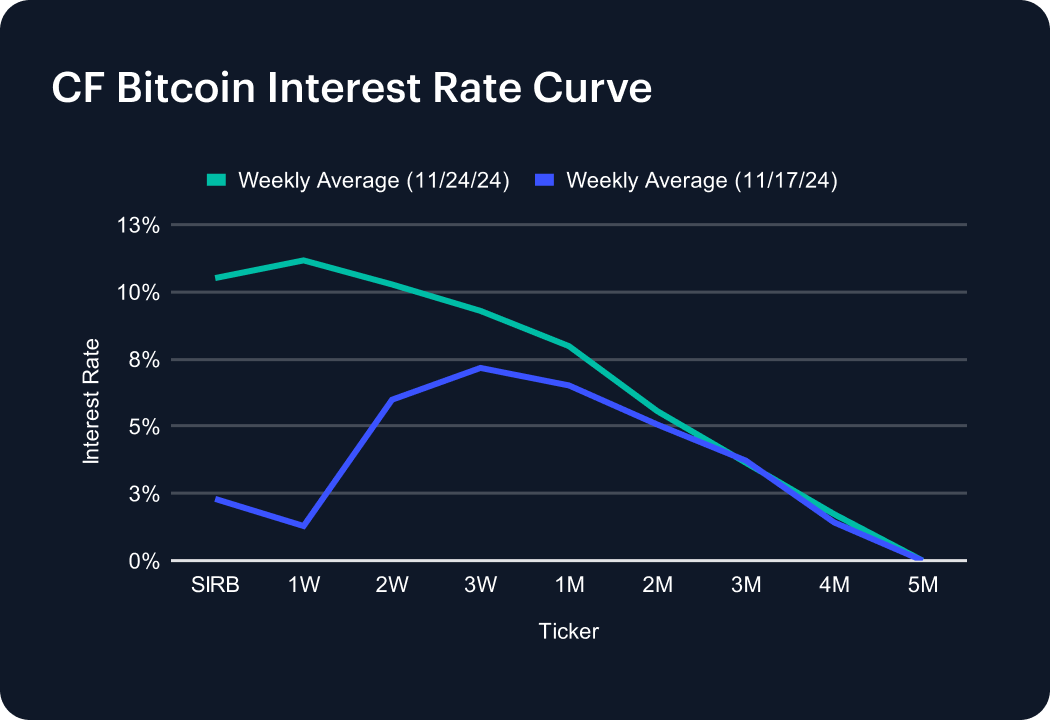
The week saw inferable activity increasing at the short end, up to the middle of the CF Bitcoin Interest Rate Curve term structure. Still, note the 1-week rate moved quicker than the session rate. The former ticked up by around 10 percentage points to approximately 11.2%, while the latter rose about 8.2 points forward to 10.5%. An approximately 4.3 percentage point move at the 2-week tenor brought it relatively in line with the above, leaving it close to 10.3%. Any gains across the rest of the curve were milder from the 3-week onwards, as that rate edged up ~2.1 percentage points to 9.3%, and the 1-month tenor moved up about 1.4 of a point to circa 7.9%. Rates were largely static at the longer end: the 3-month ended the week near 3.7%, the 4-month at 1.4%, whilst the 5-month closed a fourth week with a zero reading. |
The information contained within is for educational and informational purposes ONLY. It is not intended nor should it be considered an invitation or inducement to buy or sell any of the underlying instruments cited including but not limited to cryptoassets, financial instruments or any instruments that reference any index provided by CF Benchmarks Ltd. This communication is not intended to persuade or incite you to buy or sell security or securities noted within. Any commentary provided is the opinion of the author and should not be considered a personalised recommendation. Please contact your financial adviser or professional before making an investment decision.
Note: Some of the underlying instruments cited within this material may be restricted to certain customer categories in certain jurisdictions.
Changes to the Token Market Price Benchmarks Series - Market Prices – 21 July 2026
The Administrator has confirmed changes to the Token Market Price Family for the period 14 July 2026 to 21 July 2026.

CF Benchmarks
Softer CPI Reprices July Hike Risk & Lifts Digital Assets
Digital assets extended their recovery over the past week as cooler US inflation prints repriced Fed expectations; the bid was broad across the large cap indices, growth factor leadership returned, stablecoin funding repriced lower, and stress stayed isolated in names hit by token-specific news.
Mark Pilipczuk
Notice of the Demising of CF Dai-Dollar Settlement Price and Spot Rate
The Administrator announces that it will demise the CF Dai-Dollar Settlement Price (DAIUSD_RR) and CF Dai-Dollar Spot Rate (DAIUSD_RTI) which are members of the CF Digital Asset Index Family.
CF Benchmarks
By clicking Accept, you consent to CF Benchmarks's use of cookies.
Visit Cookie Settings to learn how CF Benchmarks uses cookies and to adjust your preferences.