
May 06, 2025
Weekly Index Highlights, May 5, 2025
Market Performance Update
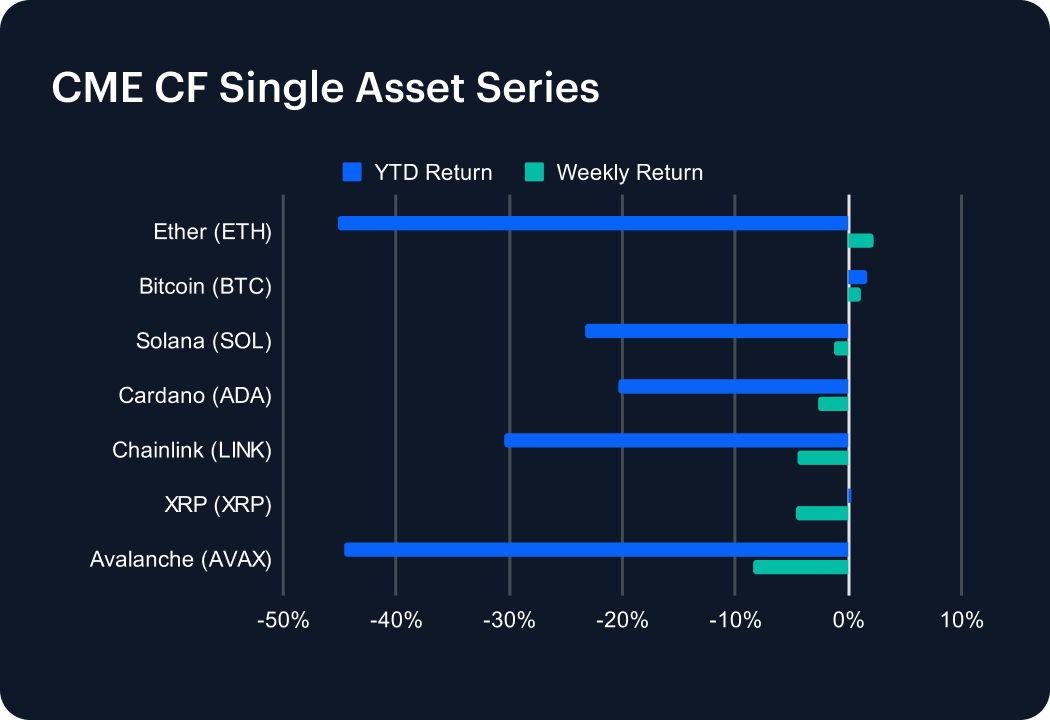
The digital asset market took a breather this week, with most major tokens posting declines following recent gains. Avalanche (AVAX) led losses, dropping 8.44% to deepen its year-to-date (YTD) decline to -44.64%. Chainlink (LINK) and XRP (XRP) followed, falling 4.49% and 4.72%, bringing their YTD returns to -30.38% and 0.27%, respectively. Cardano (ADA) slipped 2.68%, now down 20.39% YTD. Solana (SOL) shed 1.27%, increasing its YTD loss to -23.28%. Ether (ETH) managed a modest 2.19% gain, slightly improving its YTD return to -45.17%. Bitcoin (BTC) continued to outperform, edging up 1.04% to reach a 1.67% YTD gain. After a strong rally, sentiment cooled, suggesting investors may be reassessing risk amid broader market uncertainty.
Sector Analysis
Digital asset performance skewed negative this week, with few standouts amid widespread weakness. In Trading, BAL led with a 12.63% gain, while SUSHI (-10.18%) and LRC (-9.53%) dragged. Asset & Wealth Management names like YFI (-12.56%) and LDO (-4.71%) underperformed. The Culture sub-category exhibited broad weakness—GALA (-9.01%) and APE (-6.98%)—with only PRIME (+7.96%) showing strength. Meme Coins reversed some of last week’s gains, as BONK (-17.71%) and WIF (-11.24%) tumbled. SDK & Tooling suffered with BICO down 12.71%. Infrastructure tokens were similarly weak; STX slid 8.64%, while OP
dropped 12.60%. One bright spot was QNT (+13.53%) in the Interoperability segment. Among smart contract platforms, SUI plunged 10.50%. Overall, sellers regained control as category-wide losses signaled risk-off sentiment.
Staking Metrics
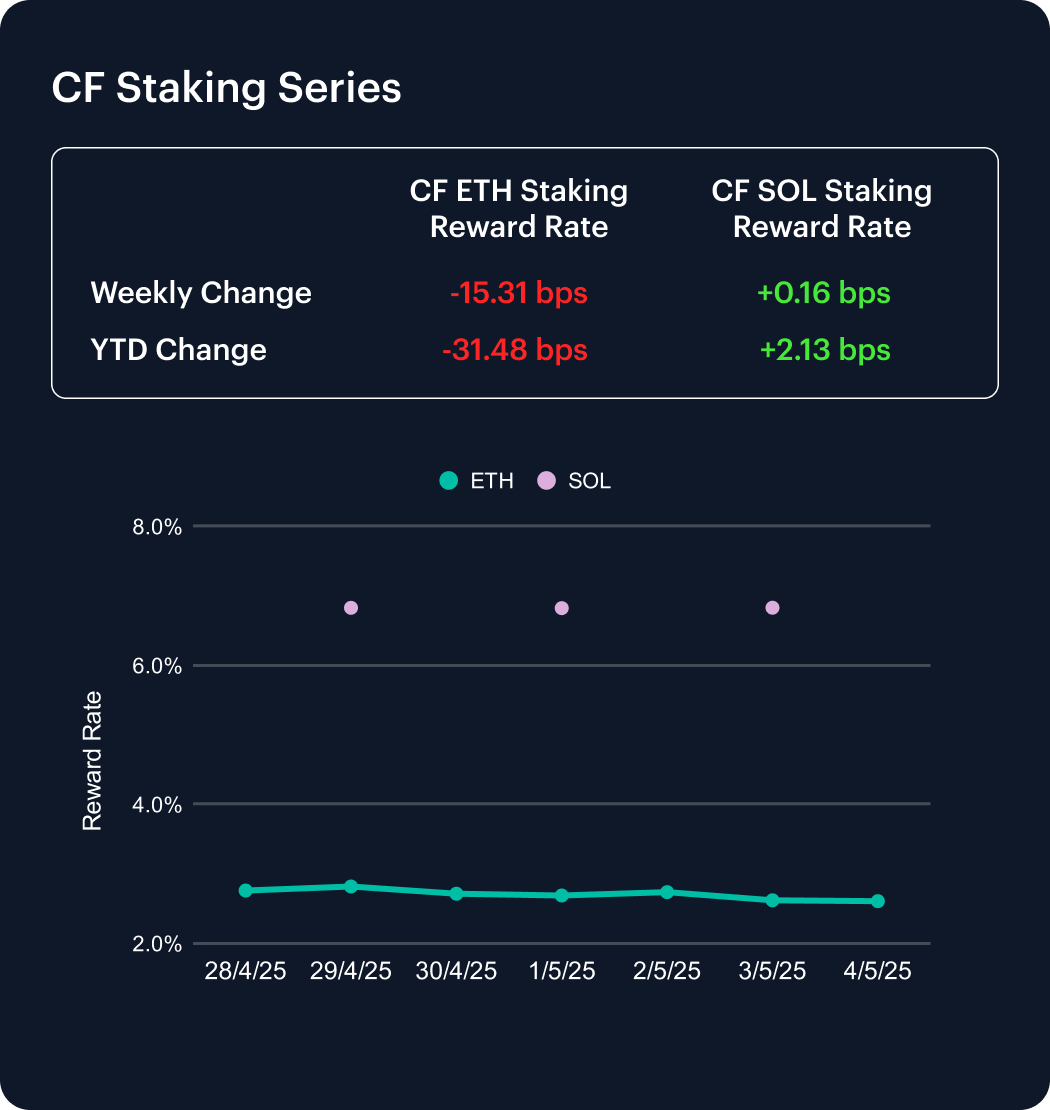
The CF Ether Staking Reward Rate Index (ETH_SRR) declined sharply this week, dropping 15.31 basis points to 2.61%, a 5.54% weekly decrease. Year-to-date, ETH_SRR has fallen 31.48 bps from 2.92%, marking a 10.77% cumulative decline and signaling sustained downward pressure on Ethereum staking yields.
In contrast, the CF SOL Staking Reward Rate Index (SOL_SRR) edged up 0.16 bps to 6.83%, essentially flat on the week with a 0.02% gain. Year-to-date, SOL_SRR has risen 2.13 bps, or 0.31%. The widening gap reflects Ethereum’s continued reward compression versus Solana’s comparatively stable and more resilient staking dynamics.
Market Cap Index Performance
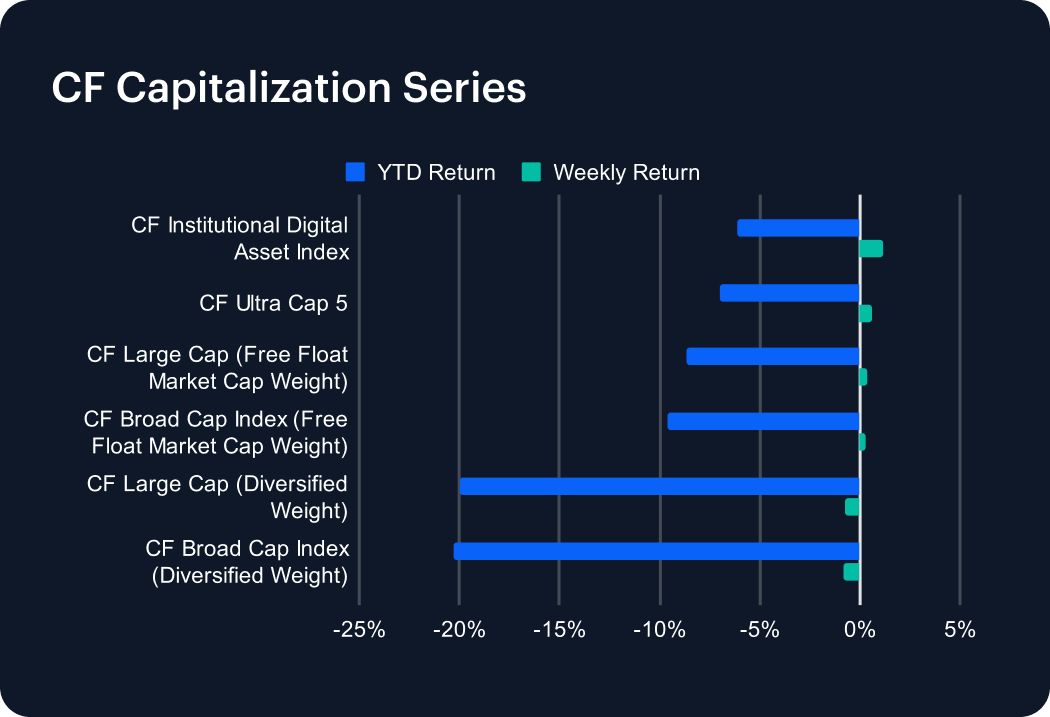
The CF Capitalization Series ended the week mixed, with modest gains in free-float market cap-weighted indices offset by declines in diversified-weighted benchmarks. The CF Institutional Digital Asset Index led, rising 1.15%, followed by the CF Ultra Cap 5, which gained 0.62%. The CF Large Cap and CF Broad Cap indices (free-float weighted) posted smaller advances of 0.38% and 0.30%, respectively, helping trim their year-to-date (YTD) losses to -8.66% and -9.62%. In contrast, diversified-weighted indices slipped, with the CF Large Cap down 0.76% and the CF Broad Cap falling 0.83%, extending their YTD declines to -19.96% and -20.29%. The divergence suggests renewed investor preference for large-cap tokens, with less support for smaller-cap assets this week.
Classification Series Analysis
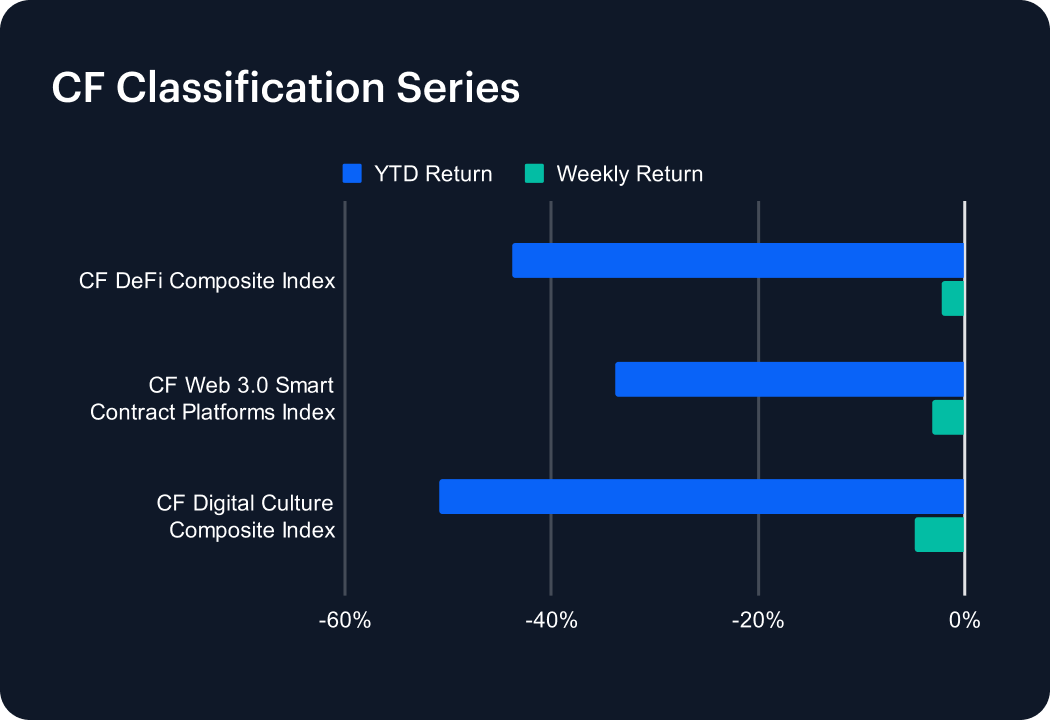
The CF Classification Series Indices declined this week, underperforming the broader market as key thematic indicies lost ground. The CF Web 3.0 Smart Contract Platforms Index fell 3.19%, deepening its year-to-date (YTD) decline to -33.87%. The CF DeFi Composite Index dropped 2.17%, extending its YTD loss to -43.82%. The CF Digital Culture Composite Index was the weakest performer, down 4.78% for the week and now off 50.81% in 2025—making it the worst YTD among the group. The pullback underscores persistent weakness in smaller-cap and speculative segments, even as broader market sentiment attempts to stabilize. Despite brief rallies in prior weeks, the data reflect ongoing investor caution in high-volatility, theme-driven areas of the digital asset landscape.
Volatility
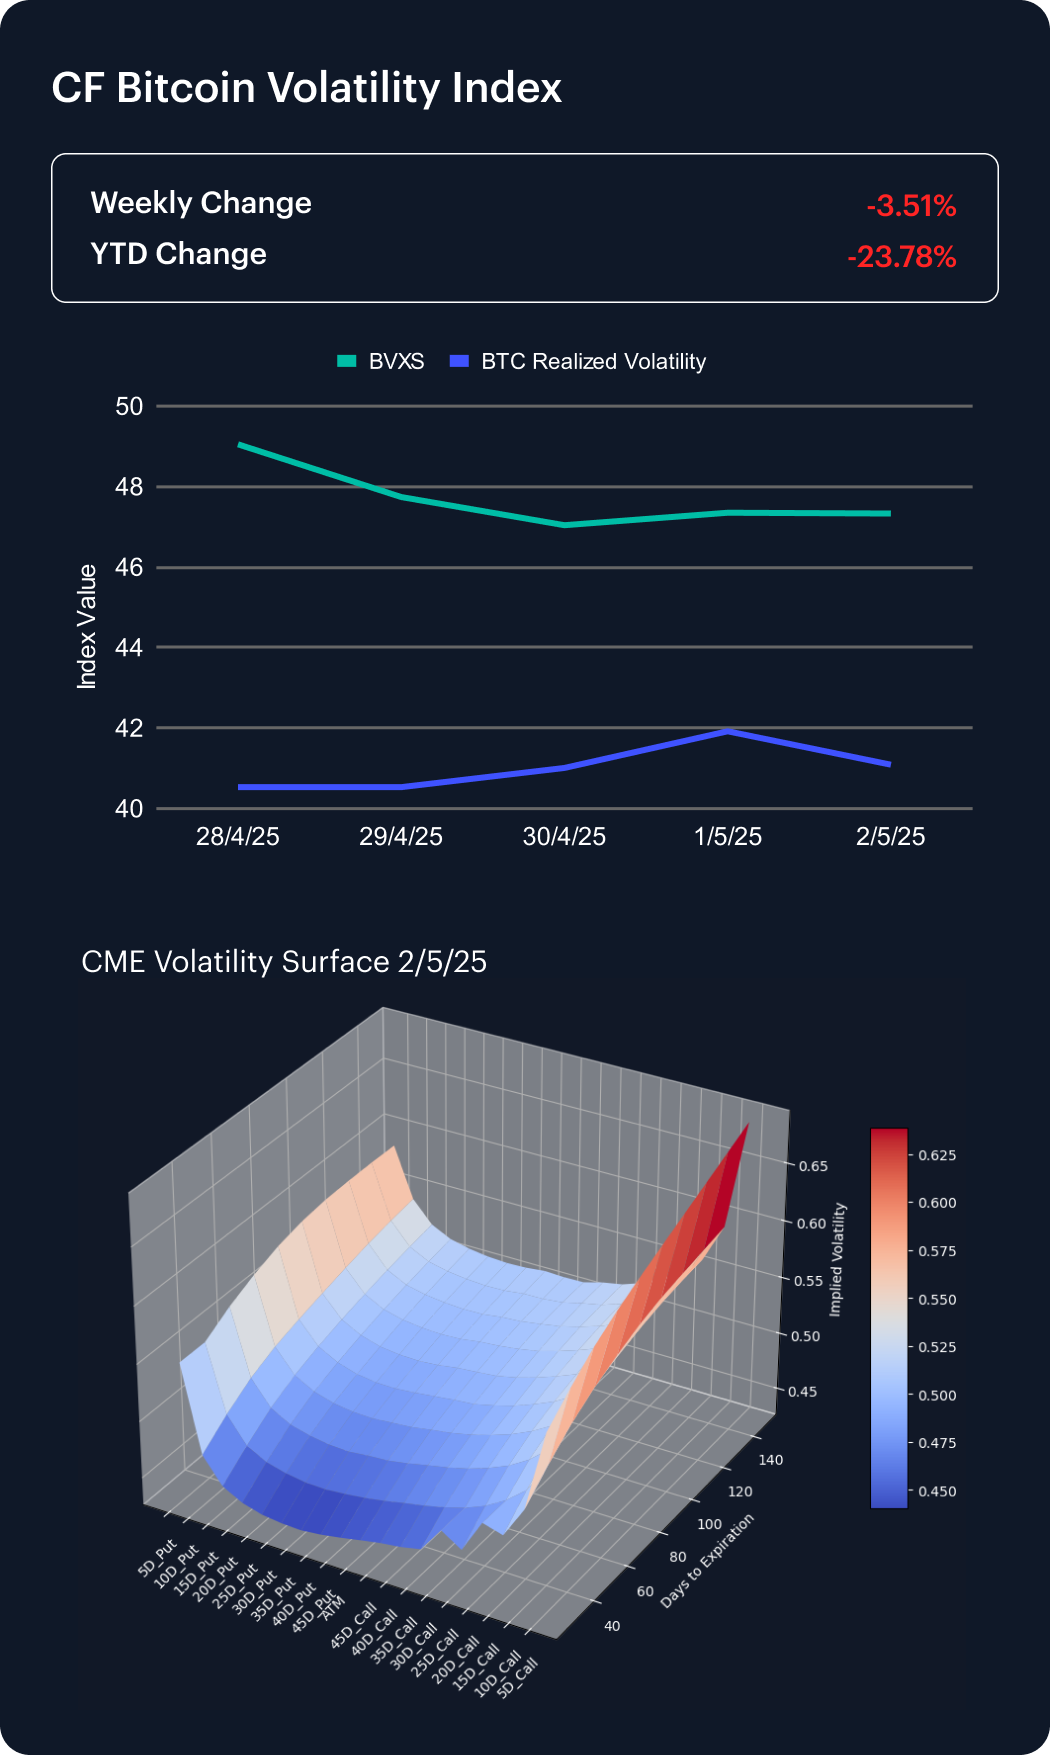
The CF Bitcoin Volatility Index Settlement Rate (BVXS) declined 3.51% over the past week, settling at 47.33 and bringing its year-to-date drop to 23.78%. This continued decrease in implied volatility reflects ongoing moderation in demand for option exposure. Meanwhile, realized volatility rose modestly, climbing from 40.53 to 41.09, suggesting slightly more pronounced short-term price fluctuations.
CME Bitcoin Volatility Surface data continues to show persistent positive skew across the 10, 15, 20, and 25 delta points, with increased convexity along the curve. Notably, implied volatility in long-dated 5-delta calls has ticked higher, signaling renewed investor interest in asymmetric upside exposure and positioning for potential breakout scenarios despite generally subdued volatility levels.
Interest Rate Analysis
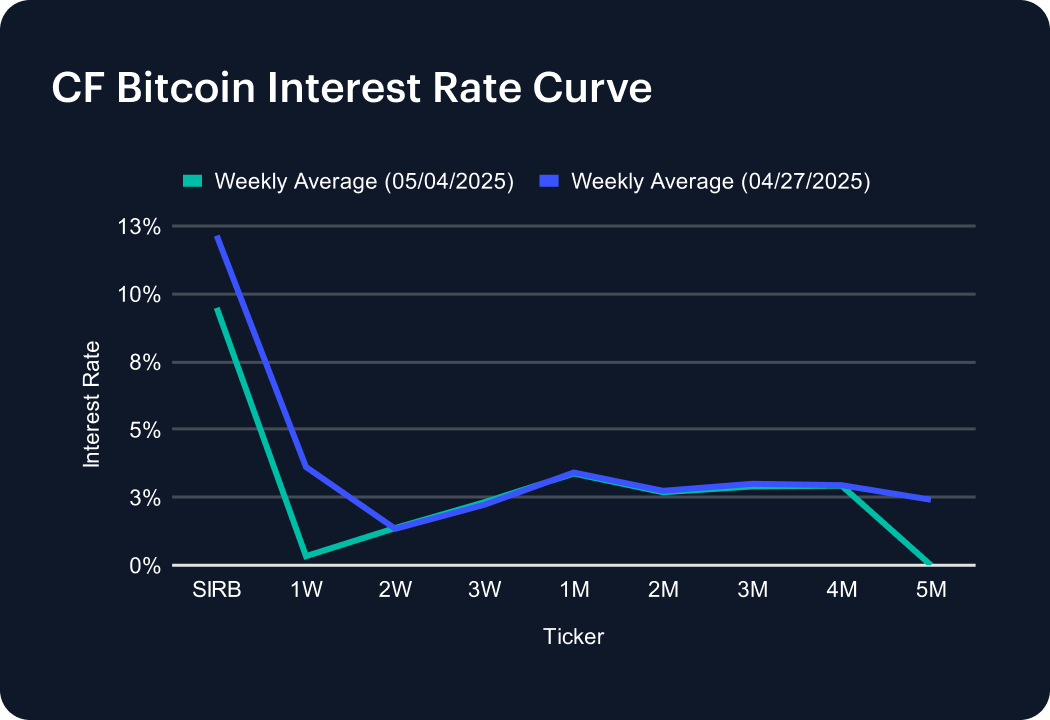
The CF Bitcoin Interest Rate Curve eased across most tenors this week, reversing last week’s sharp rise. The Short-Term Interest Rate Benchmark (SIRB) dropped to 9.49% from 12.15%, signaling reduced immediate funding pressure. Short-dated tenors also declined, with the 1-week rate plunging to 0.33% from 3.62%. The 2- and 3-week rates held steady near 1.37% and 2.32%, respectively. One-month funding slipped slightly to 3.38%. Mid-curve tenors from 2 to 4 months dipped marginally, while the 5-month rate dropped to 0.00%, possibly due to a lack of trading activity. The broad softening suggests a cooling in near-term leverage demand across crypto markets.
The information contained within is for educational and informational purposes ONLY. It is not intended nor should it be considered an invitation or inducement to buy or sell any of the underlying instruments cited including but not limited to cryptoassets, financial instruments or any instruments that reference any index provided by CF Benchmarks Ltd. This communication is not intended to persuade or incite you to buy or sell security or securities noted within. Any commentary provided is the opinion of the author and should not be considered a personalised recommendation. Please contact your financial adviser or professional before making an investment decision.
Note: Some of the underlying instruments cited within this material may be restricted to certain customer categories in certain jurisdictions.
Changes to the Token Market Price Benchmarks Series - Market Prices – 21 July 2026
The Administrator has confirmed changes to the Token Market Price Family for the period 14 July 2026 to 21 July 2026.

CF Benchmarks
Softer CPI Reprices July Hike Risk & Lifts Digital Assets
Digital assets extended their recovery over the past week as cooler US inflation prints repriced Fed expectations; the bid was broad across the large cap indices, growth factor leadership returned, stablecoin funding repriced lower, and stress stayed isolated in names hit by token-specific news.
Mark Pilipczuk
Notice of the Demising of CF Dai-Dollar Settlement Price and Spot Rate
The Administrator announces that it will demise the CF Dai-Dollar Settlement Price (DAIUSD_RR) and CF Dai-Dollar Spot Rate (DAIUSD_RTI) which are members of the CF Digital Asset Index Family.
CF Benchmarks
By clicking Accept, you consent to CF Benchmarks's use of cookies.
Visit Cookie Settings to learn how CF Benchmarks uses cookies and to adjust your preferences.