
May 18, 2026
Weekly Index Highlights, May, 18, 2026
Market Performance Update
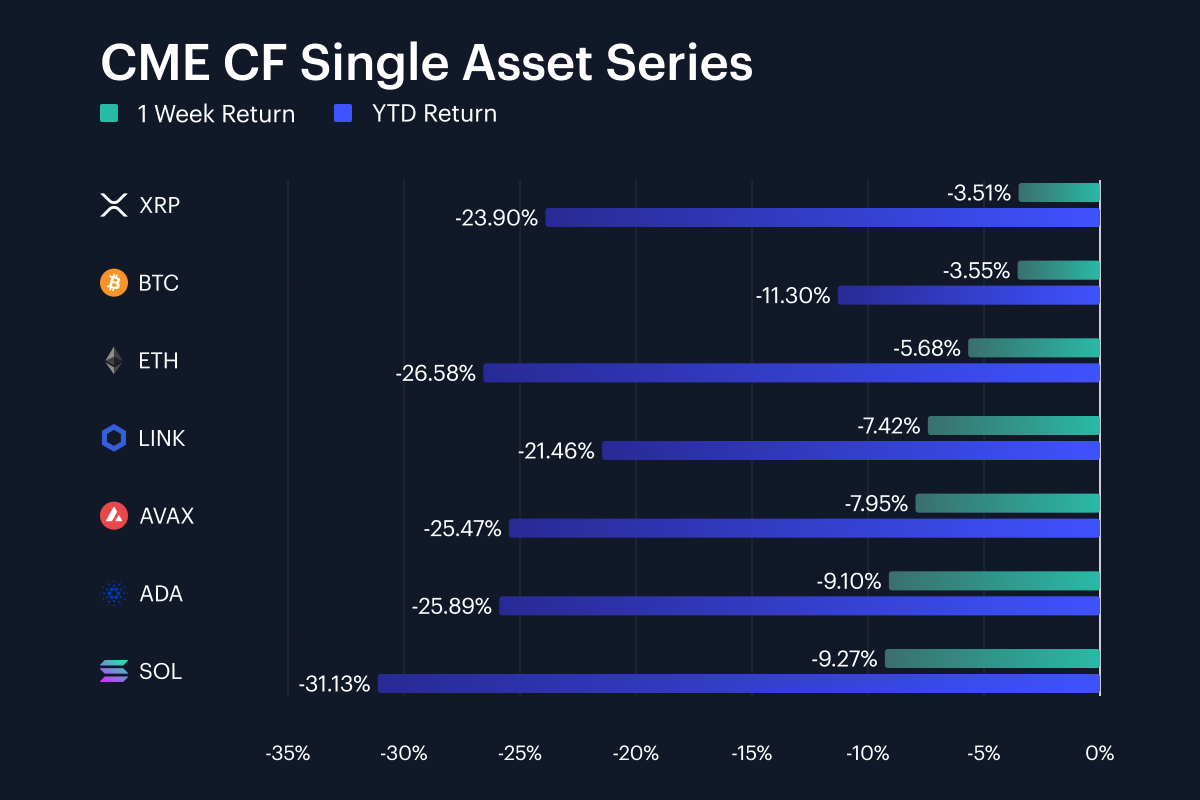
Digital assets reversed a portion of recent gains during the May 10th to May 16th stretch, with Bitcoin sliding 3.6% week-on-week (w/w) leaving it at -11.3% for the year to date (YTD) while Ether declined 5.7% w/w to stand at -26.6% YTD. Most other gauges in the series were weaker still over the same window: Chainlink -7.4%, Avalanche -7.9%, Cardano -9.1% and Solana -9.3%. XRP, lost 3.5%, marginally outperforming BTC. As such, the weekly range between XRP’s -3.5% and Solana’s -9.3% was a 5.8 percentage point (pp) spread across the seven-name set. Given that the previous week was positive for most large tokens, with LINK and SOL each up more than 10%, the most recently completed week has reversed a visible part of that advance. Bitcoin’s smaller drawdown kept mega-cap exposure at the more defensive end of the set, while the -7.4% to -9.3% losses in LINK, AVAX, ADA and SOL show that higher-beta large caps absorbed the heaviest selling. YTD losses now run from Bitcoin’s -11.3% to Solana’s -31.1%, leaving year-to-date performance of assets in this set moderately-to-sharply more negative than the weekly tape; thereby maintaining the same condition they’ve been in for the last several months.
Volatility Analysis
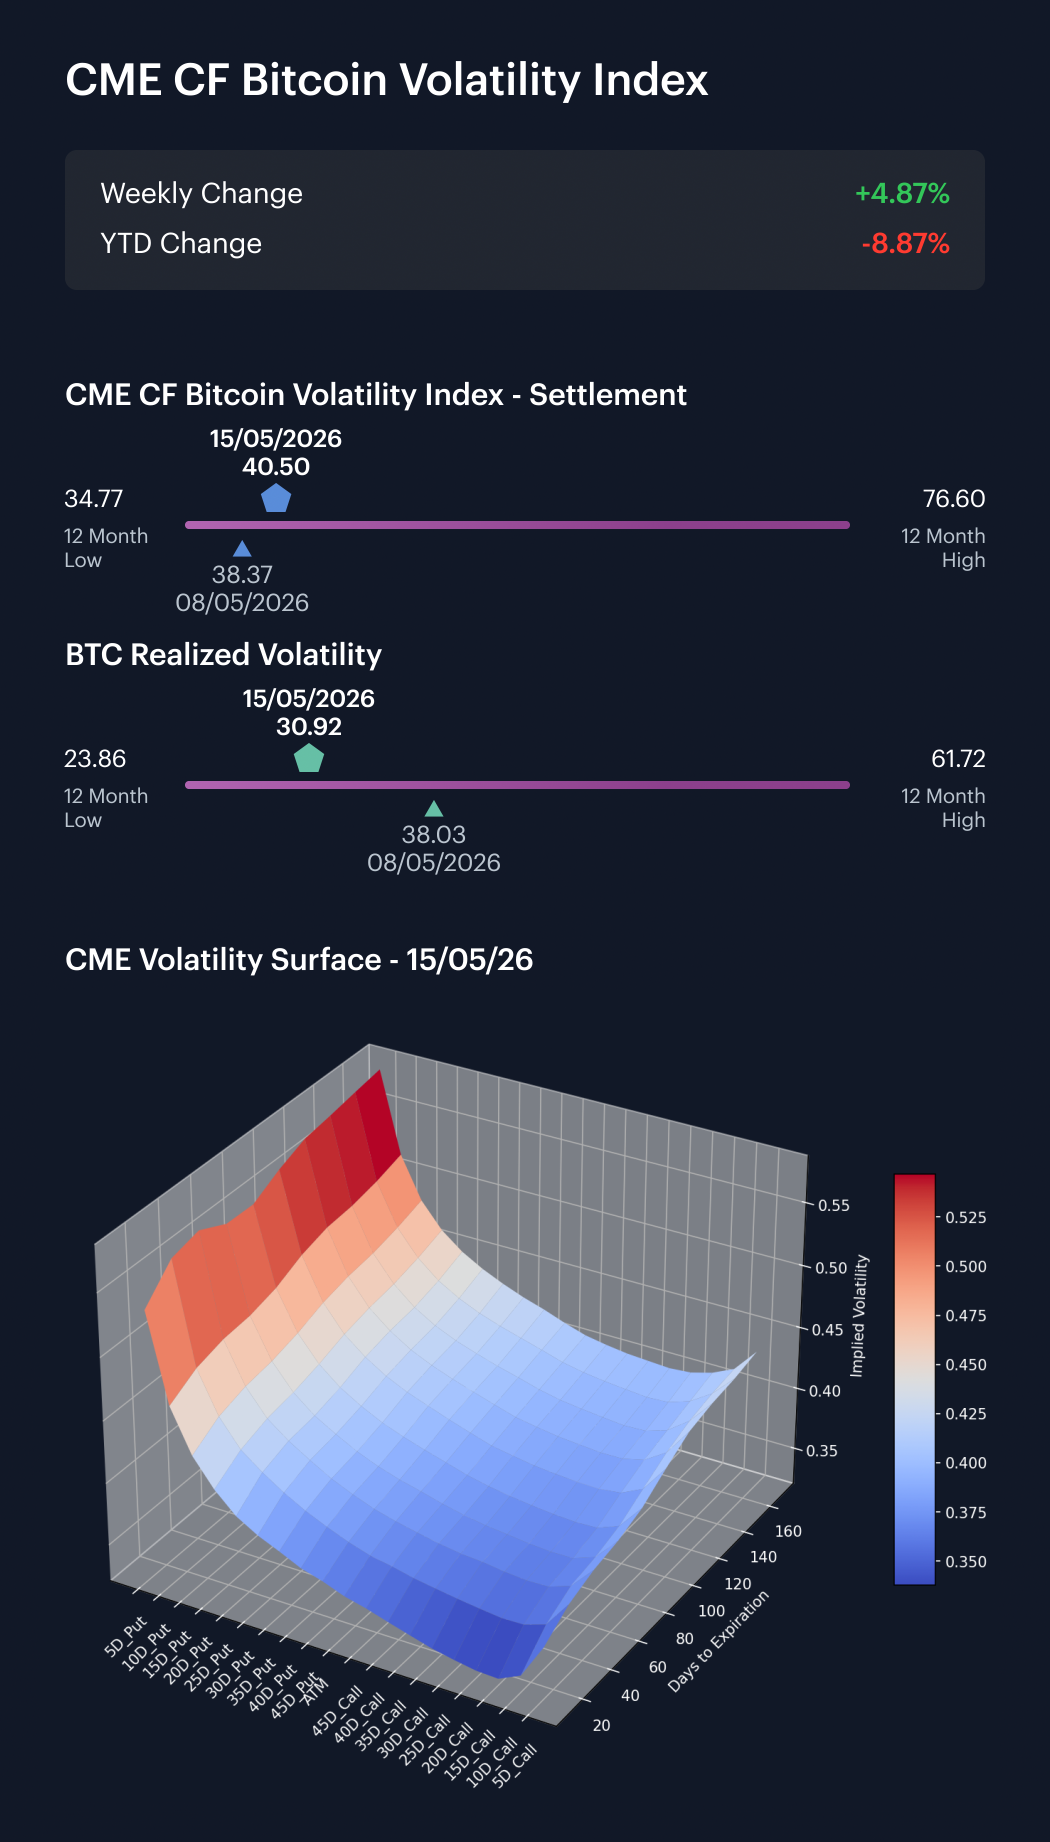
Bitcoin volatility rose moderately in implied terms between May 10th and May 15th, tenuously aligned with renewed weakness in large-cap assets; however, it was notable that realized volatility fell sharply. Our CME CF Bitcoin Volatility Index - Settlement (BVXS) moved from its close on Friday May 8th of 38.37, to 40.50 by the close on Friday May 15th; while within the business week of May 11th to May 15th, it rose from 38.62 to 40.50, a 4.87% increase. Realized volatility moved the other way, falling from 38.03 on May 8th to 30.92 on May 15th, and from 36.79 to 30.92 across the current-week observation. That left implied volatility 9.58 vol. points above realized volatility at the May 15th close, compared with only 0.34 of a vol. point a week earlier. The move is therefore not so much a simple rise in spot volatility, but more like a repricing of forward volatility premium: options markets lifted implied volatility, even as backward-looking realized volatility cooled by 7.12 vol points over the week. Relative to the 12-month range, BVXS stood 5.73 vol. points above its 34.77 low, while realized volatility sat 7.06 vol. points above its 23.86 low. For the week then, the surface can be read as hedging demand rebuilding against a cooler realized backdrop.
Market Cap Index Performance
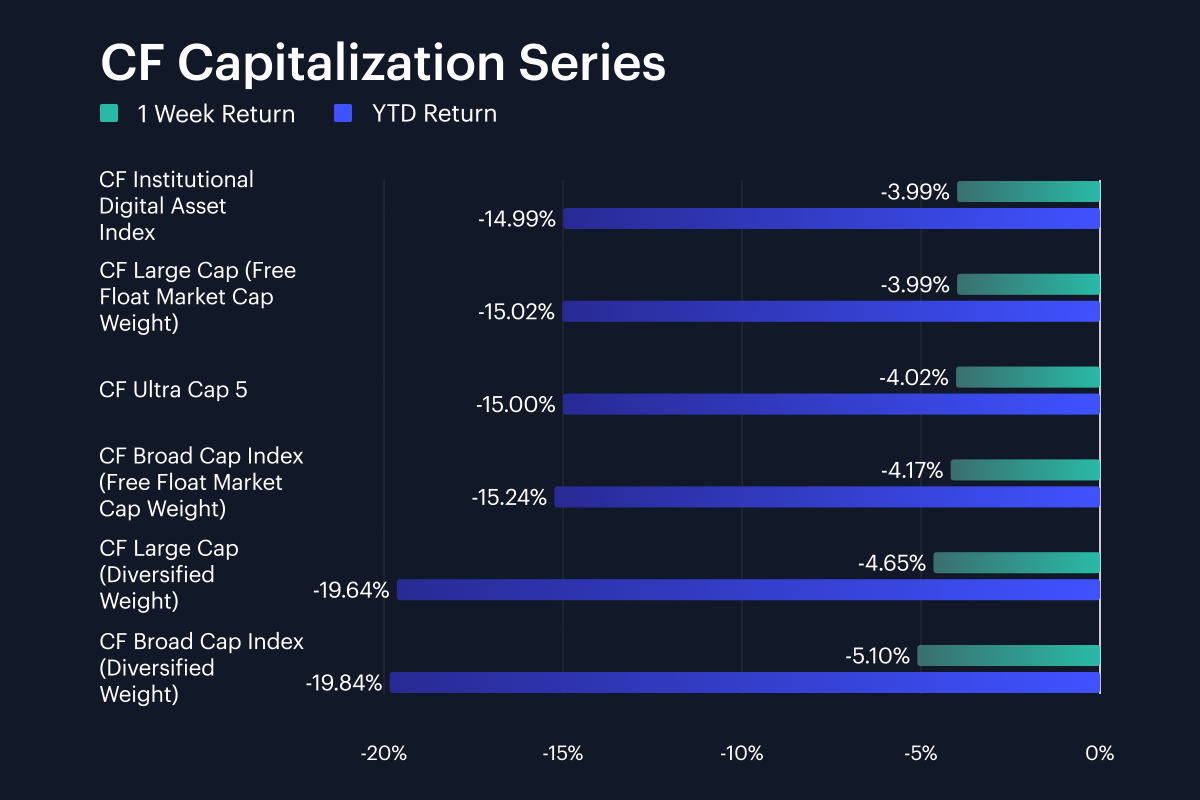
Capitalization indices also reversed direction after the prior week’s gains, falling at a similar pace to each other, and positioning them with near-identical year-to-date declines. The CF Large Cap (Free Float Market Cap Weight) fell about 4.0% w/w leaving it -15.0% YTD, the CF Institutional Digital Asset Index also lost approximately 4.0%, to stand -15.0% YTD, while CF Ultra Cap 5 declined a tad further w/w at -4.02%, extending its YTD loss to 15.0% as well. The broader free-float gauge was also slightly weaker: CF Broad Cap Index (Free Float Market Cap Weight) fell 4.2% (YTD -15.2%). Diversified-weight exposure took the larger hit: the CF Large Cap (Diversified Weight) fell 4.7% (YTD -19.6%) and the CF Broad Cap Index (Diversified Weight) dropped 5.1% (YTD -19.8%). These moves left the capitalization set sitting in a narrow -4.0% to -5.1% weekly band. However, the 1.1 pp gap between the broad diversified index and the large-cap free-float index points to a weaker breadth beneath the mega-cap layer. The gap was also visible YTD, with diversified-weight indices 4.6 to 4.8 pp weaker than the core free-float large-cap measures.
Factor Analysis
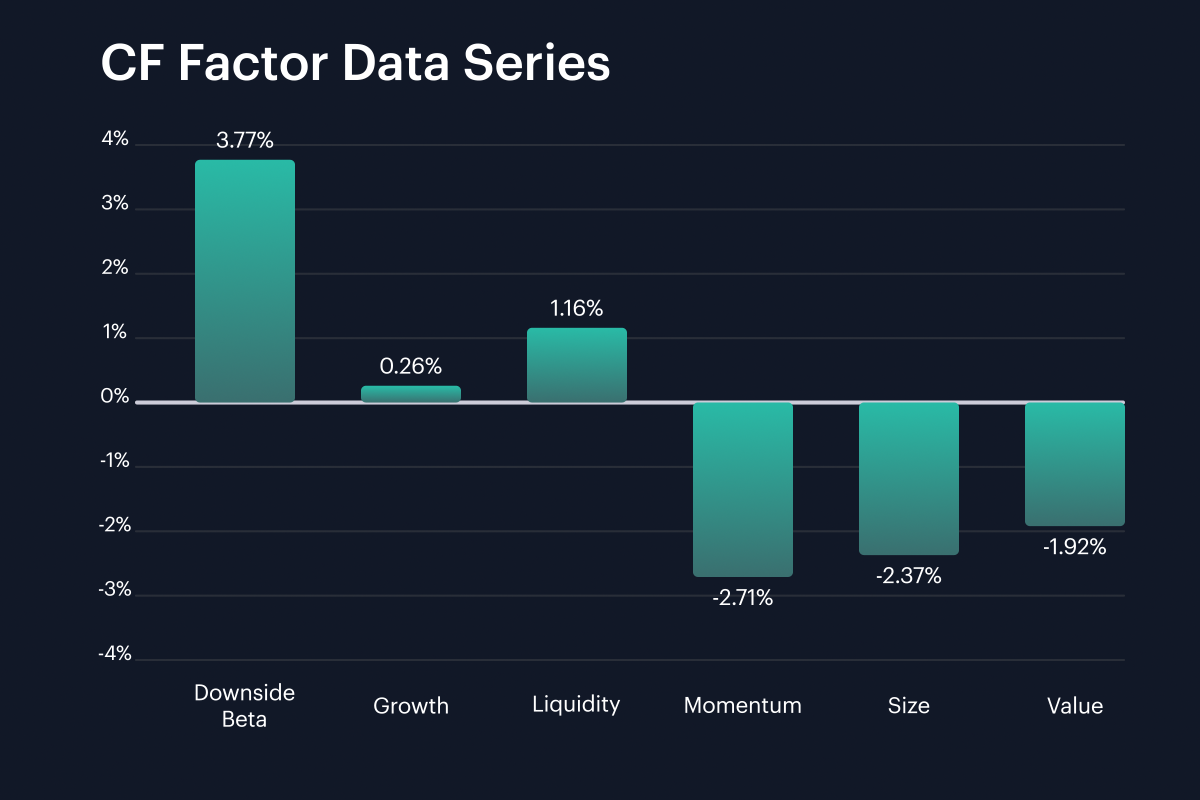
Factor returns were split sharply by style at the end of the recent stretch. Downside Beta printed at 3.8% on Friday May 16th after -1.3% on May 10th, a 5.1 pp swing. Liquidity also improved from -2.5% to 1.2%, while Growth moved from -2.5% to +0.3%. The weaker side of the factor set was concentrated in Size, Value and Momentum: Size moved from 4.6% to -2.4%, Value from +5.1% to -1.9%, and Momentum worsened slightly from -2.5% to -2.7%. Weekly factor returns therefore ranged from Momentum’s -2.7% to Downside Beta’s 3.8%, a 6.5 pp spread. All told, these readings suggest the market paid for downside-sensitive and liquid exposures in the recently completed week, while the prior week’s preference for Size and Value faded. The 7.0 pp reversals in Size and Value were the largest switches in the factor set, giving the style rotation its main force. Liquidity’s 1.2% return also sat 3.6 pp above Size, reinforcing the preference for tradability.
Read our latest weekly crypto factors report: Factor Friday - May 15, 2026
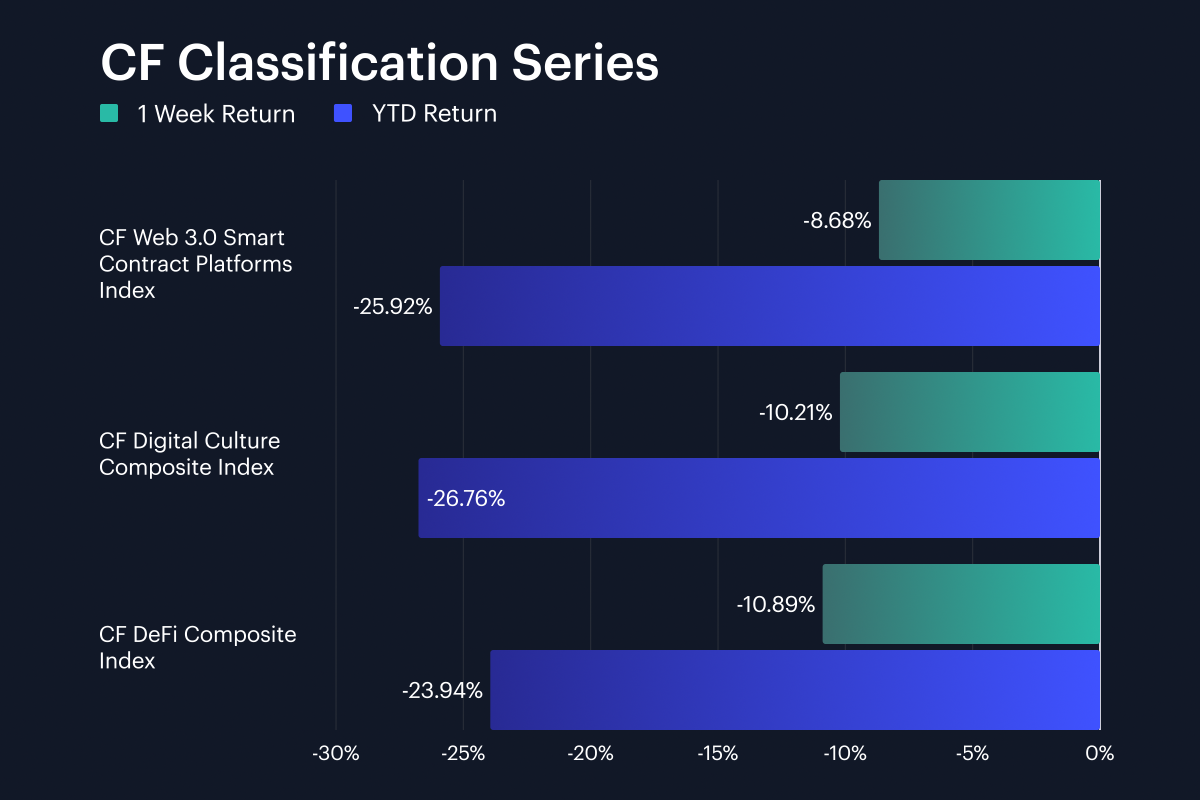
Classification Series Analysis
Across the CF Classification Series, the thematic drawdown was deeper than the headline large-cap move. The CF Web 3.0 Smart Contract Platforms Index fell -8.7% (YTD -25.9%), compared with -10.2% for the CF Digital Culture Composite Index (YTD -26.8%) and -10.9% for the CF DeFi Composite Index (YTD -23.9%). Web 3.0 therefore outperformed DeFi by 2.2 pp and Culture by 1.5 pp on the week, although all three themes gave back a large part of the previous week’s 9.0% to 11.5% gains. The pattern points to a broad cut in thematic beta, with the highest weekly loss sitting in DeFi and the largest YTD loss still sitting in Digital Culture. Web 3.0’s smaller weekly decline gives it relative leadership, but the -8.7% print was still notably much weaker than Bitcoin’s -3.6% drawdown.
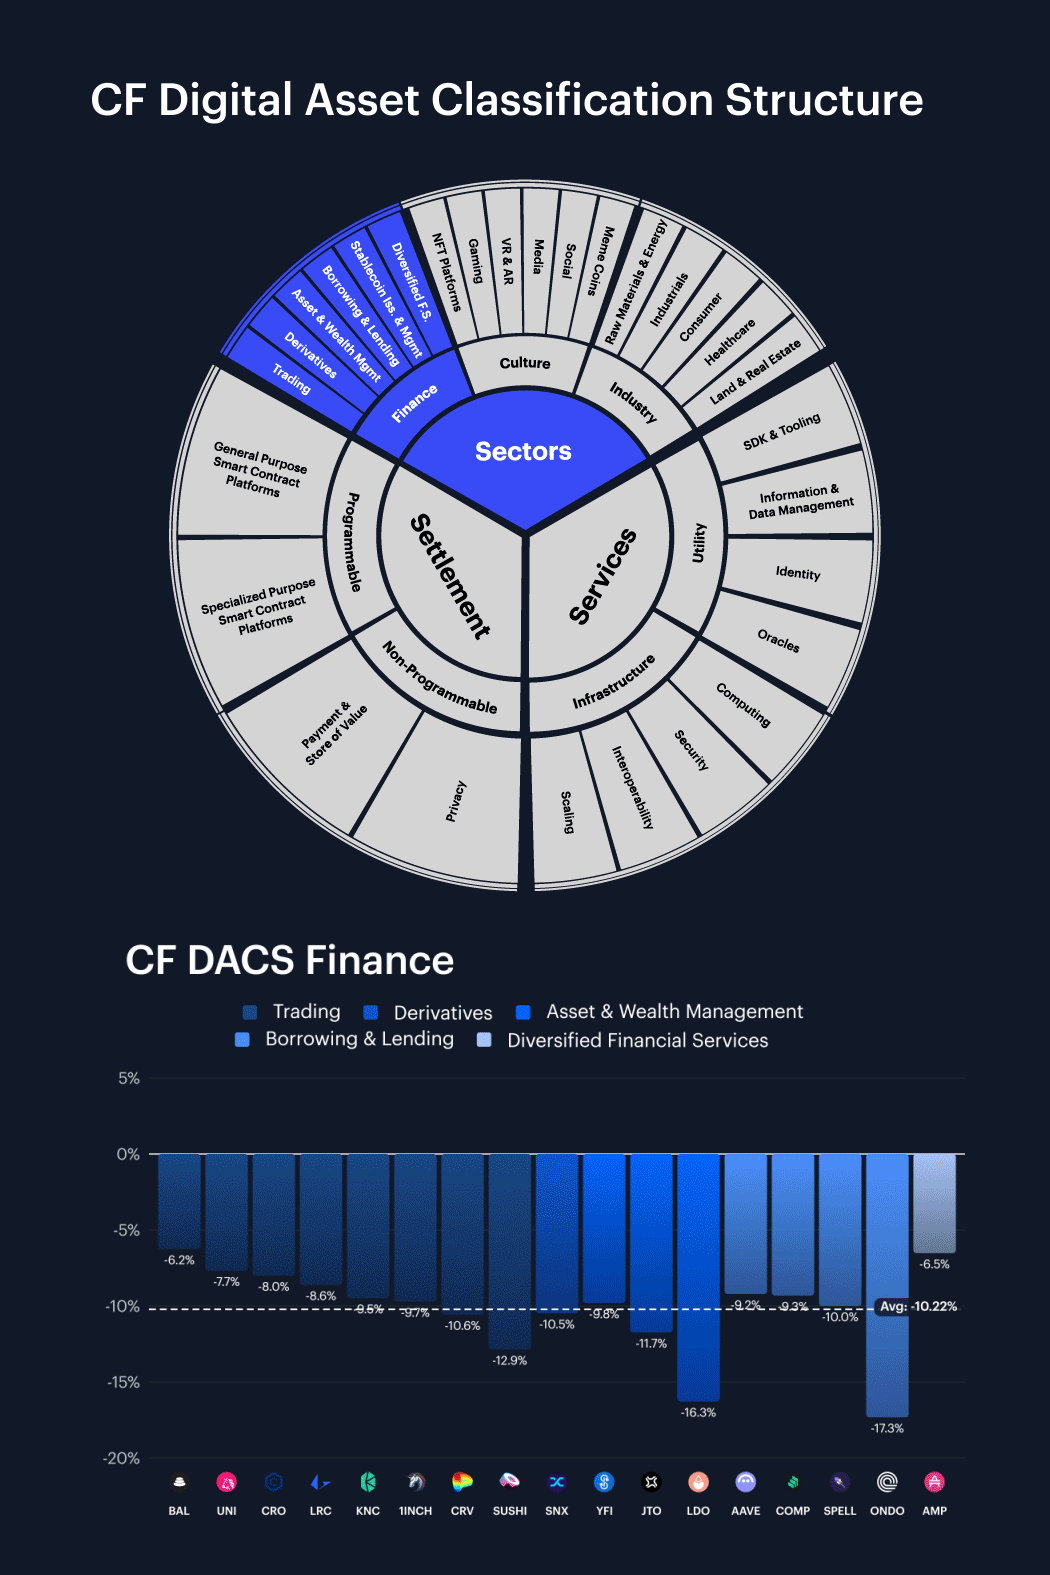
Sector Analysis
Sector performance across our CF Digital Asset Classification Structure (CF DACS) taxonomy was negative in aggregate but uneven beneath the surface. The Culture Sub-Category averaged -8.4% w/w, ahead of Finance at -10.2%, giving Culture a 1.8 pp lead despite losses across most of its constituents. Culture’s relative advantage came from a narrow set of offsets: CHZ rose 12.9%, DOGE added 1.0%, while APE (-0.6%) and RARI (-1.3%) were close to flat. Those gains and smaller losses sat alongside deeper Culture drawdowns in AXS (-18.7%), BONK (-16.8%) and WIF (-13.7%), leaving a 31.6 pp token-level spread between CHZ and AXS. Finance was more uniformly negative. BAL (-6.3%) and AMP (-6.5%) were the strongest Finance constituents, while LDO (-16.3%) and ONDO (-17.3%) were the weakest, leaving an 11.1 pp range. Elsewhere, Utility averaged -11.2%, with LINK down 7.4%, while Infrastructure averaged -12.5%; QNT rose 7.9%, but JASMY (-16.9%) and FET (-17.2%) sat among the larger infrastructure losses.
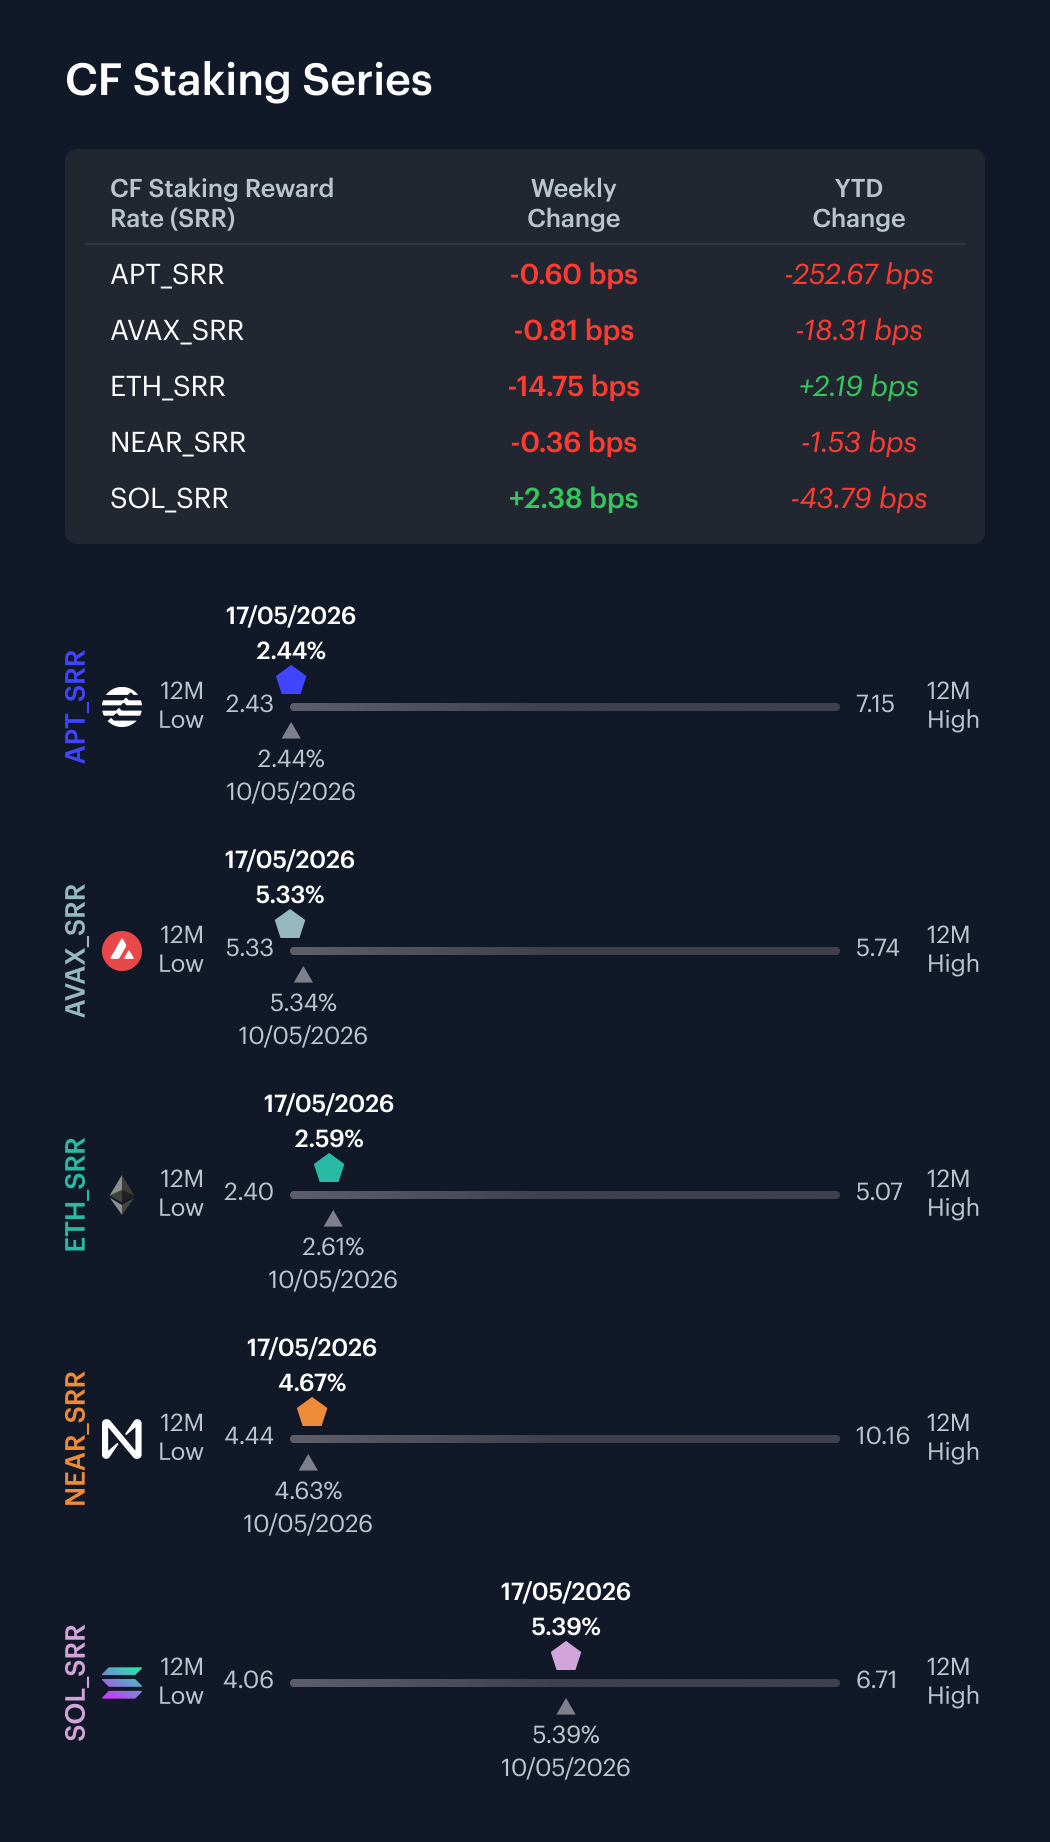
CF Staking Series
Within the CF Staking Series, APT Staking returned -0.2% over the measurement period. Between May 10th and May 16th, its reward rate moved from 2.4422% to 2.4362%, a -0.6 bps change. AVAX Staking also posted a relative change of -0.2%. Over the same Day 1 to Day 7 window, its reward rate moved from 5.3375% to 5.3294%, a -0.8 bps change. ETH Staking was the clear laggard, with a -5.4% move. Its reward rate fell from 2.7379% to 2.5904%, a -14.8 bps move between May 10th through May 16th. NEAR Staking posted a -0.1% change, with its reward rate moving from 4.6701% to 4.6665%, or -0.4 bps. SOL Staking showed the only positive change at 0.4%; with its reward rate rising from 5.3629% to 5.3867% between the current edition and the prior one, a 2.4 bps move. Reward-rate changes therefore spanned -14.8 bps to 2.4 bps, with ETH providing most of the range. Excluding ETH, the reward-rate band narrowed to -0.8 bps to 2.4 bps.
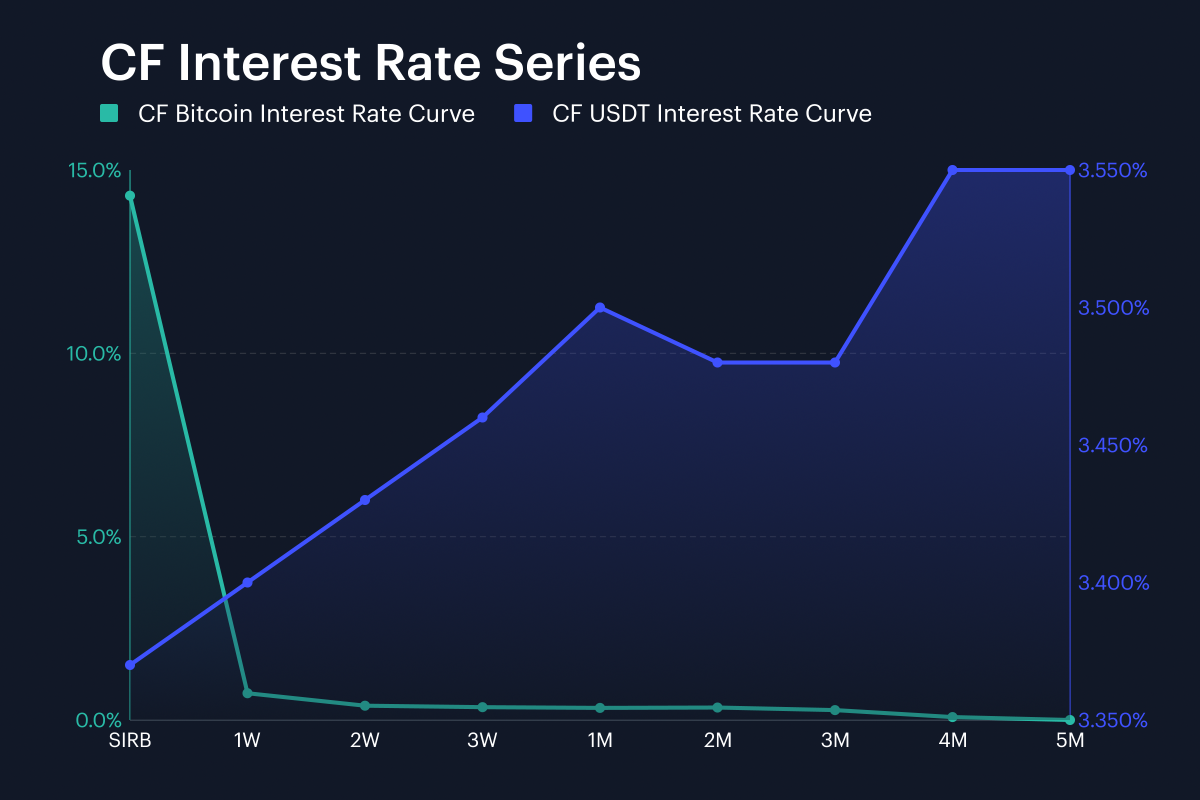
Interest Rate Analysis
Funding conditions ended the most recent week split between a sharp Bitcoin Session Interest Rate (SIRB) jump and lower term funding. BTC SIRB moved from 7.87% to 14.30%, a 643.0 bps increase, while the BTC 1W tenor moved from 0.65% to 0.73%, or 8.2 bps higher. The rest of the BTC curve softened: 2W fell 51.6 bps, 3W fell 91.7 bps, 1M fell 81.8 bps, and 3M fell 28.0 bps. The USDT curve was more even. USDT SIRB moved from 3.89% to 3.37%, a -51.7 bps change, while 1W and 3M fell 51.0 bps and 48.2 bps, respectively. Across both curves, tenor changes ranged from -91.7 bps to 643.0 bps. The configuration is unusual: the BTC overnight benchmark repriced abruptly higher, while most BTC term tenors and the full USDT curve eased by around 47 to 92 bps. That left BTC front-end conditions more idiosyncratic than the USDT curve.
The information contained within is for educational and informational purposes ONLY. It is not intended nor should it be considered an invitation or inducement to buy or sell any of the underlying instruments cited including but not limited to cryptoassets, financial instruments or any instruments that reference any index provided by CF Benchmarks Ltd. This communication is not intended to persuade or incite you to buy or sell security or securities noted within. Any commentary provided is the opinion of the author and should not be considered a personalised recommendation. Please contact your financial adviser or professional before making an investment decision.
Note: Some of the underlying instruments cited within this material may be restricted to certain customer categories in certain jurisdictions.
Softer CPI Reprices July Hike Risk & Lifts Digital Assets
Digital assets extended their recovery over the past week as cooler US inflation prints repriced Fed expectations; the bid was broad across the large cap indices, growth factor leadership returned, stablecoin funding repriced lower, and stress stayed isolated in names hit by token-specific news.

Mark Pilipczuk
Notice of the Demising of CF Dai-Dollar Settlement Price and Spot Rate
The Administrator announces that it will demise the CF Dai-Dollar Settlement Price (DAIUSD_RR) and CF Dai-Dollar Spot Rate (DAIUSD_RTI) which are members of the CF Digital Asset Index Family.
CF Benchmarks
Addition of the Tether Gold Settlement Price and Spot Rate to the CF Digital Asset Index Family
The Administrator announces the addition of the Tether Gold Settlement Price and Spot Rate to the CF Digital Asset Index Family - Single Asset Series.
CF Benchmarks
By clicking Accept, you consent to CF Benchmarks's use of cookies.
Visit Cookie Settings to learn how CF Benchmarks uses cookies and to adjust your preferences.