
May 12, 2025
Weekly Index Highlights, May 12, 2025
Market Performance Update
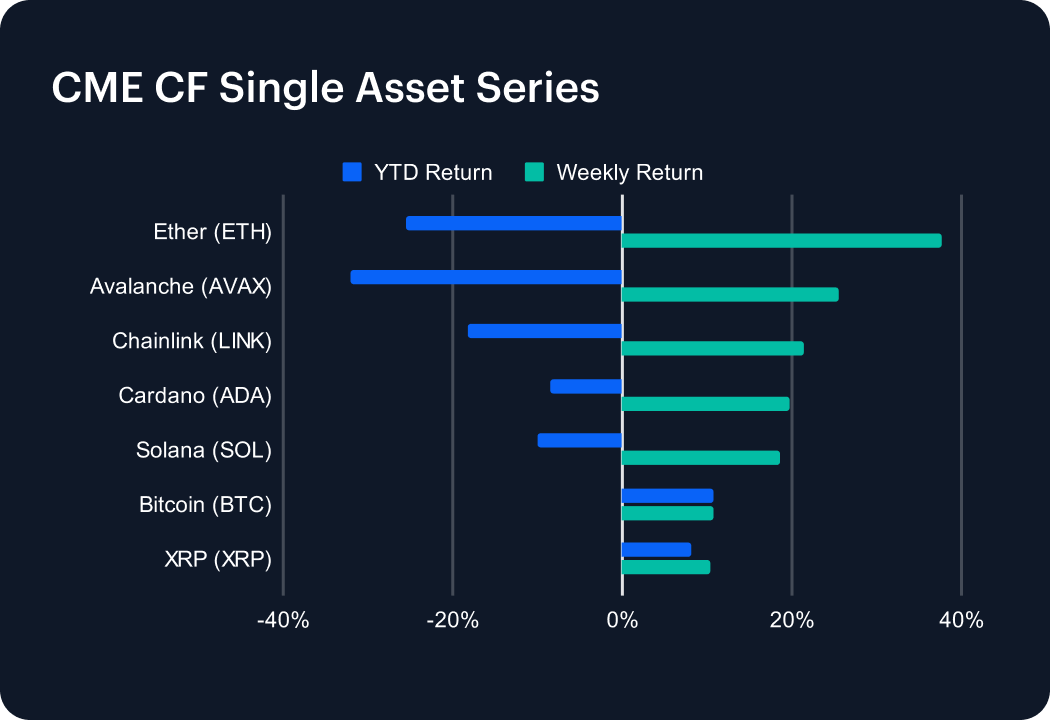
The digital asset market continued its rebound this week, with most major tokens recording strong gains. Ether (ETH) surged 37.65%, trimming its year-to-date (YTD) loss to -25.51%. Avalanche (AVAX) jumped 25.47%, narrowing its YTD decline to -32.10%. Chainlink (LINK) climbed 21.41%, cutting its YTD loss to -18.21%, while Cardano (ADA) and Solana (SOL) advanced 19.79% and 18.59%, respectively, easing their YTD drops to -8.47% and -9.91%. XRP (XRP) gained 10.36%, boosting its YTD return to 8.05%. Bitcoin (BTC) continued its upward trend, rising 10.69% to extend its YTD gain to 10.76%. After weeks of mixed performance, this broad rally signals renewed investor optimism, fueled by macroeconomic developments and improving sentiment across risk assets.
Sector Analysis
Digital assets saw gains across all sub-categories in a sharp reversal from the recent sell-off. Meme coins surged, led by PEPE (+67.16%) and WIF (+65.84%), while DOGE (+35.07%) and BONK (+31.76%) also posted standout returns. In Trading, UNI soared 37.38%, with SUSHI (+32.81%) and LRC (+28.23%) close behind. The Asset & Wealth Management segment rebounded, led by LDO (+36.25%). Ethereum (ETH) led smart contract platforms, followed by NEAR (+34.76%) and DOT (+28.62%). In the Infrastructure sub-category, ARB surged 44.47%, STRK climbed 36.16%, and STX gained 32.21%. Gaming tokens like GALA (+42.81%) and AXS (+32.81%) also outperformed. No major tokens posted losses, marking a decisive shift in sentiment.
Staking Metrics
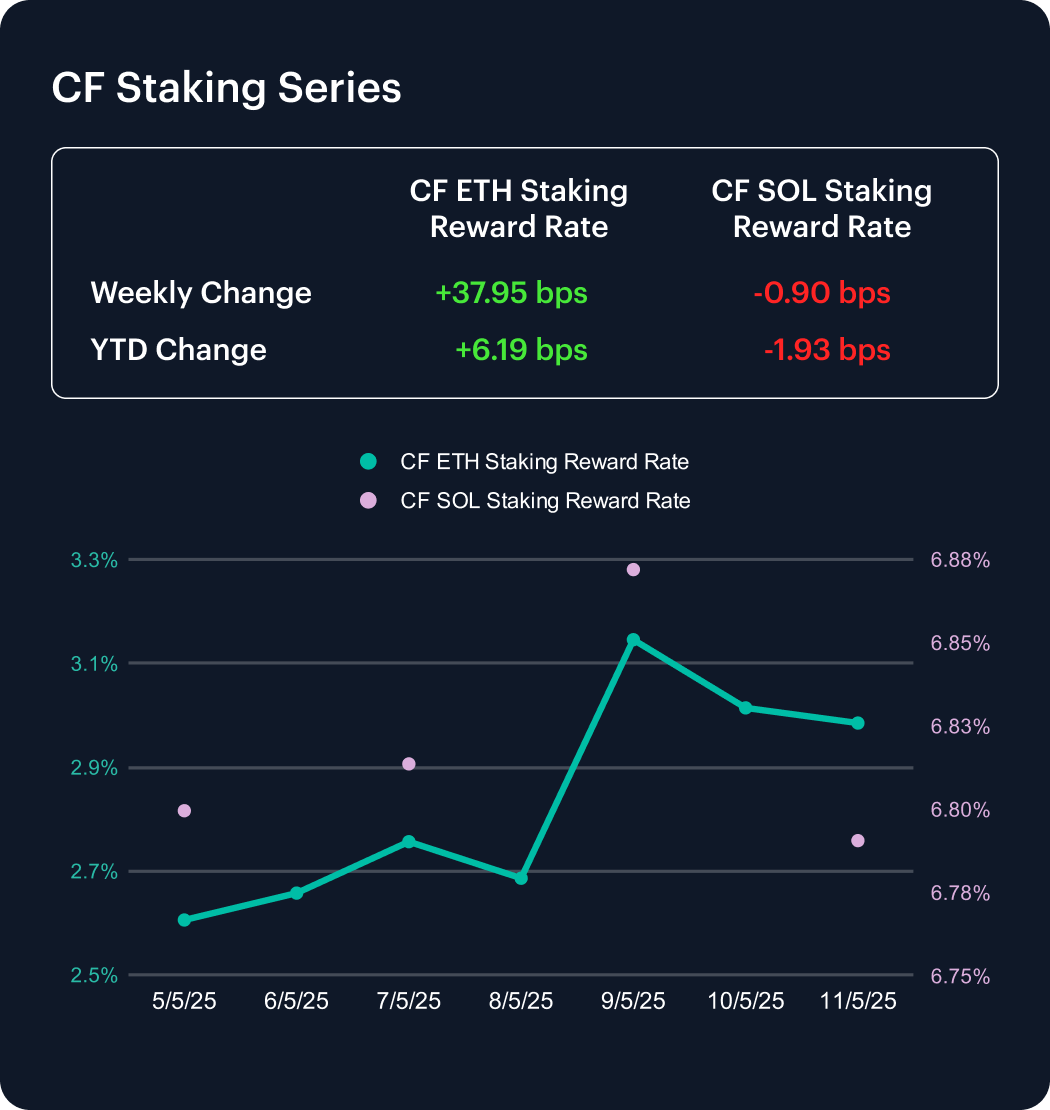
The CF Ether Staking Reward Rate Index (ETH_SRR) rebounded sharply this week, rising 37.95 basis points to 2.99%, a 14.56% weekly increase. Year-to-date, ETH_SRR has climbed 6.19 bps from 2.92%, marking a 2.12% increase and signaling a potential shift toward improving Ethereum staking rewards.
Meanwhile, the CF SOL Staking Reward Rate Index (SOL_SRR) dipped slightly, falling 0.9 bps to 6.79%, a modest 0.13% decline for the week. With a year-to-date drop of 1.93 bps, or -0.28%, Solana’s staking yields remain relatively stable but are no longer growing faster than Ethereum’s, narrowing the inter-chain reward gap.
Market Cap Index Performance
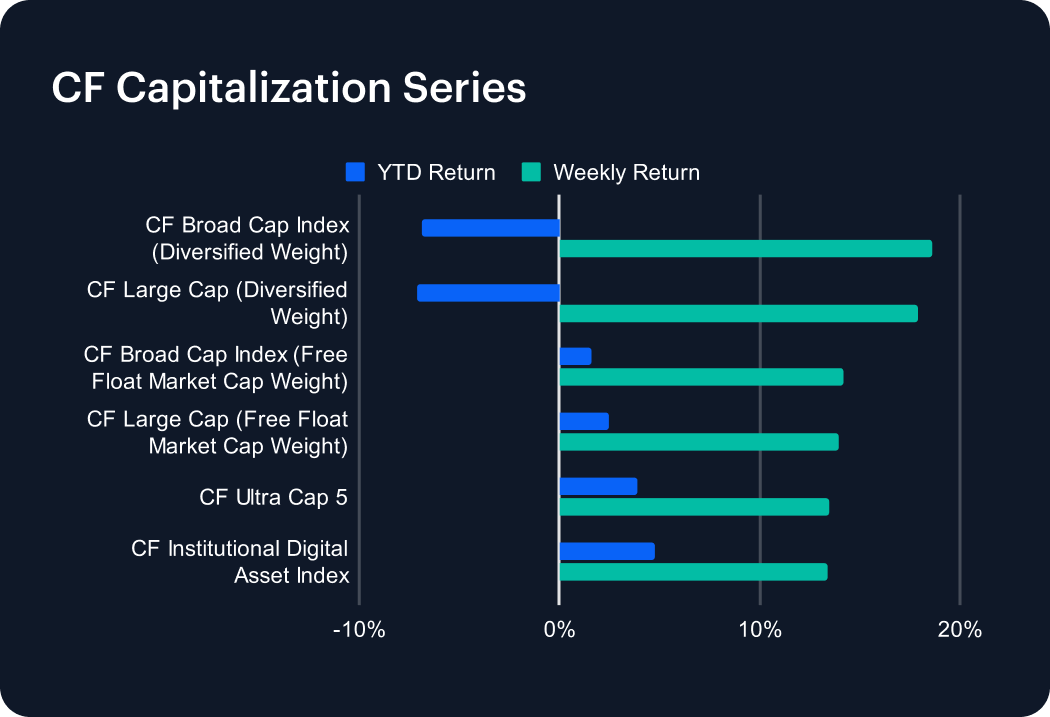
The CF Capitalization Series posted strong gains across the board this week, reversing recent weakness. Diversified-weighted indices led the advance, with the CF Broad Cap Index jumping 18.63% and the CF Large Cap up 17.92%, trimming their year-to-date (YTD) losses to -6.90% and -7.11%, respectively. Free-float market cap-weighted benchmarks also rallied, as the CF Broad Cap and CF Large Cap indices rose 14.20% and 13.97%, improving their YTD returns to 1.58% and 2.45%. The CF Ultra Cap 5 climbed 13.51%, while the CF Institutional Digital Asset Index gained 13.37%, bringing their YTD gains to 3.91% and 4.74%. The broad-based surge signals renewed risk appetite, with both large- and small-cap assets benefiting from improved sentiment.
Classification Series Analysis
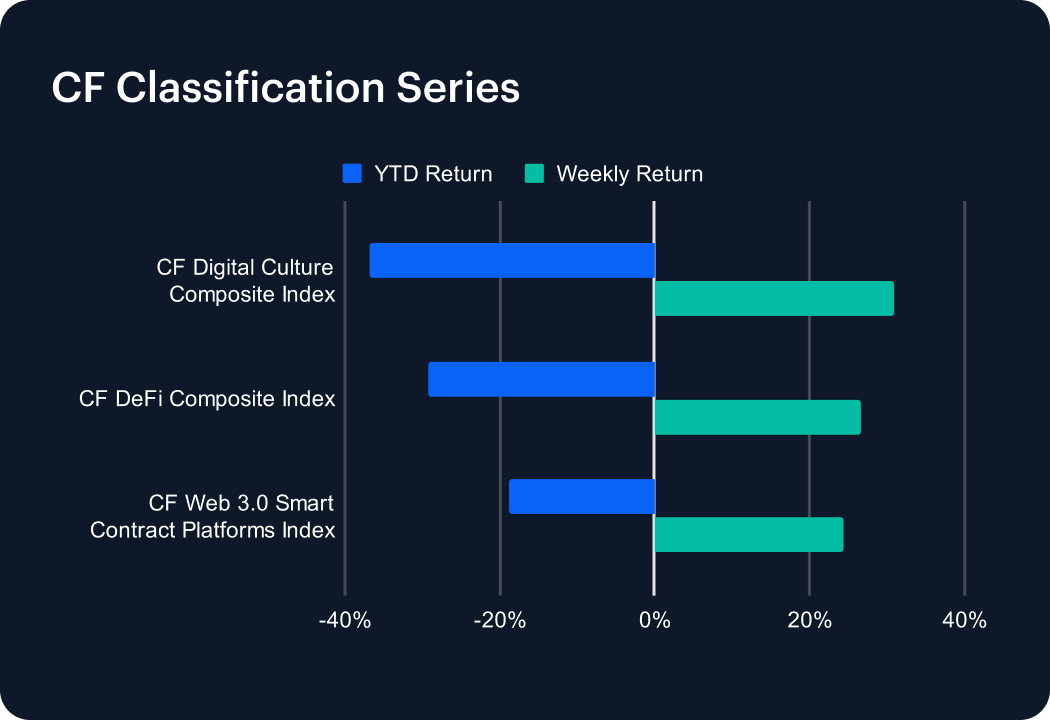
The CF Classification Series Indices surged this week, outperforming broader benchmarks as high-beta thematic segments attracted renewed interest. The CF Digital Culture Composite Index led with a 30.89% gain, trimming its year-to-date (YTD) loss to -36.75%. The CF DeFi Composite Index followed closely, rising 26.61% and reducing its YTD decline to -29.35%. The CF Web 3.0 Smart Contract Platforms Index also rebounded, climbing 24.38% and easing its YTD loss to -18.87%. Despite the impressive weekly rally, all three indices remain firmly in negative territory for the year due to prior drawdowns—underscoring the lasting impact of downside volatility and the importance of risk management in thematic and speculative segments of the digital asset market.
Volatility
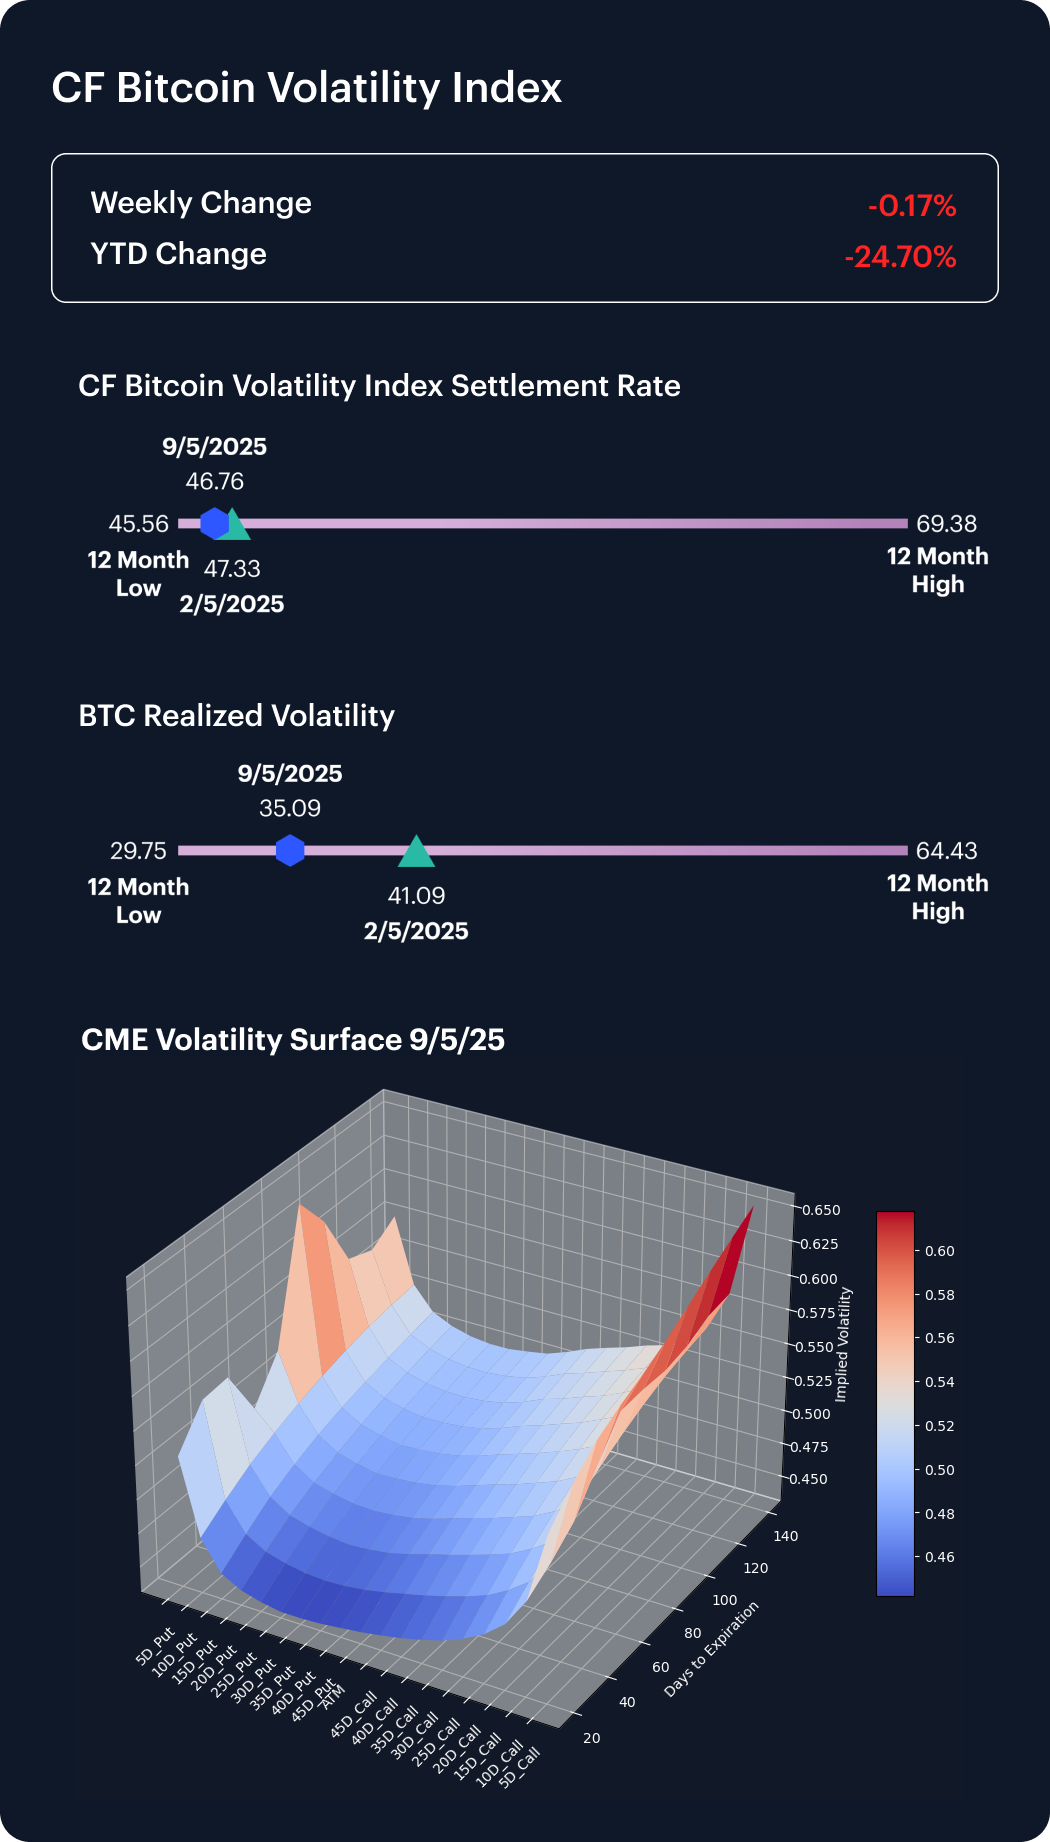
The CF Bitcoin Volatility Index Settlement Rate (BVXS) declined slightly this week, falling 0.17% to settle at 46.76, extending its year-to-date drop to 24.70%. The continued decrease in implied volatility highlights sustained moderation in demand for option hedging and speculative positioning. In contrast, realized volatility trended lower, dropping from 41.09 to 35.09, reflecting a tightening of short-term price movement.
CME Bitcoin Volatility Surface data maintains a steady positive skew across 10 to 25 delta points, with increased convexity indicating asymmetrical risk preferences. Notably, implied volatility in long-dated 5-delta calls has held steady at elevated levels, suggesting that investors remain quietly positioned for outsized upside despite a generally subdued volatility backdrop.
Interest Rate Analysis
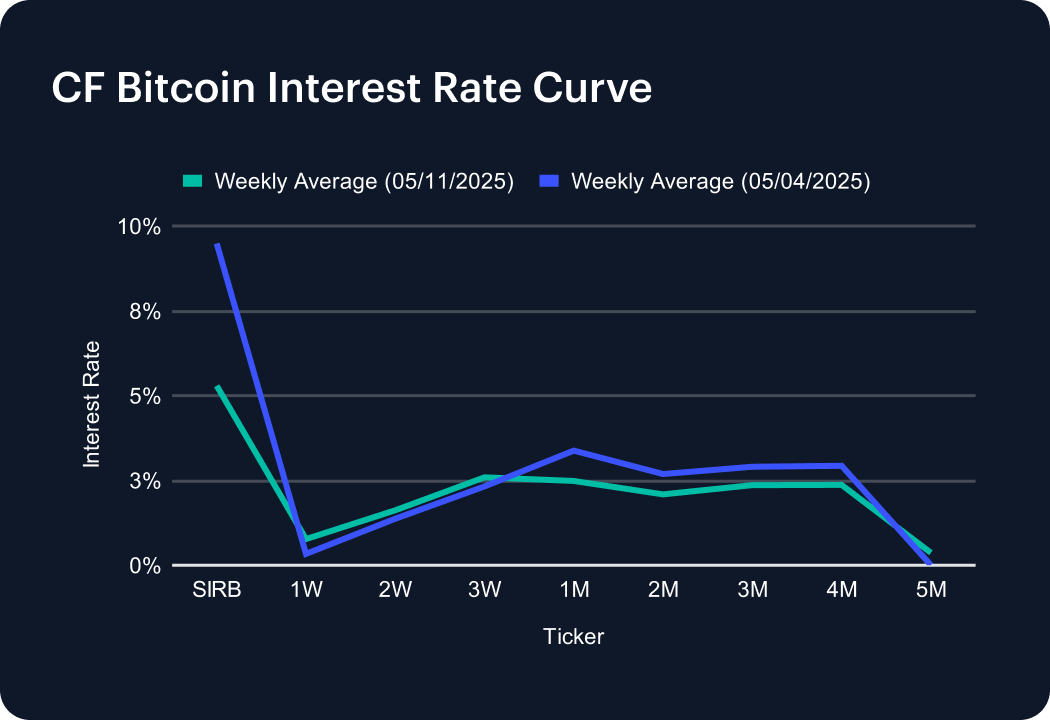
The CF Bitcoin Interest Rate Curve rebounded modestly this week, reversing last week’s sharp decline. The Short-Term Interest Rate Benchmark (SIRB) rose to 5.29% from 9.49%, signaling a partial re-tightening in near-term funding conditions. The 1-week tenor increased to 0.77%, while the 2- and 3-week rates climbed to 1.62% and 2.59%, respectively. One-month funding fell to 2.48% from 3.38%, and mid-curve tenors from 2 to 4 months also declined slightly. The 5-month rate ticked up to 0.36%, recovering from zero. Overall, the curve suggests a mixed picture, with a slight uptick in short-term leverage demand, while mid-term positioning remains subdued.
The information contained within is for educational and informational purposes ONLY. It is not intended nor should it be considered an invitation or inducement to buy or sell any of the underlying instruments cited including but not limited to cryptoassets, financial instruments or any instruments that reference any index provided by CF Benchmarks Ltd. This communication is not intended to persuade or incite you to buy or sell security or securities noted within. Any commentary provided is the opinion of the author and should not be considered a personalised recommendation. Please contact your financial adviser or professional before making an investment decision.
Note: Some of the underlying instruments cited within this material may be restricted to certain customer categories in certain jurisdictions.
Changes to the Token Market Price Benchmarks Series - Market Prices – 21 July 2026
The Administrator has confirmed changes to the Token Market Price Family for the period 14 July 2026 to 21 July 2026.

CF Benchmarks
Softer CPI Reprices July Hike Risk & Lifts Digital Assets
Digital assets extended their recovery over the past week as cooler US inflation prints repriced Fed expectations; the bid was broad across the large cap indices, growth factor leadership returned, stablecoin funding repriced lower, and stress stayed isolated in names hit by token-specific news.
Mark Pilipczuk
Notice of the Demising of CF Dai-Dollar Settlement Price and Spot Rate
The Administrator announces that it will demise the CF Dai-Dollar Settlement Price (DAIUSD_RR) and CF Dai-Dollar Spot Rate (DAIUSD_RTI) which are members of the CF Digital Asset Index Family.
CF Benchmarks
By clicking Accept, you consent to CF Benchmarks's use of cookies.
Visit Cookie Settings to learn how CF Benchmarks uses cookies and to adjust your preferences.