
May 11, 2026
Weekly Index Highlights, May, 11, 2026
Market Performance Update
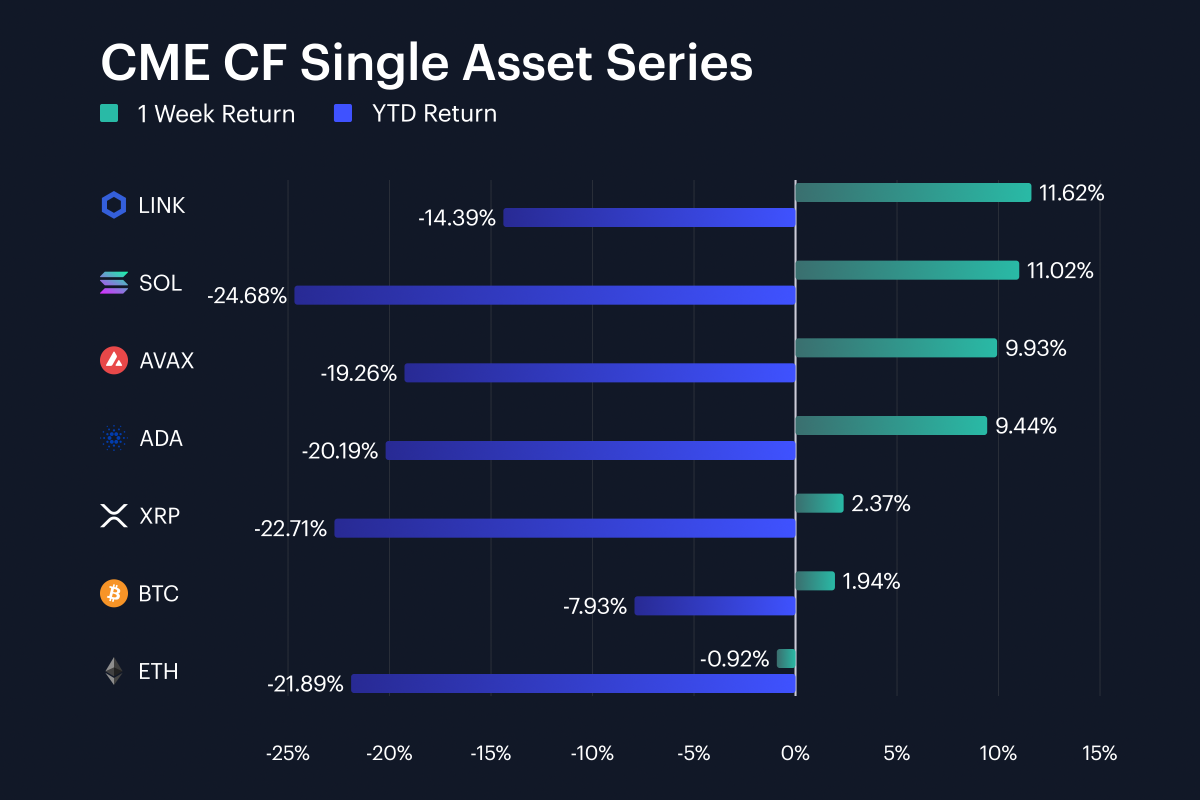
Digital asset performance strengthened over the past week, with the Single Asset Series moving from the prior week’s -2.0% to +1.0% band into a -0.9% to +11.6% week-on-week (w/w) range. Chainlink (LINK) led at 11.6% w/w, hence making significant progress in reducing its year-to-date (YTD) loss. LINK stood at -14.4% YTD by the close of May 10th, followed by Solana (SOL) at +11.0% w/w (YTD -24.7%) Avalanche (AVAX) at +9.9% (YTD -19.3%) and Cardano (ADA) at +9.4% (YTD -20.2%). The mega-cap anchors notably lagged these moves: Bitcoin (BTC) gained 1.9% w/w (YTD -7.9%), while Ether (ETH) actually slipped 0.9% (YTD -21.9%). XRP rose 2.4% w/w, keeping it between BTC and the higher-beta leaders. The 12.54 percentage point (pp) gap between LINK and ETH, together with a 9.08 pp SOL-versus-BTC spread, indicates that the week’s strength sat in protocol and services beta, with BTC acting as a lower-volatility anchor, and ETH the only negative print in the major-token set.
Volatility Analysis
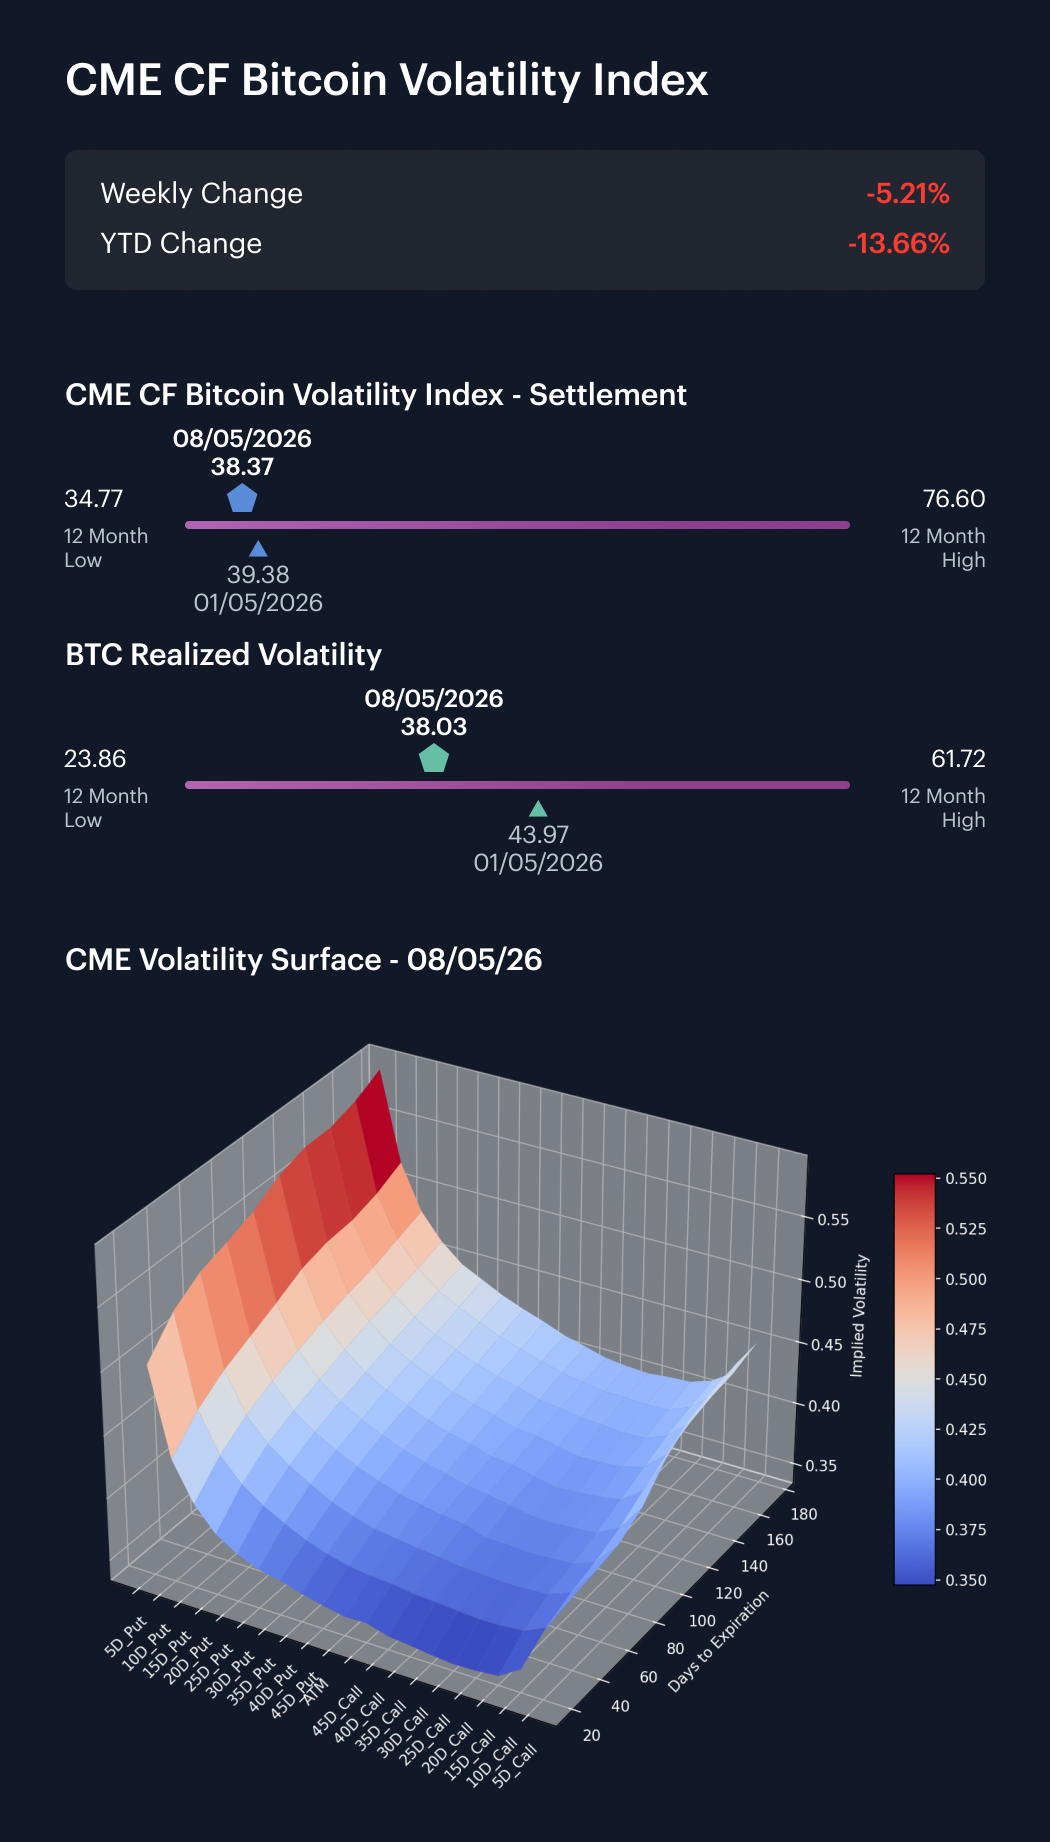
Bitcoin volatility cooled over the May 4th to May 8th business-week window, with our CME CF Bitcoin Volatility Index – Settlement (BVXS) moving -2.11 vol. points from the open on Monday May 4th to the close on May 8th and realized volatility moving -4.55 vol. points over the same span. BVXS had closed the prior Friday (May 1st) at 39.38. It then opened on Monday, May 4th at 40.48, and ended on Friday, May 8th at 38.37, just -1.01 of a vol.-point from the prior weekly close. Realized volatility moved from 43.97 at the prior Friday close to 42.58 on May 4th, and 38.03 by May 8th, a -5.94 vol.-point w/w decline. The implied-to-realized spread thus shifted from -4.59 vol. points at the end of the prior week to 0.34 vol. points in the most recently completed week. That’s a 4.93 vol.-point swing back into a small implied premium. With implied vol. at 38.37 and realized at 38.03, options pricing ended the week only 0.34 vol. points above realized volatility. As well, BVXS sat 6.07 vol. points below its 44.44 start-of-year reference. So, the latest weekly close exhibited weekly compression alongside a -13.7% YTD print for implied volatility.
Market Cap Index Performance
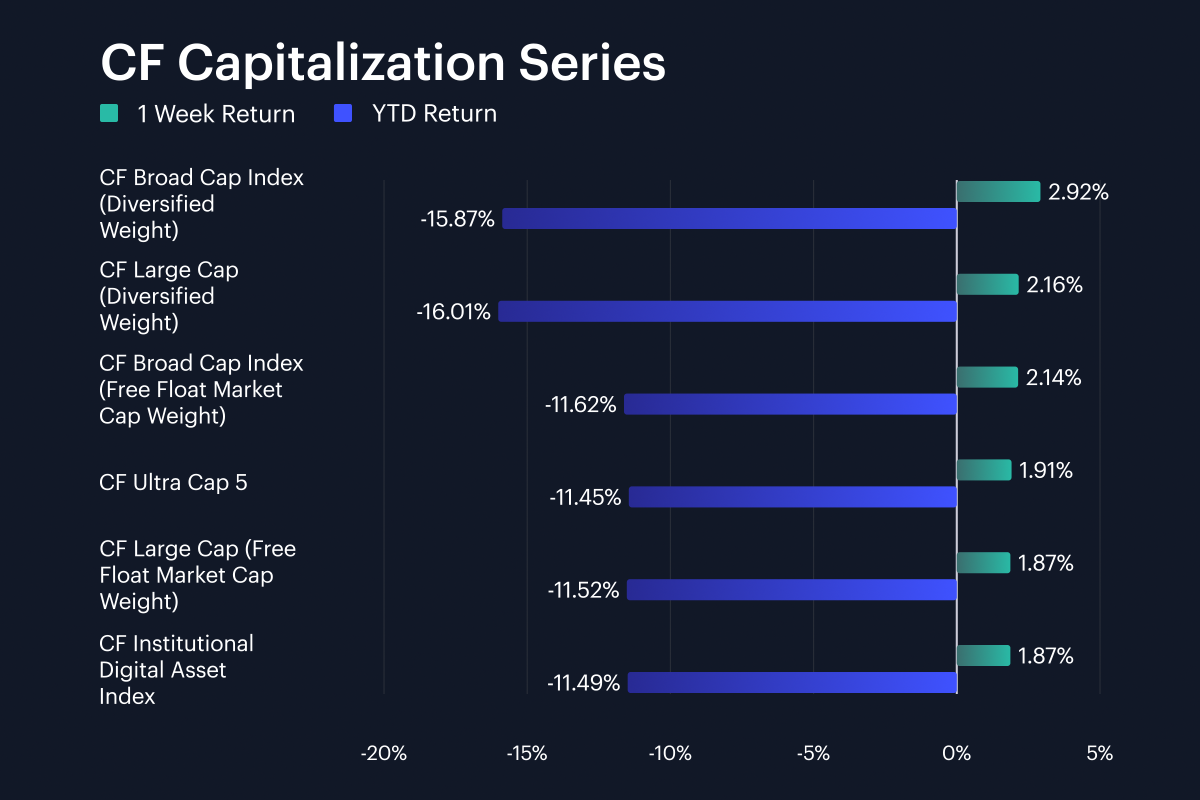
CF Capitalization Series indices advanced in a compact band, with weekly returns ranging from 1.9% to 2.9% w/w after the prior week’s 0.4% to 0.8% range. CF Broad Cap Index (Diversified Weight) led at +2.9% w/w (YTD -15.9%), while CF Large Cap (Diversified Weight) rose 2.2% (YTD -16.0%). Free-float market-cap weighted exposure also gained, with the CF Broad Cap Index (Free Float Market Cap Weight) at +2.1% w/w (YTD -11.6%) and CF Large Cap (Free Float Market Cap Weight) at +1.9% (YTD -11.5%). CF Ultra Cap 5 also added 1.9% w/w, while the CF Institutional Digital Asset Index rose approximately 1.9% too. The 1.05 pp spread between diversified broad-cap exposure and large-cap free-float exposure shows breadth had a modest edge. YTD losses still ran from -11.5% to -16.0%, so the week repaired part of the 2026 drawdown though an implied drag on sentiment remains.
Factor Analysis
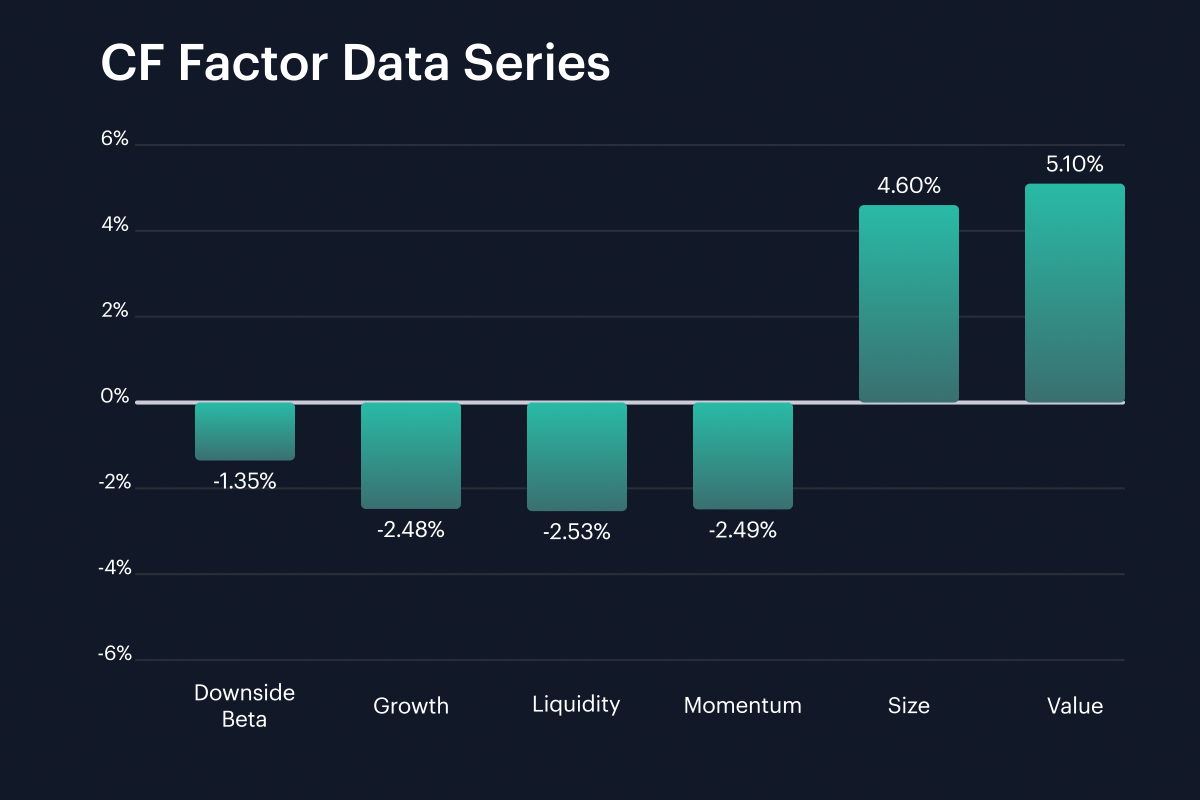
Cumulative factor returns rotated toward Size and Value over the week spanning May 4th to May 10th, ranging from Liquidity at -2.5% to Value at 5.1%. Value had printed at -0.1% in the prior week, meaning a 5.22 pp improvement over the recently completed week. Size moved from -0.3% to 4.6%, a 4.91 pp swing. Momentum weakened from 0.4% to -2.5%, a -2.91 pp move, and Liquidity moved from -0.2% to -2.5%, a -2.33 pp shift. Growth weakness also widened; from -0.6% to -2.5%, while Downside Beta moved from -0.7% to -1.3%. The latest 7.63 pp cross-sectional range was therefore wider than the prior week’s -0.7% to 0.4% range. That 7.63 pp range fits a tape where investors rewarded smaller and cheaper exposures while de-emphasizing liquid momentum exposure. Size and Value were the only positive current-week factors, and their combined average of 4.8% sat 7.35 pp above the -2.5% average across Growth, Liquidity and Momentum.
Read our latest weekly crypto factors report: Factor Friday - May 8, 2026
Classification Series Analysis
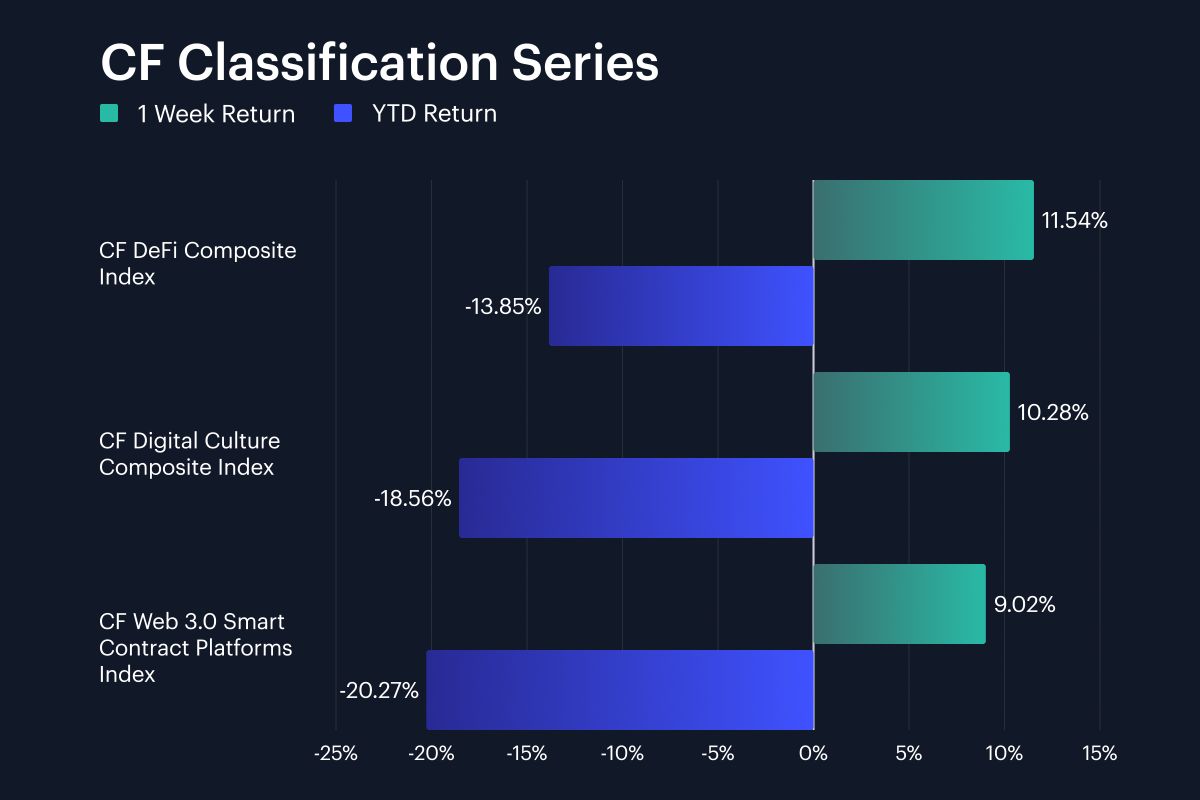
Across the CF Classification Series, thematic exposure moved back into positive territory, with returns of 9.0% to 11.5% after the prior week’s -1.7% to -0.7% range. The CF DeFi Composite Index led at 11.5% w/w (YTD -13.8%), followed by the CF Digital Culture Composite Index at 10.3% (YTD -18.6%) and the CF Web 3.0 Smart Contract Platforms Index at 9.0% (YTD -20.3%). DeFi outperformed Web 3.0 platforms by 2.53 pp, with Culture sitting 1.27 pp behind DeFi and 1.26 pp ahead of Web 3.0. The current-week range of 9.0% to 11.5% was broader and higher than the prior week’s negative range. Still, YTD drawdowns from -13.8% to -20.3% show that the recovery remained incomplete across all three composites. Note that DeFi’s 11.5% weekly gain reduced its YTD loss to the shallowest of the group at -13.8%, versus Web 3.0’s deeper -20.3% YTD decline.
Sector Analysis
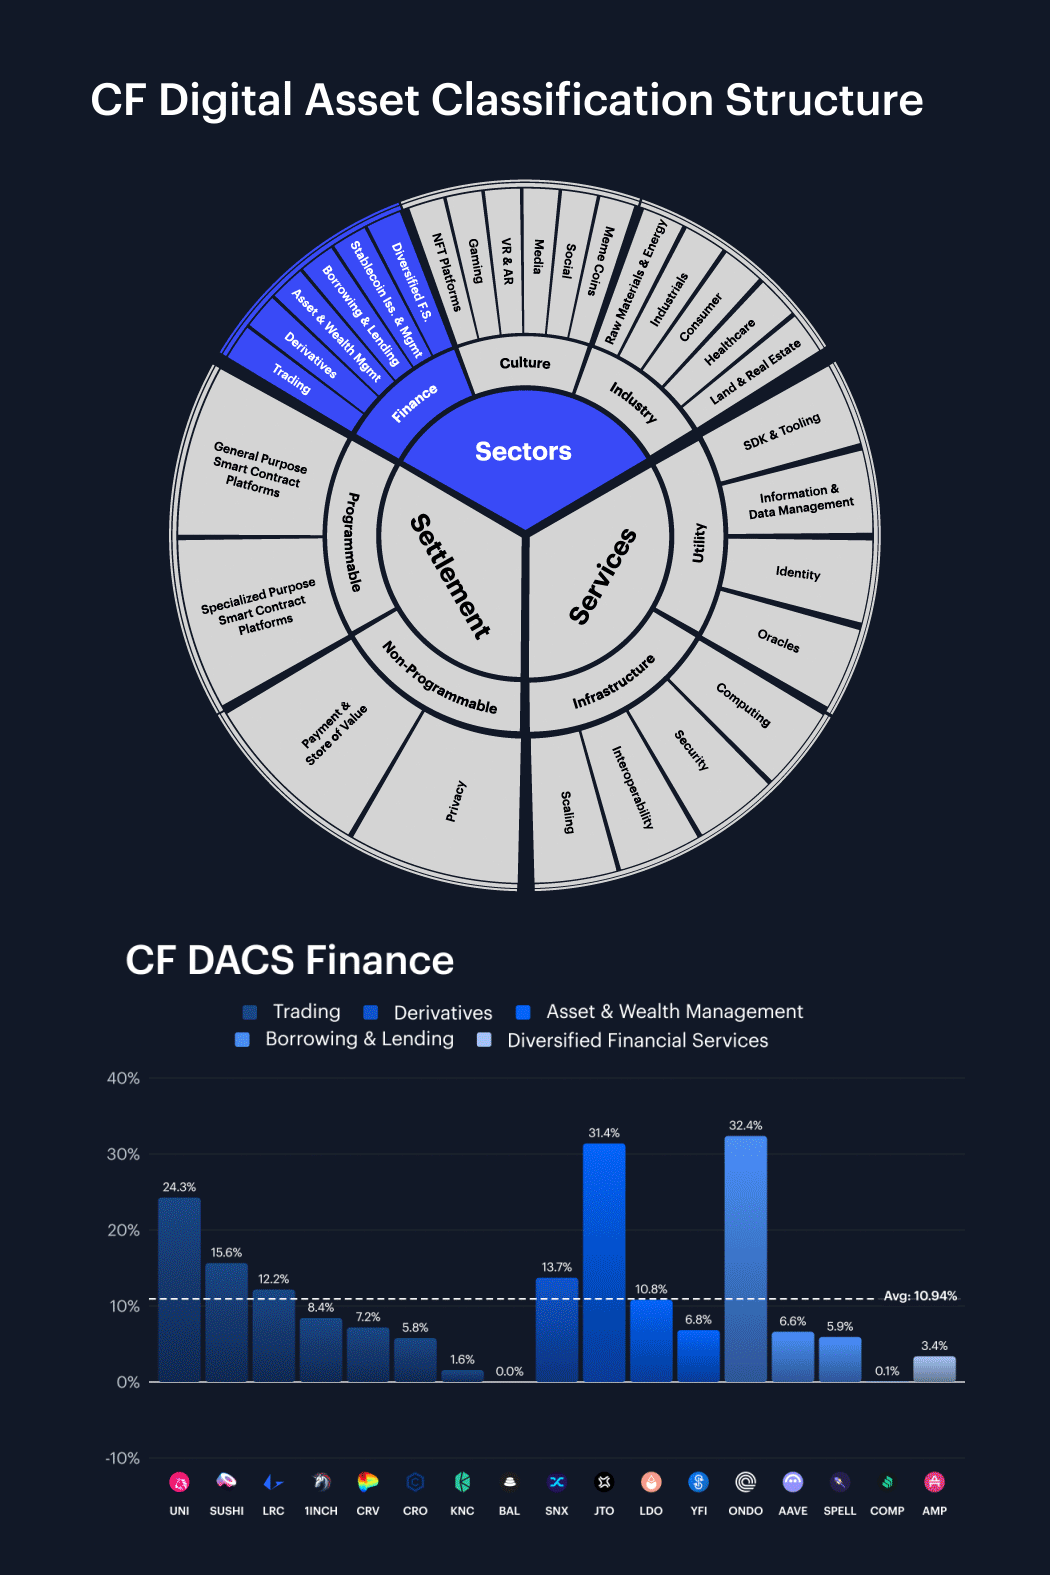
Sector performance was positive across the CF Digital Asset Classification Structure (CF DACS) with average weekly returns through the complex ranging from 3.4% to 15.5%. The Infrastructure Sub-Category led at +15.5% w/w, helped by STRK at +35.5%, OP at +32.3% and JASMY at +28.2%. Programmable followed at +13.6% on average, with ICP up 42.6%, NEAR at +24.6% and SUI jumping 23.1%. Utility averaged +13.4%, Finance +10.9% and Culture +9.7%. Non-Programmable was the laggard, averaging +3.4%, with BTC inching up 1.9% and XRP at +2.4%. The 12.16 pp Infrastructure-versus-Non-Programmable spread shows that higher-beta tokens in the Scaling, Computing and General Purpose Smart Contract Platforms exposures carried the week, while Payment & Store of Value tokens moved less. Finance also had broad internal support, with ONDO at +32.4%, JTO at +31.4% and UNI at +24.3%; while Culture’s average was held back by APE falling 6.7% and DOGE at -2.9%. Across individual DACS constituents, returns spanned from APE at -6.7% to ICP at 42.6%, a 49.27 pp token-level range.
CF Staking Series
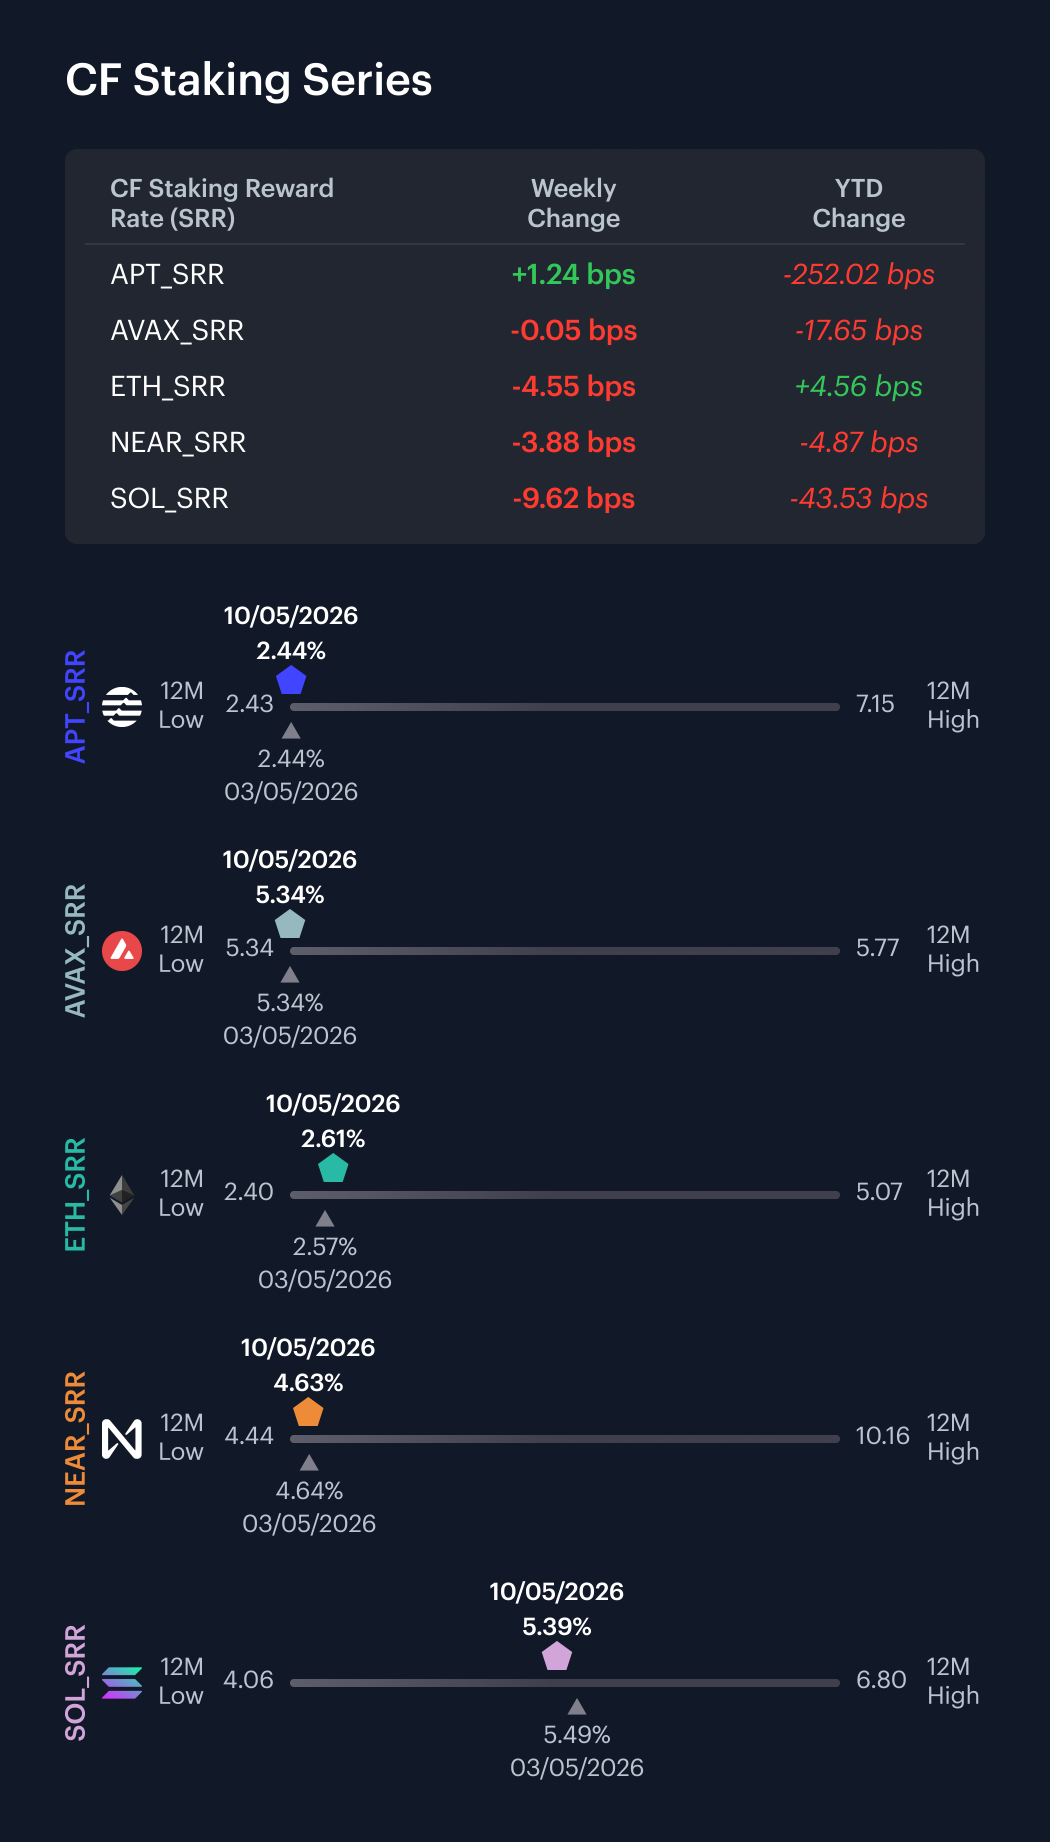
Within the CF Staking Series, weekly index relative change ran from -1.8% to 0.5%. APT Staking moved 0.5% w/w. Between Day 1 and Day 7, its reward rate moved from 2.4303% to 2.4427%, a 1.24 bps change. AVAX Staking moved -0.01% w/w. Over the same Day 1 to Day 7 window, its reward rate moved from 5.3365% to 5.3360%, a -0.05 bps change. ETH Staking moved -1.7% w/w, while its reward rate moved from 2.6596% to 2.6141%, a -4.55 bps change. NEAR Staking moved -0.8% w/w and SOL Staking moved -1.8% w/w. Their reward rates moved -3.88 bps and -9.62 bps, respectively, leaving the intra-week reward-rate range between -9.62 bps and 1.24 bps. The gap between APT’s 0.5% gain and SOL’s -1.8% decline was 2.26 pp. All told, staking performance looked somewhat more defensive against the backdrop of an overall more positive and constructive week for spot performance.
Interest Rate Analysis
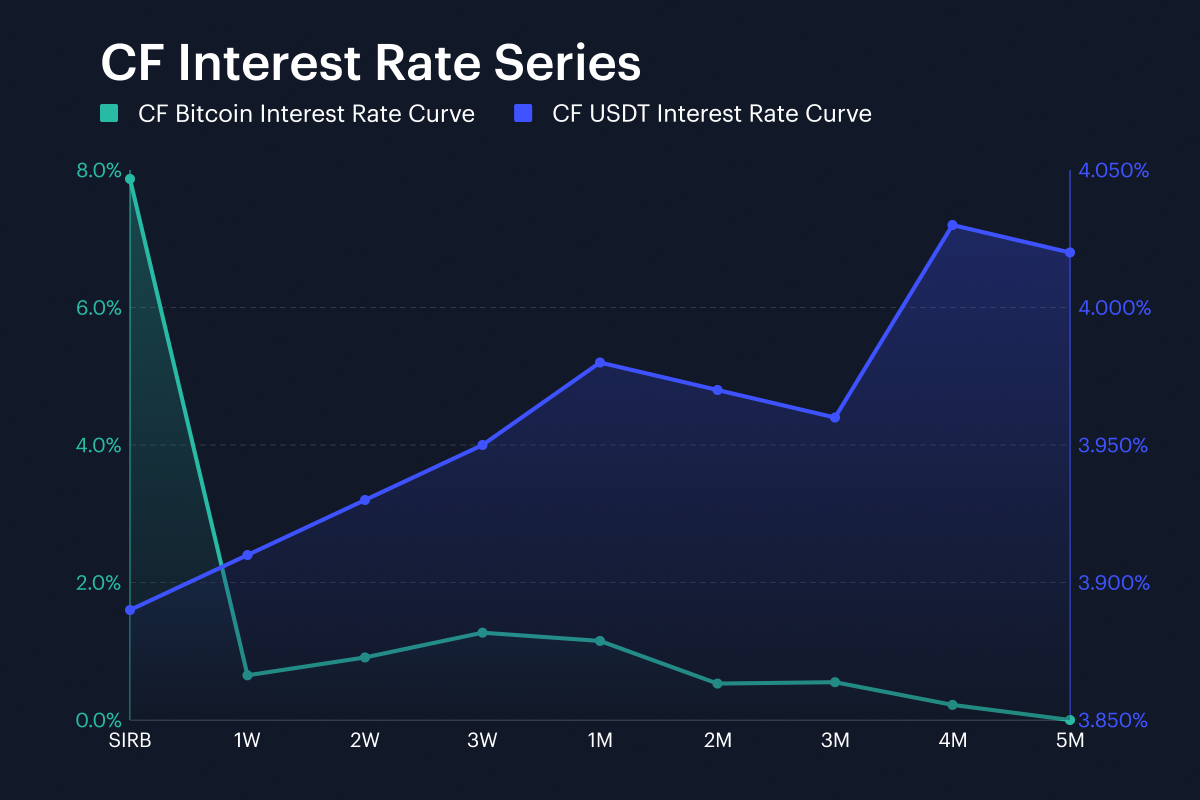
Funding conditions eased across the CF BIRC curves, with BTC’s SIRB showing the deepest slackening at-260.1 bps, while USDT’s session rate moved -129.7 bps. Prior and recent week prints were thus: BTC from 10.47% to 7.87% and USDT SIRB from 5.19% to 3.89%. Bitcoin’s 1-week rate fell only slightly less sharply, with BTC 1W moving from 3.18% to 0.65%, a -253.6 bps narrowing. The BTC curve was firmer further in, with BTC 3M rising from 0.32% to 0.55%, up 23.5 bps. This compressed the BTC 1W-minus-3M spread from 2.87% to 0.09%. In USDT, the 1W rate moved from 5.19% to 3.91%, and the 5M rate moved from 5.26% to 4.02%. Across both curves, tenor-level changes ranged from -260.1 bps to 23.5 bps. The BTC curve therefore showed front-end compression and a small back-end lift, while USDT shifted lower across every tenor by at least 123.6 bps. BTC tenor changes ranged from -260.1 bps to 23.5 bps, compared with the tighter USDT range of -129.7 bps to -123.6 bps.
The information contained within is for educational and informational purposes ONLY. It is not intended nor should it be considered an invitation or inducement to buy or sell any of the underlying instruments cited including but not limited to cryptoassets, financial instruments or any instruments that reference any index provided by CF Benchmarks Ltd. This communication is not intended to persuade or incite you to buy or sell security or securities noted within. Any commentary provided is the opinion of the author and should not be considered a personalised recommendation. Please contact your financial adviser or professional before making an investment decision.
Note: Some of the underlying instruments cited within this material may be restricted to certain customer categories in certain jurisdictions.
Softer CPI Reprices July Hike Risk & Lifts Digital Assets
Digital assets extended their recovery over the past week as cooler US inflation prints repriced Fed expectations; the bid was broad across the large cap indices, growth factor leadership returned, stablecoin funding repriced lower, and stress stayed isolated in names hit by token-specific news.

Mark Pilipczuk
Notice of the Demising of CF Dai-Dollar Settlement Price and Spot Rate
The Administrator announces that it will demise the CF Dai-Dollar Settlement Price (DAIUSD_RR) and CF Dai-Dollar Spot Rate (DAIUSD_RTI) which are members of the CF Digital Asset Index Family.
CF Benchmarks
Addition of the Tether Gold Settlement Price and Spot Rate to the CF Digital Asset Index Family
The Administrator announces the addition of the Tether Gold Settlement Price and Spot Rate to the CF Digital Asset Index Family - Single Asset Series.
CF Benchmarks
By clicking Accept, you consent to CF Benchmarks's use of cookies.
Visit Cookie Settings to learn how CF Benchmarks uses cookies and to adjust your preferences.