
Mar 30, 2026
Weekly Index Highlights, March 30, 2026
Market Performance Update
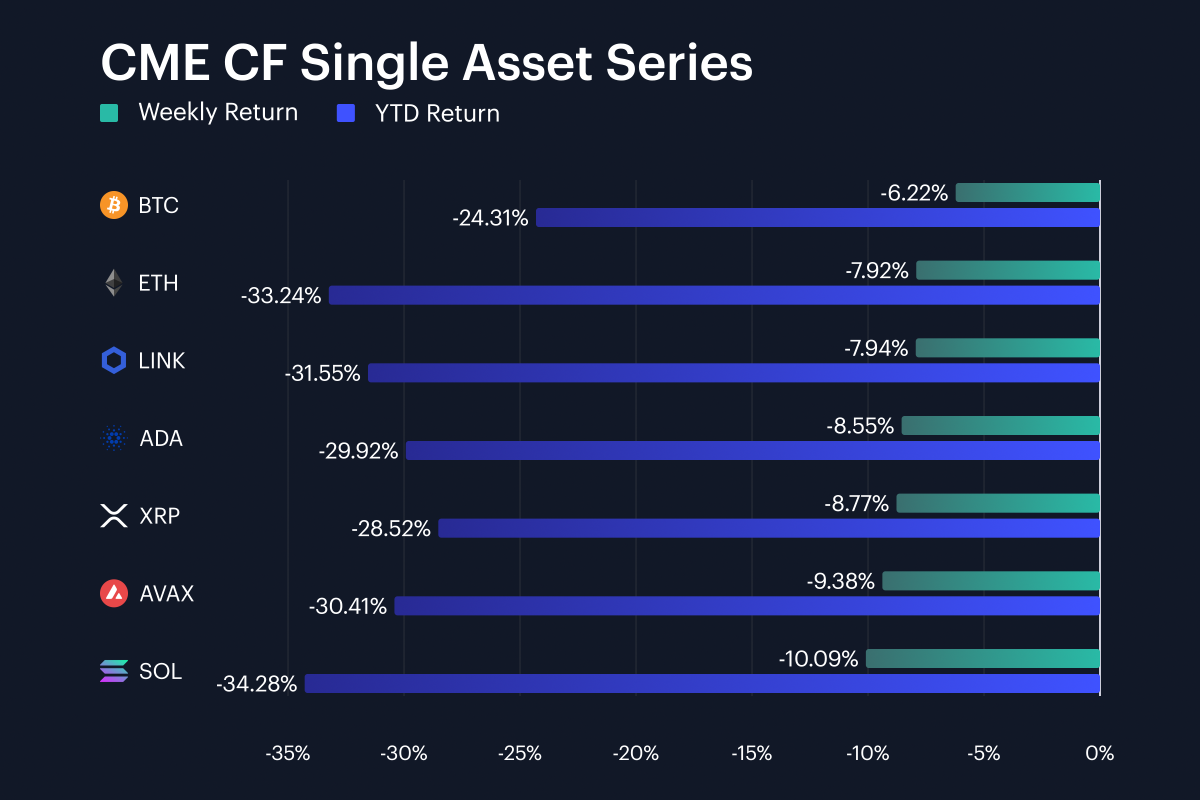
Digital assets extended their losing streak into a third consecutive week, though the pace of selling moderated relative to the prior period. Bitcoin declined 6.2% week-on-week (w/w) through Sunday, March 29th, bringing its year-to-date (YTD) loss to 24.3%, compared with a 6.5% weekly drop the week before. Ether fell 7.9% w/w, nudging its YTD drawdown to 33.2%. Solana was the weakest of the major names, losing 10.1% w/w and now sitting at -34.3% YTD. That left the single-asset basket spanning -6.2% to -10.1% on the week, a 3.9% range between best and worst that is virtually identical to the prior week’s 4.0% spread. While the narrower weekly losses across most names might tempt observers to call a stabilization, every asset in the basket still posted a deeper YTD drawdown than it held seven days earlier. BTC’s relative outperformance of 1.7% versus ETH and 3.9% versus SOL continues to reinforce the liquidity and quality premium that has characterized the sell-off since late January.
Volatility Analysis
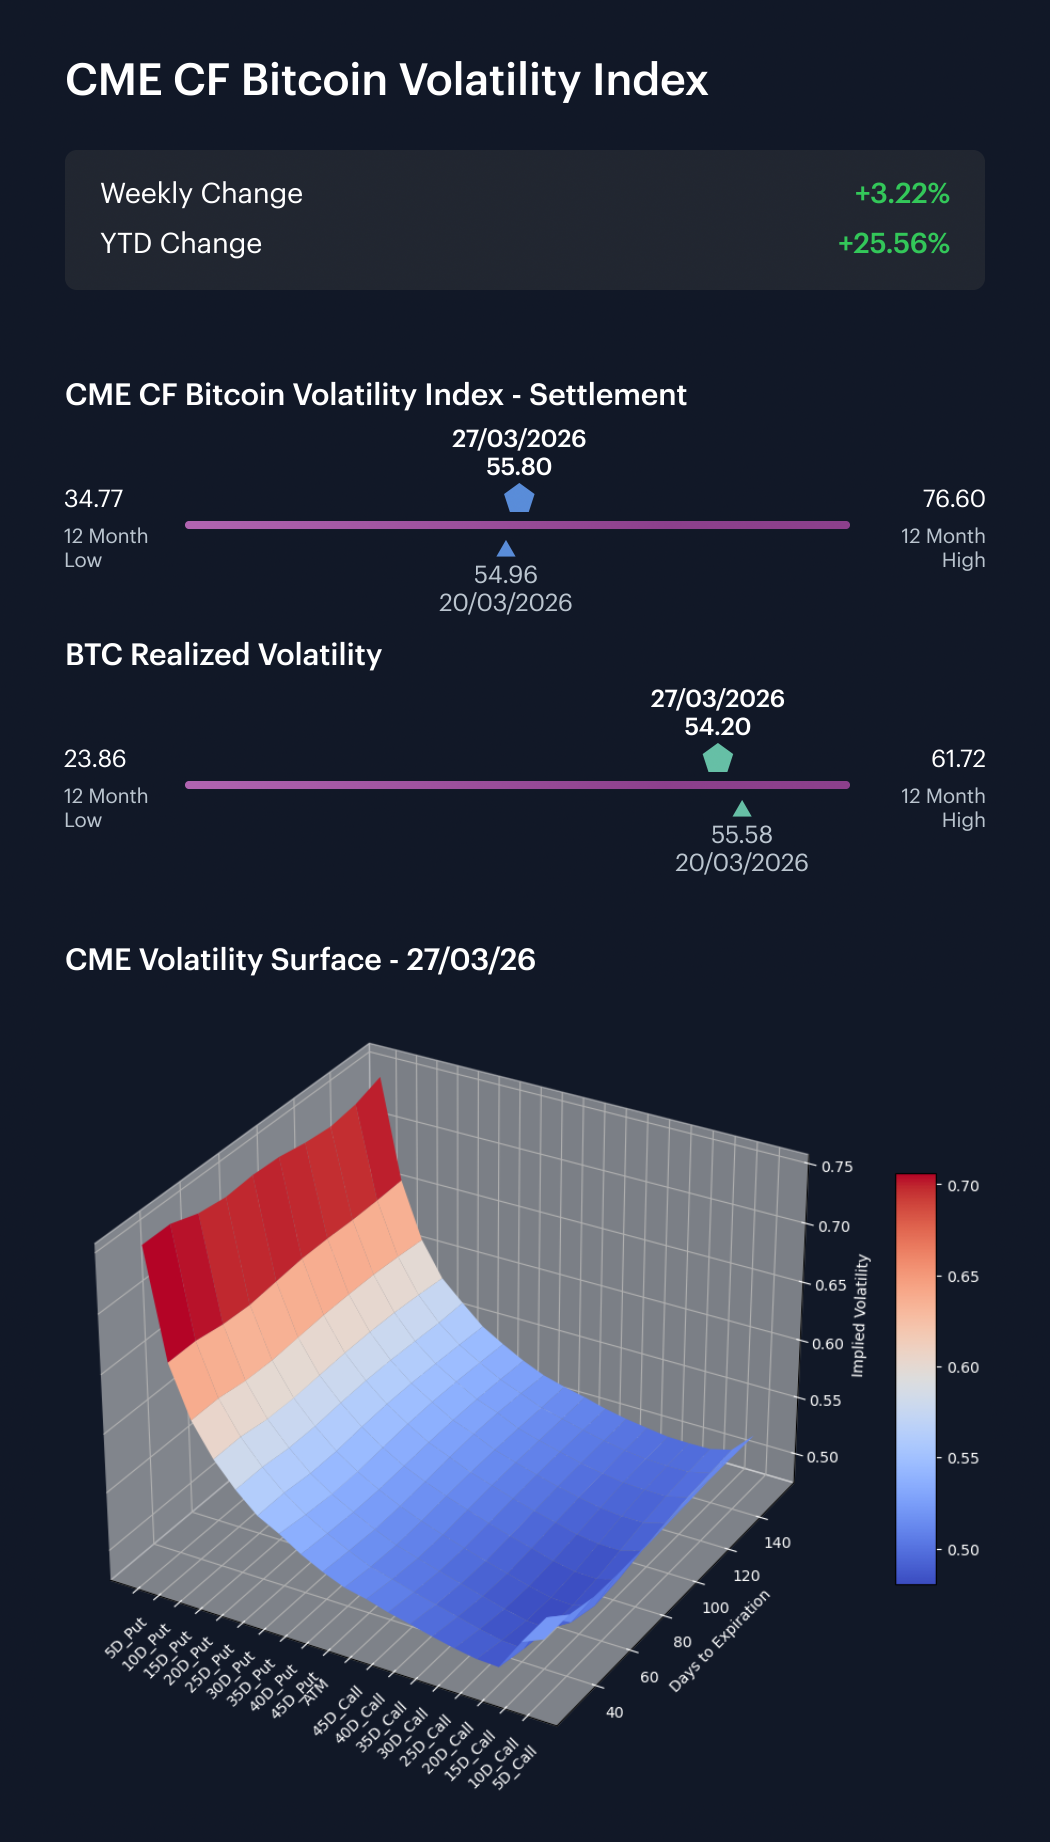
Bitcoin volatility sent a mixed signal this week, with implied edging higher while realized pulled back. The CME CF Bitcoin Volatility Index (BVXS) closed Friday, March 27th at 55.80, up 0.84 vol. points from 54.96 the previous Friday. Realized volatility, meanwhile, moved in the opposite direction, declining from 55.58 to 54.20, a fall of 1.38 vol. points. That shift re-established an implied premium of 1.60 points over realized, reversing last week’s configuration in which realized had overtaken implied by 0.62 points. The swing in the spread amounts to 2.22 vol. points in a single week. In context, this pattern suggests that the options market is pricing in elevated uncertainty looking forward even as the pace of spot-level turbulence has modestly cooled. Whereas last week’s narrative was one of realized catching up with implied, the latest snapshot shows implied pulling ahead again, which is more consistent with hedging demand and directional positioning than with purely reactive spot repricing. Both measures remain comfortably above 54, well within the upper half of the trailing twelve-month range (34.77 to 76.60 for BVXS), so conditions remain elevated relative to longer-run norms.
Market Cap Index Performance
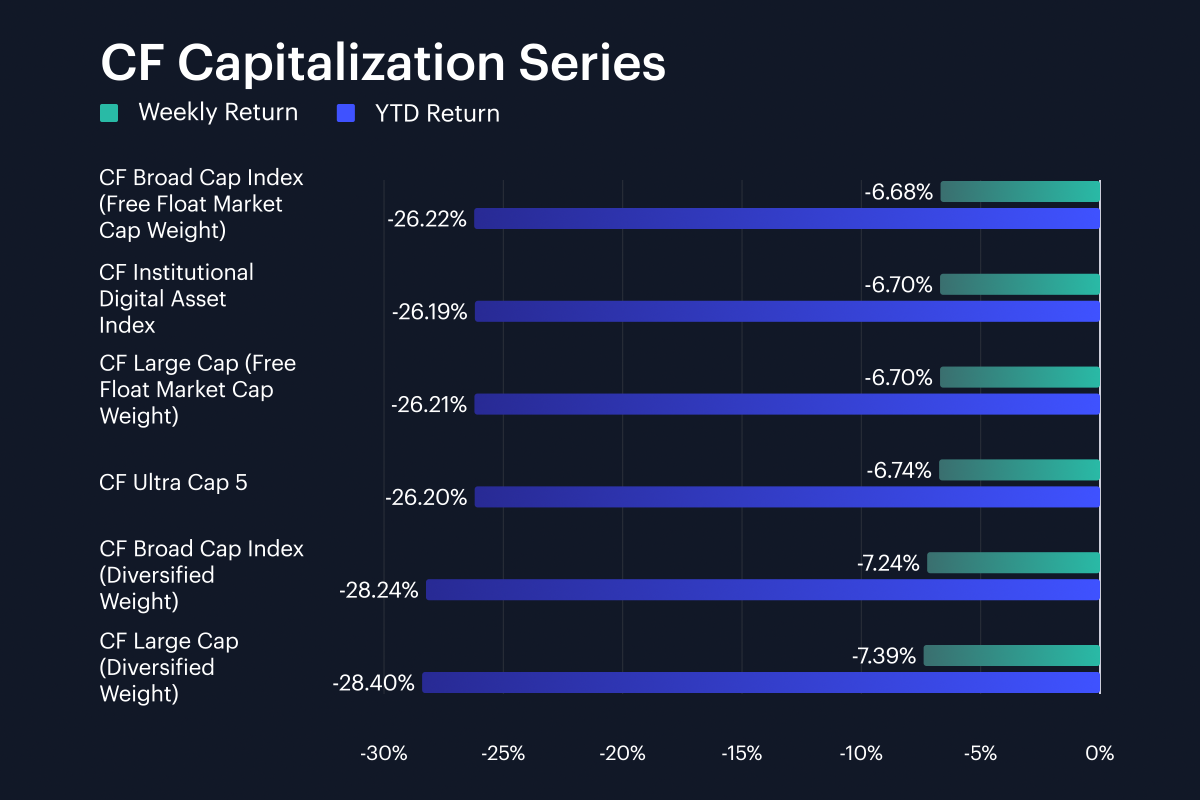
Market-cap indices continued to move in formation, though the spread between best and worst widened modestly from the prior week. CF Ultra Cap 5 fell 6.7% w/w to bring its YTD return to -26.2%, while the CF Institutional Digital Asset Index and CF Large Cap Index (Free Float Market Cap Weight) both declined 6.7%, matching on both weekly and year-to-date performance at approximately -26.2%. The CF Broad Cap Index (Free Float Market Cap Weight) also printed -6.7% on the week for a -26.2% YTD loss. Diversified-weight variants lagged once more: the CF Large Cap (Diversified Weight) fell 7.4% w/w, and the CF Broad Cap (Diversified Weight) lost 7.2%. Across the full set, weekly returns ranged from approximately -6.7% to -7.4%, a spread of about 0.7 %, modestly wider than last week’s 0.64 % gap. The diversified-weight Large Cap lagged its free-float counterpart by 0.68 %, while the Broad Cap divergence was 0.56 %. The persistent underperformance of diversified-weight versions relative to free-float continues to underscore the mega-cap quality bid: in a market still pressing lower, investors are expressing a clear preference for the deepest liquidity pools, and any index methodology that spreads weight more evenly across constituents is absorbing incrementally more damage.
Factor Analysis
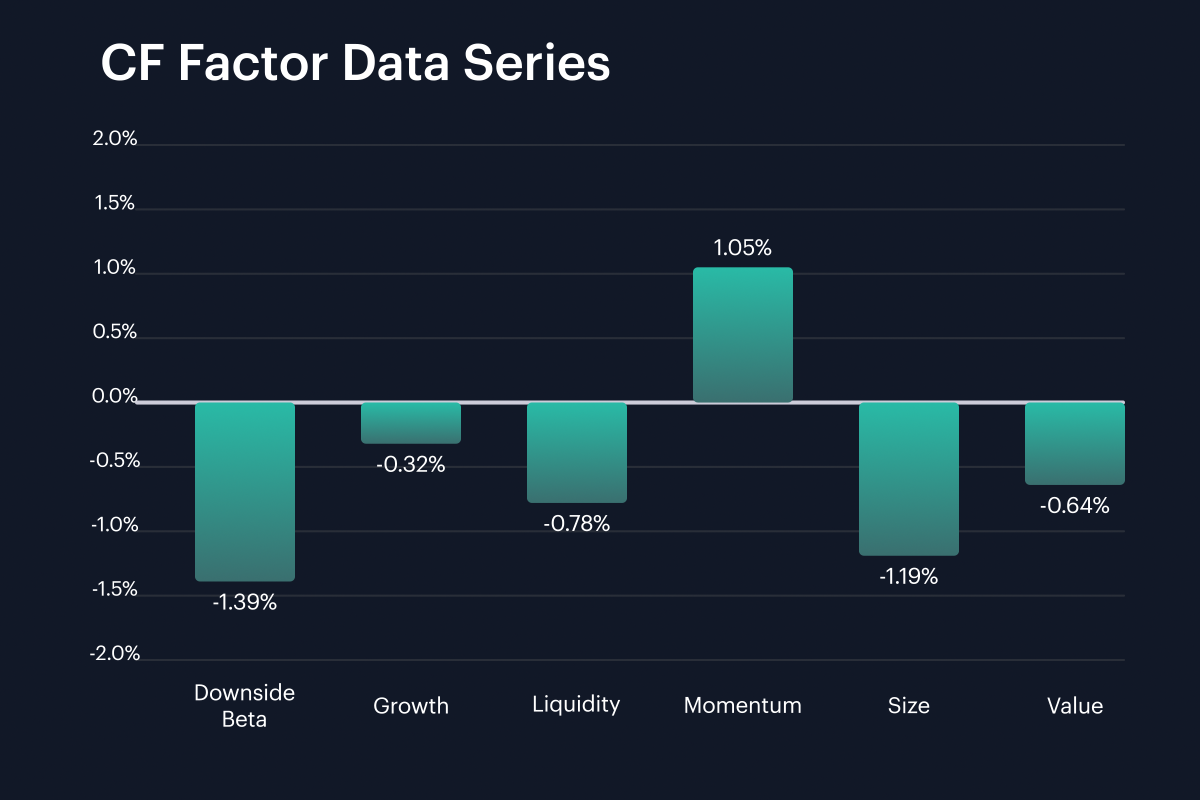
Factor returns shifted once again this week, with the prior week’s Momentum leadership fading and Downside Beta reverting deeper into negative territory. Downside Beta posted -1.39% for the week, compared with -0.61% previously, a 0.78 % deterioration that signals a return of the defensive skew that had eased only one week earlier. Momentum remained positive at 1.05%, though it narrowed from last week’s +1.31%, a 0.26 % decline. Growth printed -0.32%, broadly in line with the prior week’s -0.36%, suggesting no meaningful rotation into or out of growth-oriented names. Liquidity was negative at -0.78%, a sharp move from +0.11% previously, a 0.89 % swing that indicates the market’s liquidity premium came under pressure. Size printed -1.19%, worsening from +0.51%, a 1.70 % reversal that suggests smaller-cap constituents bore disproportionate selling pressure after briefly outperforming. Value moved to -0.64%, improving from -1.68%, a 1.04 % recovery. The overall factor range spans +1.05% (Momentum) to -1.39% (Downside Beta), a 2.44 % spread. Read together, the picture is one of renewed defensiveness: Downside Beta’s deeper negative print and the reversal of Size and Liquidity imply that the prior week’s hints of broadening were premature, with flows re-concentrating into higher-quality, more liquid names.
Classification Series Analysis
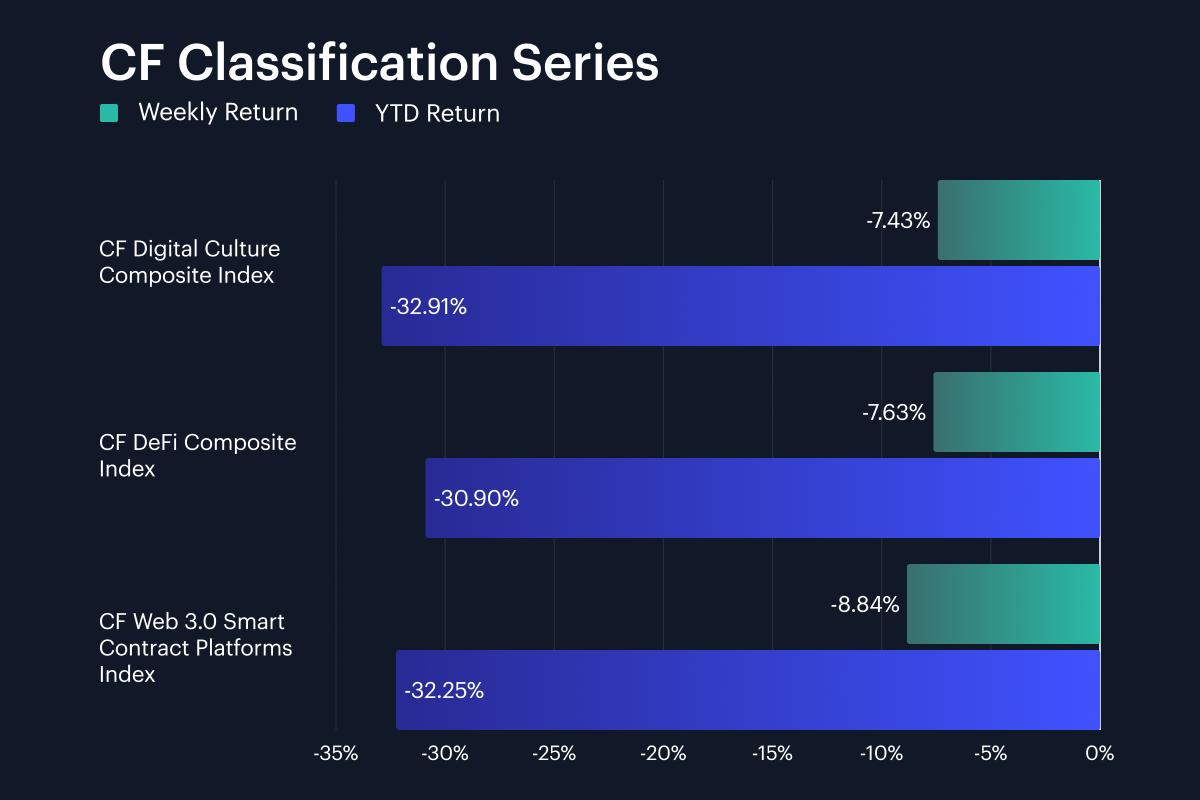
Within the CF Classification Series, all three thematic baskets declined again, though the ordering shifted from the prior week. The CF Digital Culture Composite Index fell 7.4% w/w, for a YTD return of -32.9%, while the CF DeFi Composite Index lost 7.6% w/w, bringing its YTD drawdown to -30.9%. The CF Web 3.0 Smart Contract Platforms Index was the weakest of the three at -8.8% w/w and -32.2% YTD. The spread between the best and worst weekly performers was 1.4 %, tighter than last week’s 2.0 % gap, which continues the trend of compressed downside dispersion within the theme complex. The notable rotation here is that Web 3.0 Smart Contract Platforms, which had been the relative outperformer the week before at -9.1%, became the laggard this week at -8.8%. Culture’s comparatively shallower -7.4% loss represents an improvement from -9.9% the prior week, while DeFi’s -7.6% also moderated from -11.1%. In aggregate, the classification tape remains directionally negative with diminishing differentiation between themes, implying that selling pressure is hitting protocol beta, cultural exposure and DeFi with roughly equal force rather than concentrating in any single vertical.
Sector Analysis
Sector performance across the CF Digital Asset Classification Structure (CF DACS) was once again uniformly negative, but the ordering of Sub-Categories produced a somewhat different ranking than the prior week. Non-Programmable was the best-performing Sub-Category with an average weekly return of -4.2%, led by XLM at -0.1% and BCH at -2.6%. Infrastructure averaged -4.6%, with TAO’s 10.8% gain and FET’s 6.5% rise in the Computing sub-sector providing a notable bright spot against the otherwise negative tape. Culture averaged -5.4%, an improvement from -10.3% the prior week, while Finance posted -6.5%. Programmable averaged -9.2%, and Utility was the weakest at -10.0%, a sharp reversal from last week when it had been the best-performing Sub-Category at -1.9%. The spread between the best and worst major Sub-Categories was 5.8 %, narrower than the prior week’s 8.4 % range. Within the constituent set, the gap between TAO at +10.8% and DOT at -13.0% produced a range of returns that spanned roughly 23.8%, well below the 41.8 % range seen the week before, indicating that idiosyncratic dispersion compressed alongside the broader sell-off. The AI and computing narrative’s relative strength within Infrastructure is the clearest thematic signal this week, while Utility’s slide from best to worst suggests that last week’s outperformance may have been more noise than durable rotation.
CF Staking Series
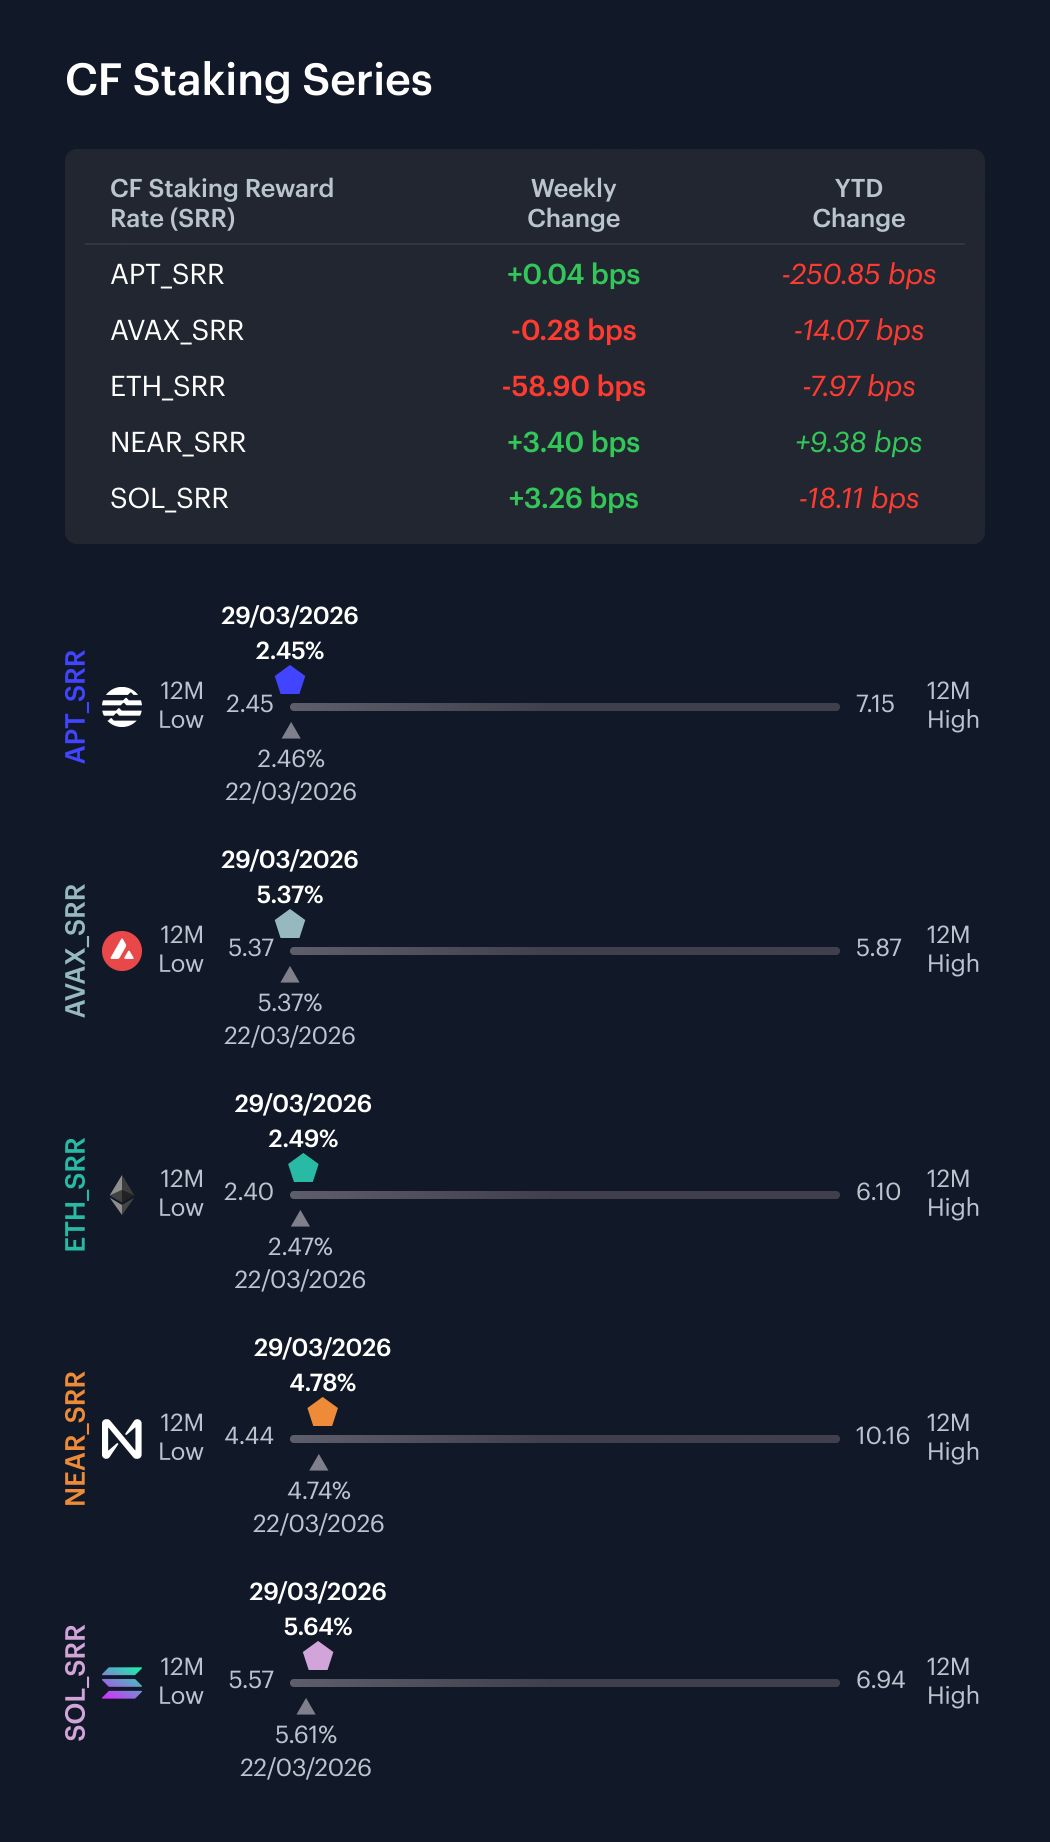
Within the CF Staking Series, conditions were markedly calmer this week compared with the prior period’s APT-driven dislocation. APT Staking was essentially flat on the week, gaining 0.02% w/w after last week’s -50.7% collapse; its reward rate edged up by 0.04 bps to 2.45%, barely changed from the post-reset level of 2.46%. AVAX Staking ticked down -0.05% w/w with a reward rate decline of 0.28 bps. ETH Staking posted a 19.1% weekly decline, which was by far the largest move in the complex this week, with its reward rate moving from 3.08% to 2.49%. SOL Staking gained 0.58% w/w, with its reward rate rising from 5.61% to 5.64%, up 3.26 bps. NEAR Staking was the strongest performer at +0.72% w/w, with a reward rate increase of 3.40 bps to 4.78%. Setting aside ETH’s notable weekly decline, the remaining staking series sat within a tight range, pointing to broadly stable yield conditions. The ETH Staking return figure warrants monitoring over the coming week for any structural shift in staking economics.
Interest Rate Analysis
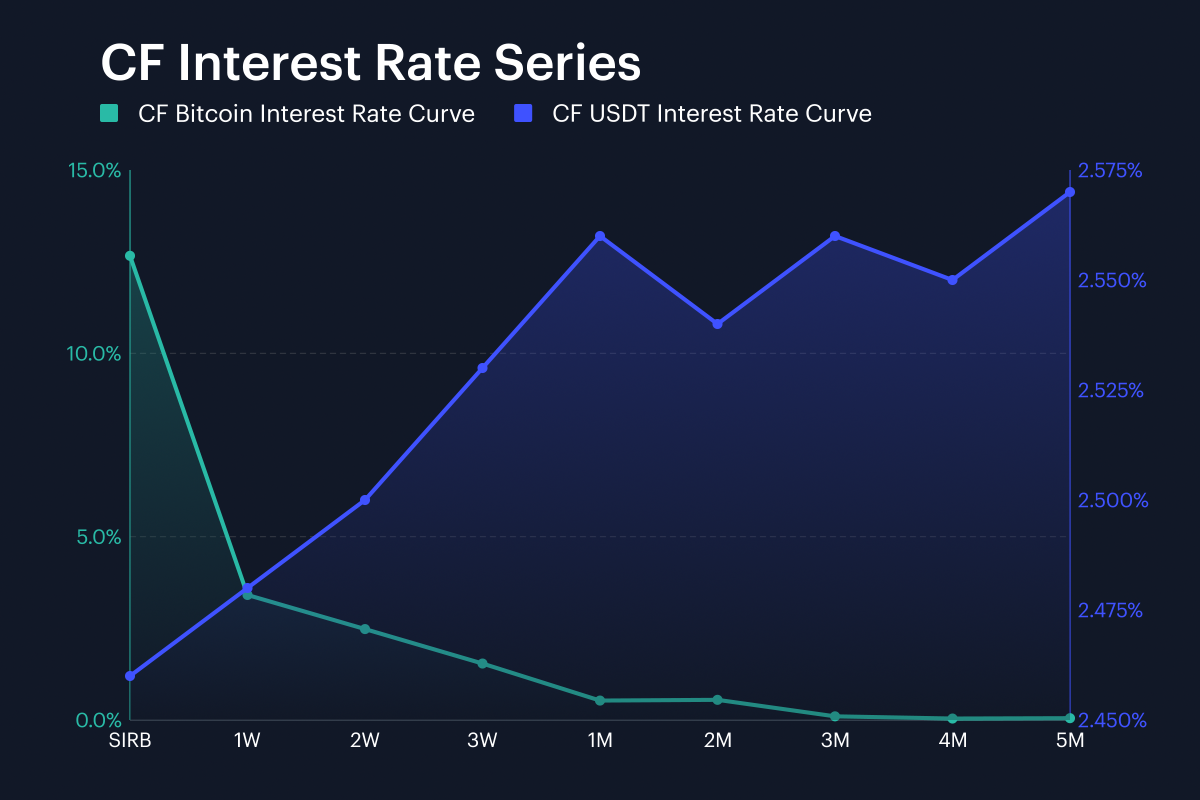
Across our CF BIRC curves, Bitcoin funding conditions displayed a more pronounced front-end premium this week, while USDT rates held largely steady. The Session Interest Rate for Bitcoin (SIRB) moved from 10.53% at the end of the prior week to 12.66%, an increase of 213.4 bps that reverses most of the prior week’s 84.2 bps decline. The BTC 1W rate more than doubled from 1.53% to 3.41%, a 188.4 bps jump, while BTC 3M fell from 0.30% to 0.10%, down 19.7 bps, leaving the front-end gap between 1W and 3M at 3.31 %, a significant widening from the 1.23% gap one week earlier. BTC 2M was virtually unchanged at 0.55%. The term structure thus steepened materially at the front end, with the kink identified last week becoming more pronounced. In USDT funding, the session rate edged higher from 2.36% to 2.46%, up 10.0 bps, with the 1W rate at 2.48% and 3M at 2.56%, implying a flat but gently upward-sloping curve. Across both curves, the most striking development is the re-acceleration of short-dated BTC funding, which at 12.66% on the session rate suggests elevated demand for leveraged long positioning or short-term borrowing, even as the longer-dated BTC curve remained subdued. The contrast with USDT’s calm, marginally higher trajectory underscores the distinct dynamics at work in native crypto funding versus dollar stablecoin markets.
The information contained within is for educational and informational purposes ONLY. It is not intended nor should it be considered an invitation or inducement to buy or sell any of the underlying instruments cited including but not limited to cryptoassets, financial instruments or any instruments that reference any index provided by CF Benchmarks Ltd. This communication is not intended to persuade or incite you to buy or sell security or securities noted within. Any commentary provided is the opinion of the author and should not be considered a personalised recommendation. Please contact your financial adviser or professional before making an investment decision.
Note: Some of the underlying instruments cited within this material may be restricted to certain customer categories in certain jurisdictions.
Changes to the Token Market Price Benchmarks Series - Market Prices – 21 July 2026
The Administrator has confirmed changes to the Token Market Price Family for the period 14 July 2026 to 21 July 2026.

CF Benchmarks
Softer CPI Reprices July Hike Risk & Lifts Digital Assets
Digital assets extended their recovery over the past week as cooler US inflation prints repriced Fed expectations; the bid was broad across the large cap indices, growth factor leadership returned, stablecoin funding repriced lower, and stress stayed isolated in names hit by token-specific news.
Mark Pilipczuk
Notice of the Demising of CF Dai-Dollar Settlement Price and Spot Rate
The Administrator announces that it will demise the CF Dai-Dollar Settlement Price (DAIUSD_RR) and CF Dai-Dollar Spot Rate (DAIUSD_RTI) which are members of the CF Digital Asset Index Family.
CF Benchmarks
By clicking Accept, you consent to CF Benchmarks's use of cookies.
Visit Cookie Settings to learn how CF Benchmarks uses cookies and to adjust your preferences.