
Mar 23, 2026
Weekly Index Highlights, March 23, 2026
Market Performance Update
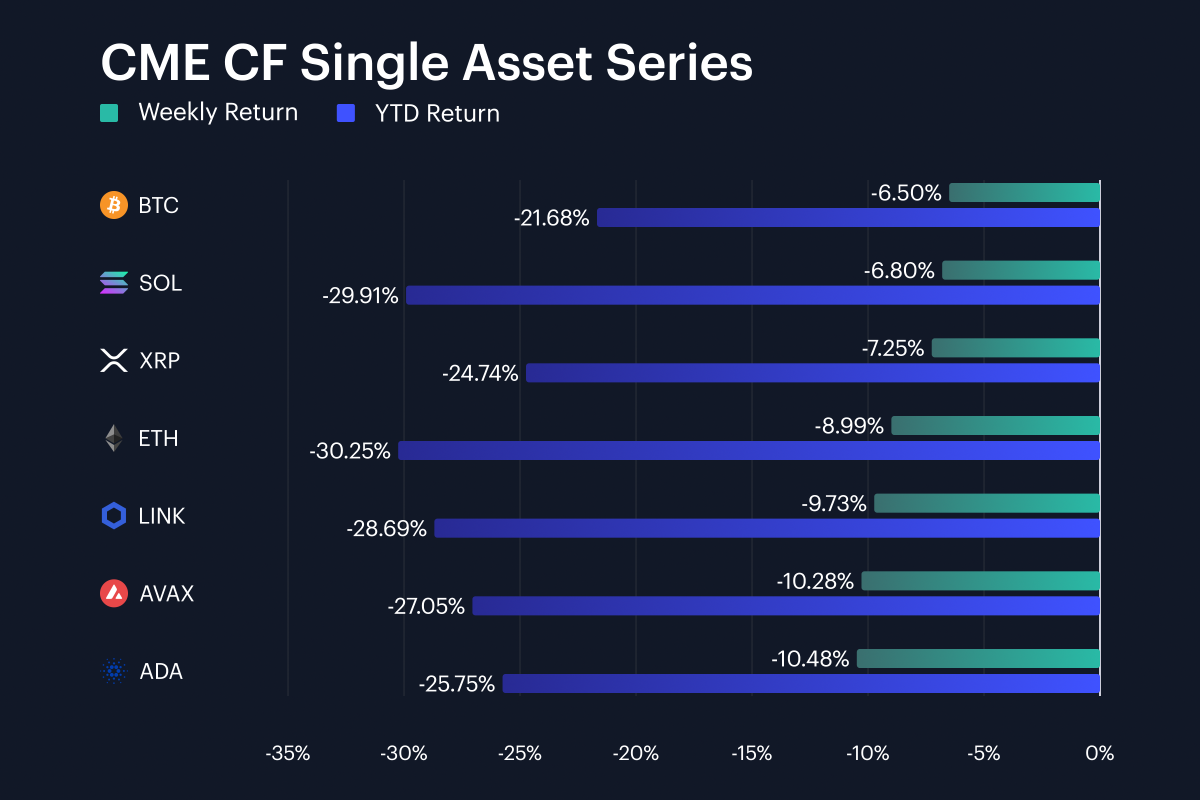
Digital assets posted another negative week, although the drawdown was not uniform across the single-asset set. Bitcoin fell 6.5% week-on-week (w/w) and was down 21.7% year-to-date (YTD) by Sunday, March 22nd, while Ether lost 9.0% w/w extending its YTD decline to 30.3%. Losses extended across major layer-1s and large-cap alts: Solana and XRP declined 6.8% and 7.2%, while Chainlink, Avalanche and Cardano fell 9.7%, 10.3% and 10.5%. That left the basket spanning -6.5% to -10.5% on the week, with BTC the relative outperformer and ADA the weakest print. A 4.0 percentage-point gap between the best and worst performers is wide enough to show differentiation, yet the fact that all seven names finished lower indicates that the dominant move for another week was market-wide de-risking. BTC’s shallower decline versus ETH by 2.5 percentage points, and versus AVAX and ADA by more than 3.8 percentage points, also suggests investors continued to pay a premium for liquidity and balance-sheet depth, with risk edging away from higher-beta exposure.
Volatility Analysis
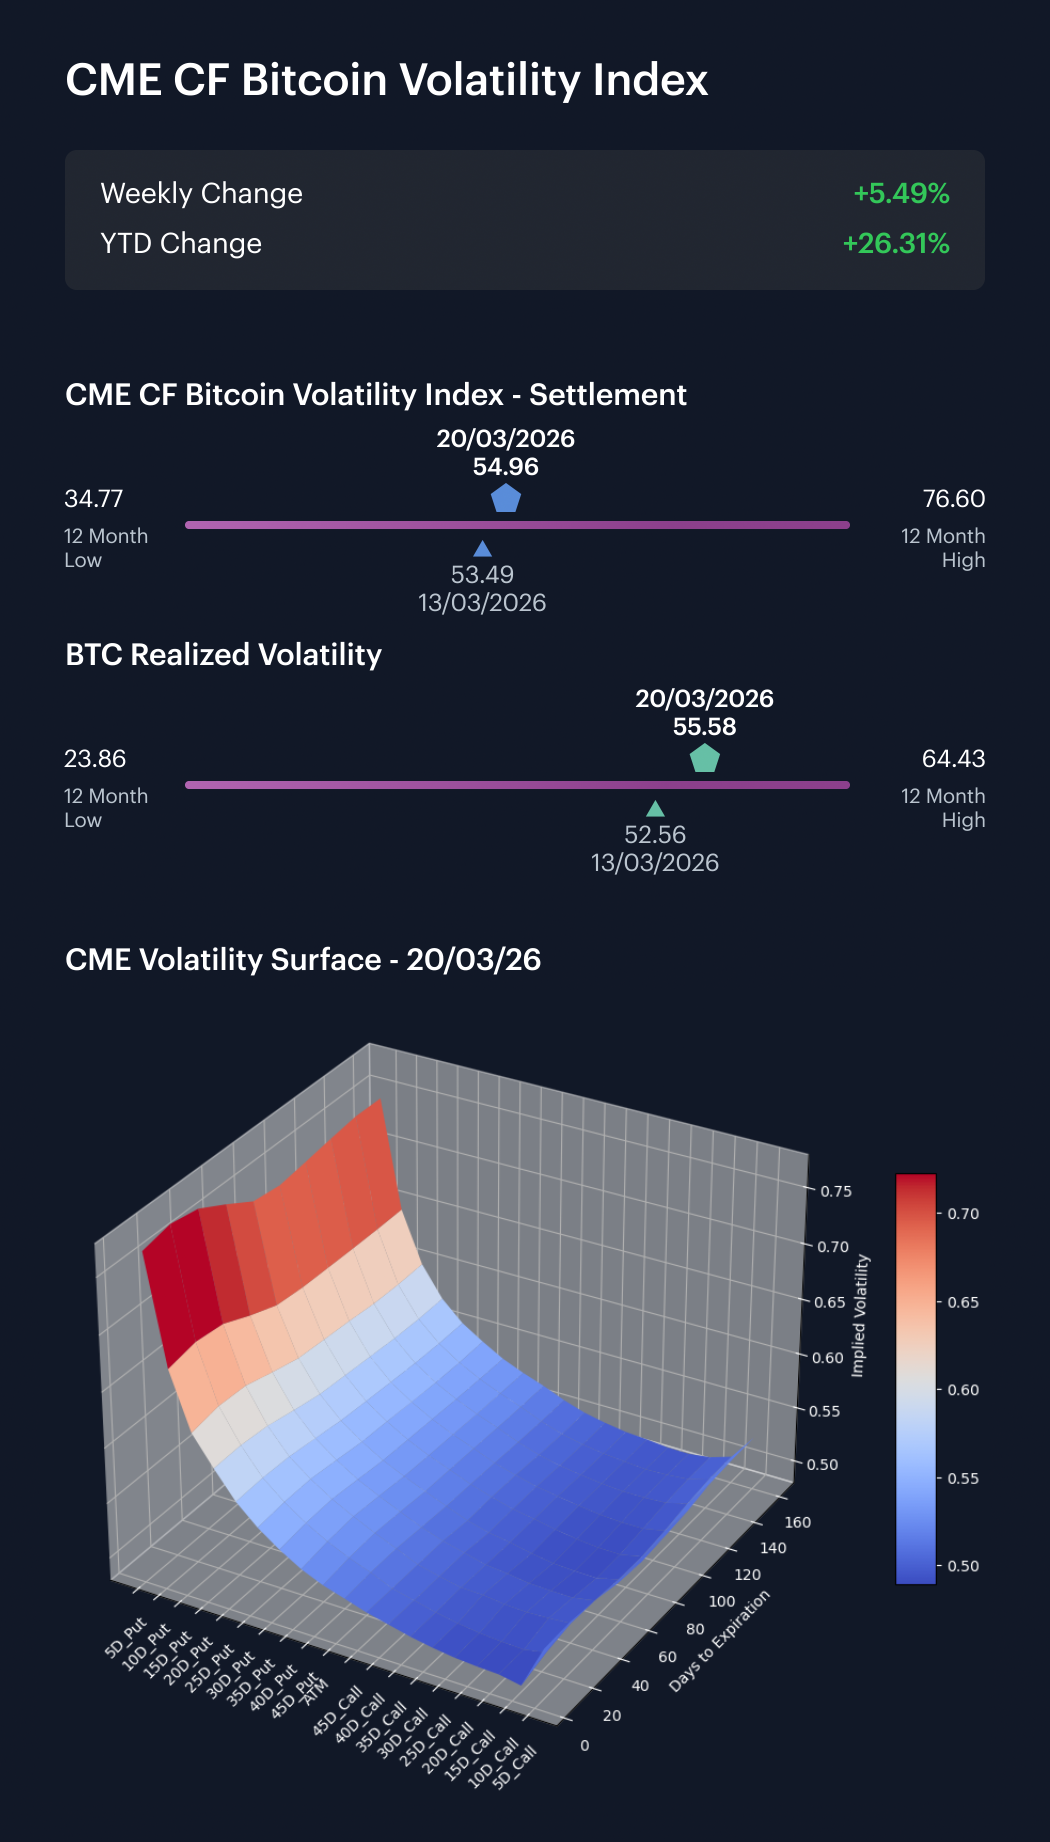
Bitcoin volatility rose in both implied and realized terms over the latest business-week snapshot, with realized moving fastest. The CME CF Bitcoin Volatility – Settlement (BVXS) went from 53.49 one week earlier to 54.96 by Friday, March 20th, a 1.47 vol.-point increase, while realized volatility rose from 52.56 to 55.58, up 3.02 vol. points. That left realized 0.62 points above implied, after implied had been 0.93 points above realized a week before. As such, the implied-realized spread flipped, swinging by 1.55 vol. points from a positive premium to a small realized-to-implied configuration. The move was sufficient enough to dispel notions of complacency. Note that both BVXS and realized landed near 55, with spot turbulence accelerating faster than options repricing, and realized catching up with and even slightly overtaking implied, despite hedging demand remaining elevated. That’s more consistent with an active spot repricing than with options alone flashing warning signals.
Market Cap Index Performance
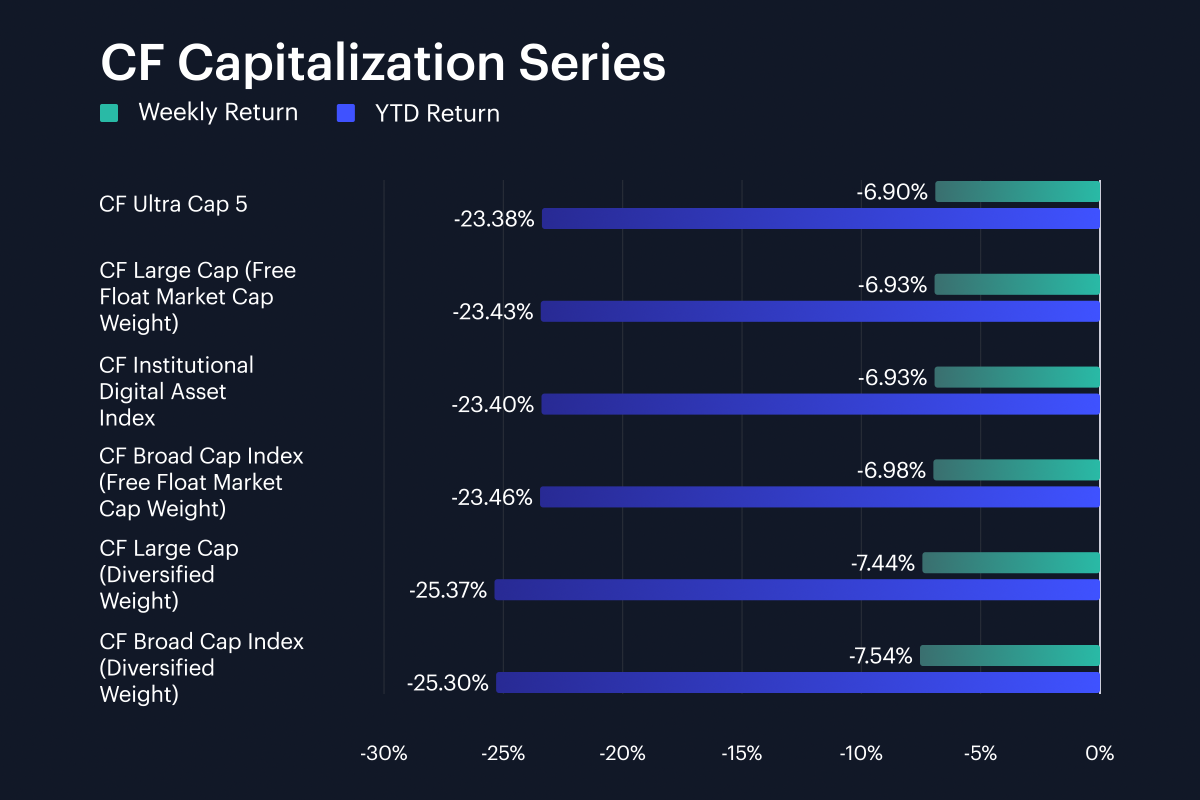
Market-cap indices moved in an unusually tight formation, reinforcing the idea that the week’s drawdown was broad and tier-agnostic; still, their performance was not entirely bereft of tell-tale signals. CF Ultra Cap 5 fell 6.9% w/w to stand at -23.4% YTD, while the CF Institutional Digital Asset Index and CF Large Cap Index (Free Float Market Cap Weight) both declined 6.9%, leaving their YTD returns also near-identical at approximately -23.4% a piece. The CF Broad Cap Index (Free Float Market Cap Weight) posted a decline slightly closer to -7.0%, while the diversified-weight CF Large Cap and CF Broad Cap versions fell 7.4% and 7.5%. Across the full capitalization set, weekly returns spanned only 0.64 percentage points, from approximately -6.9% to -7.5%. A spread that narrow reveals that outright market direction prevailed over index construction nuances, though diversified-weight variants did lag their free-float counterparts by roughly 0.51 percentage points for the CF Large Cap, and 0.56 percentage points for the CF Broad Cap. Could those gaps point to a mild mega-cap quality bid inside a negative week? The largest, most liquid exposures still fell materially, but broader and more evenly weighted baskets absorbed slightly more damage.
Factor Analysis
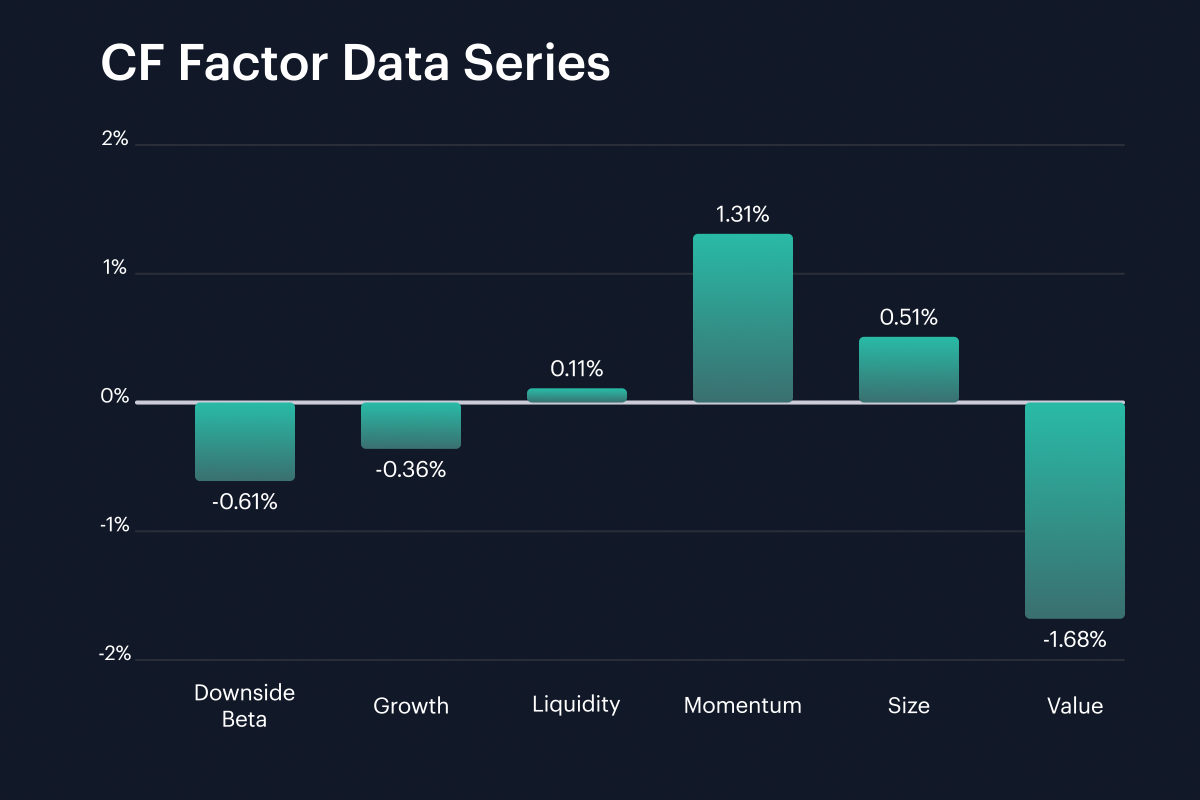
Factor returns rotated sharply away from the prior week’s defensive skew. Downside Beta moved from -2.72% in the prior week to -0.61% in the latest week, a 2.11 percentage-point tightening, while Momentum swung from -0.97% to +1.31%, an unequivocal 2.28 percentage-point turn into the positive. Size also swung into plus, from -1.45% to +0.51%, improving by 1.96 percentage points. Meanwhile, Growth’s negative return moved wider from -0.19% to -0.36%, Liquidity improved from -0.55% to +0.11%, and Value deteriorated from -0.08% to -1.68%, a 1.60 percentage-point move. The current factor set therefore spans +1.31% in Momentum to -1.68% in Value, a 2.99 percentage-point range. That combination points to a market that still rewarded trend persistence and larger-cap exposure, even as outright spot performance stayed negative, while the worsening Value print suggests cheaper or more cyclically sensitive parts of the crypto cross-section continued to absorb disproportionate pressure. Equally, the sharp reduction in the magnitude of Downside Beta’s negative print from -2.72% to -0.61% indicates that the prior week’s strong defensive skew eased materially, even if it did not disappear.
Classification Series Analysis
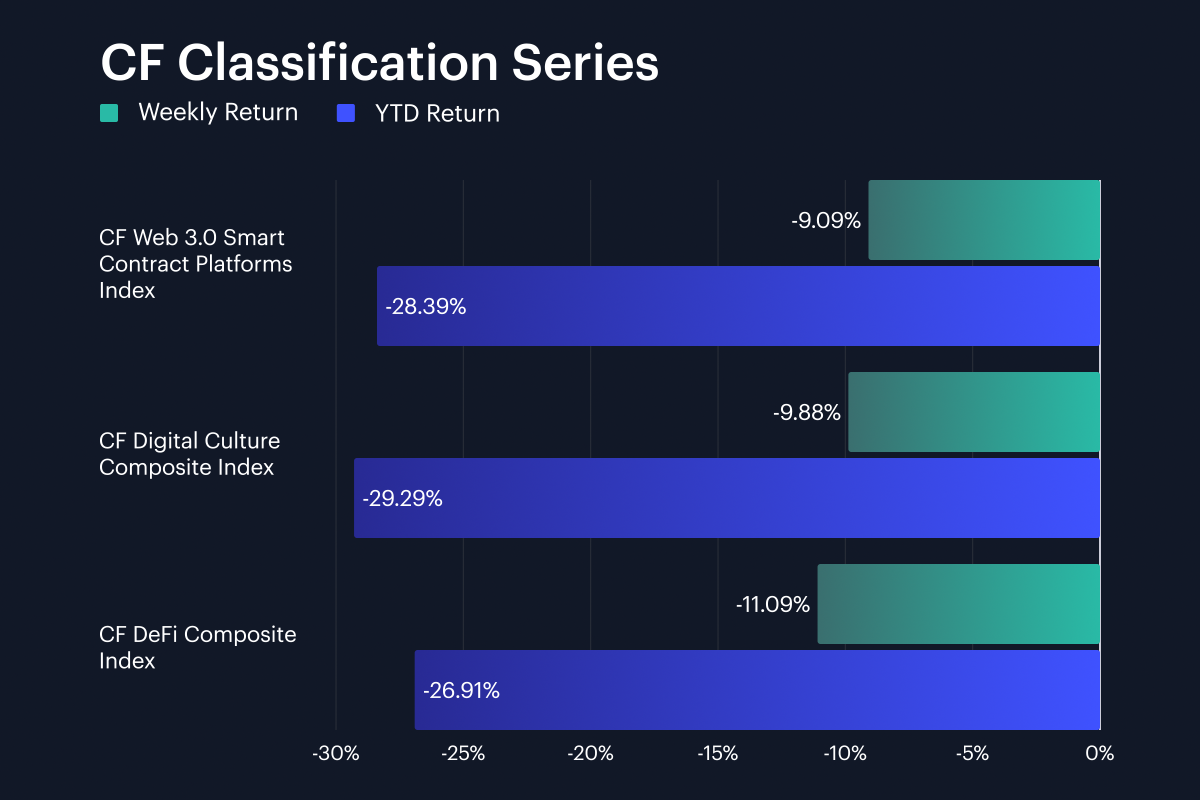
Across the CF Classification Series, all three thematic baskets declined, but the ranking was relatively tight. The CF Web 3.0 Smart Contract Platforms Index fell 9.1% w/w for a -28.4% YTD return, compared with the CF Digital Culture Composite Index at -9.9% week-on-week and -29.3% YTD, and the CF DeFi Composite Index at -11.1% w/w and -26.9% YTD. The spread between the best and worst weekly performers was therefore 2.0 percentage points, with Web 3.0 ahead of DeFi. That 2.0 percentage-point gap establishes notional leadership, but it’s still clear the instinct to head lower was stronger than any specific rotation between these themes. Also, DeFi’s weaker weekly print is worth noting, because it arrived against a still slightly better year-to-date position than for Web 3.0 and Culture, implying that the week’s selling pressure bit harder in one of the areas that had retained comparatively more value earlier in the year. In practice, the classification tape looked compressed on the downside: every basket fell between 9.1% and 11.1%. So, the market marked down protocol beta, cultural exposure and DeFi together, while only modestly rewarding relative defensiveness inside the theme complex.
Sector Analysis
Sector performance remained negative across the CF Digital Asset Classification Structure (CF DACS), but its tiers revealed a larger dispersion than was apparent in the single-asset table. Utility was the best-performing Sub-Category at -1.9% on average w/w, helped by ANKR’s 23.0% gain and BICO’s 0.9% decline, while Culture lagged with an average -10.3%, with PRIME down 18.8% and PEPE down 16.4%. Finance averaged -8.7%, Infrastructure -8.6%, Programmable -8.6% and Non-Programmable -6.2%, leaving a spread of about 8.4 percentage points between the best and worst major Sub-Categories. Within that, the gap between Utility’s ANKR at +23.0% and Culture’s PRIME at -18.8% produced a constituent range of 41.8 percentage points, underscoring that idiosyncratic dispersion remained available even inside an otherwise weak tape. Nevertheless, the location of the averages matters more than the outliers: five of the six Sub-Categories printed between -6.2% and -10.3%, which points to a generalized retreat from higher-beta thematic exposure, while Utility’s shallower -1.9% print suggests investors were more selective where token utility and infrastructure-linked narratives were clearer.
CF Staking Series
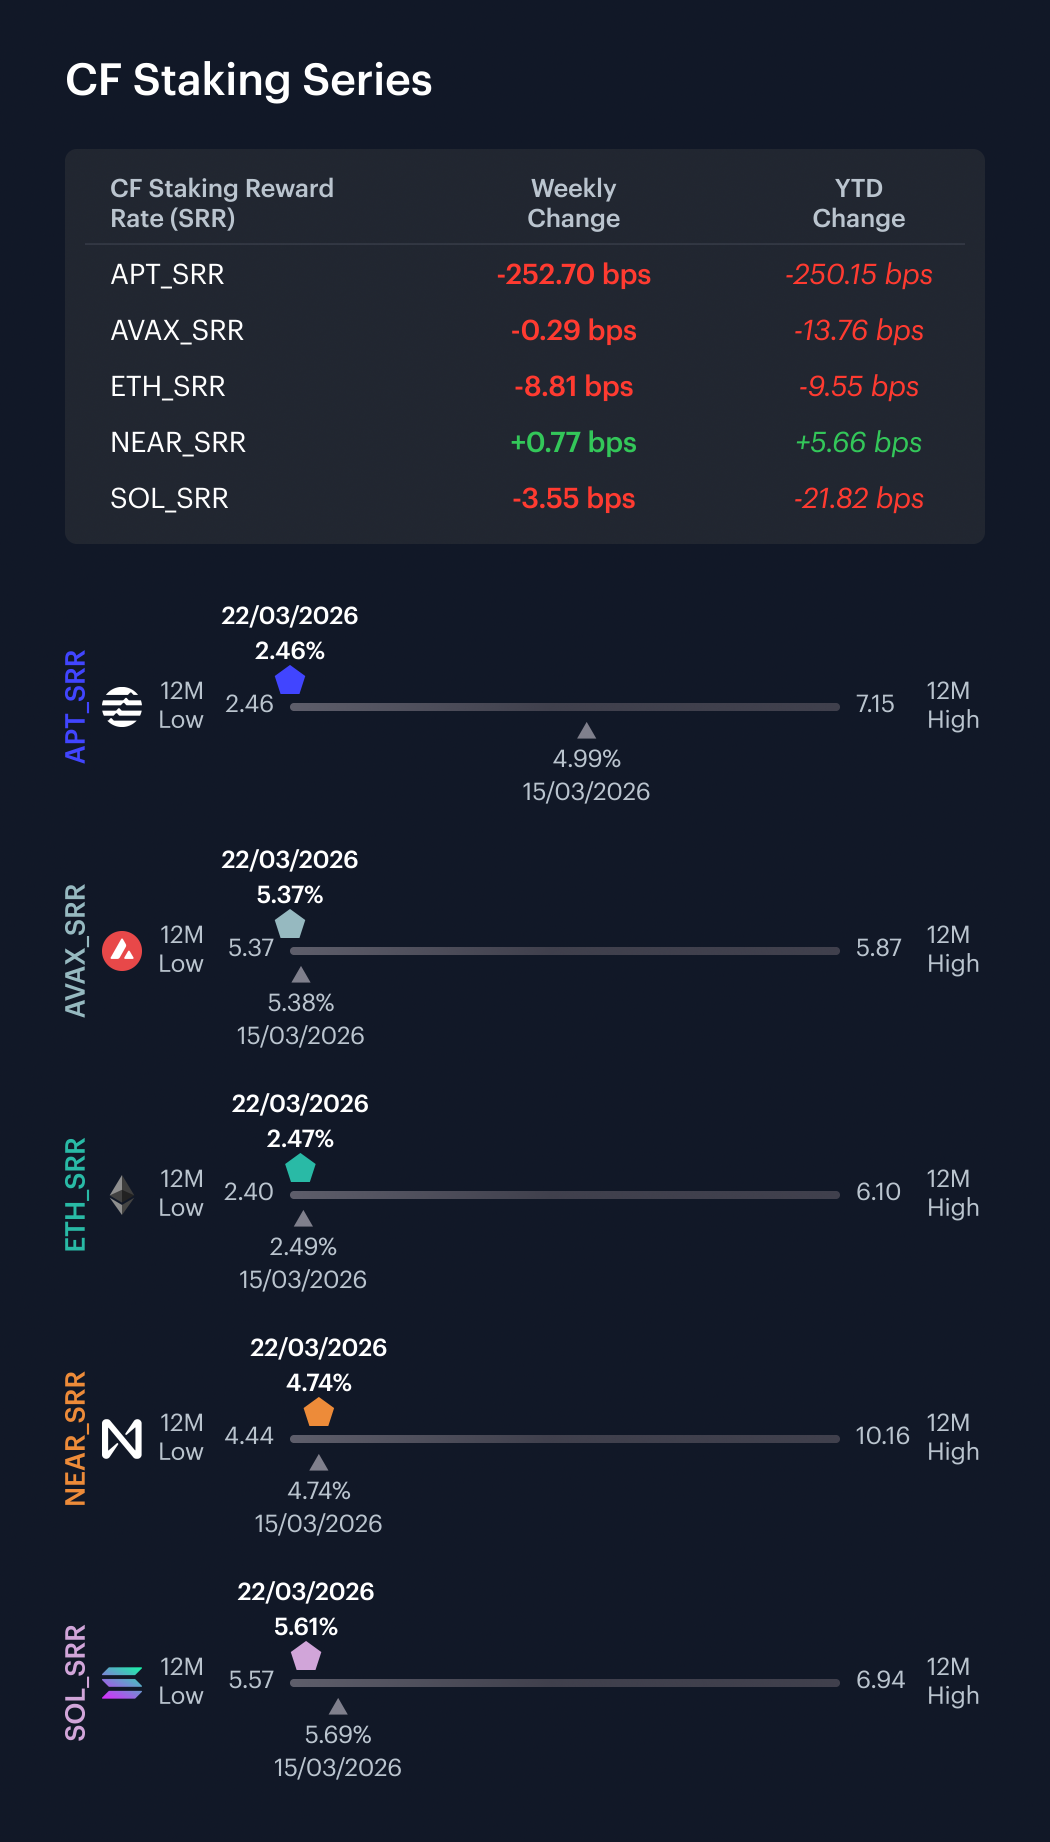
Within the CF Staking Series, APT Staking was the clear outlier, returning -50.7% week-on-week. Between March 16th and March 22nd, its reward rate moved from 4.9884% to 2.4614%, a drop of 252.7 basis points. AVAX Staking was effectively flat at -0.1% week-on-week. Its reward rate moved from 5.3778% to 5.3749%, a decline of 0.3 basis points. ETH Staking returned -3.4% week-on-week, with a reward rate move from 2.5611% to 2.4730%, a fall of 8.8 basis points. NEAR Staking gained 0.2% week-on-week, while SOL Staking fell 0.6% week-on-week. NEAR’s reward rate moved from 4.7307% to 4.7384%, up 0.8 basis points, and SOL’s moved from 5.6419% to 5.6064%, down 3.6 basis points. Excluding APT’s 252.7 basis-point step-down, the rest of the complex sat in a much narrower band from -8.8 basis points to +0.8 basis points. All told, largely stable staking conditions outside a single protocol-specific repricing.
Interest Rate Analysis
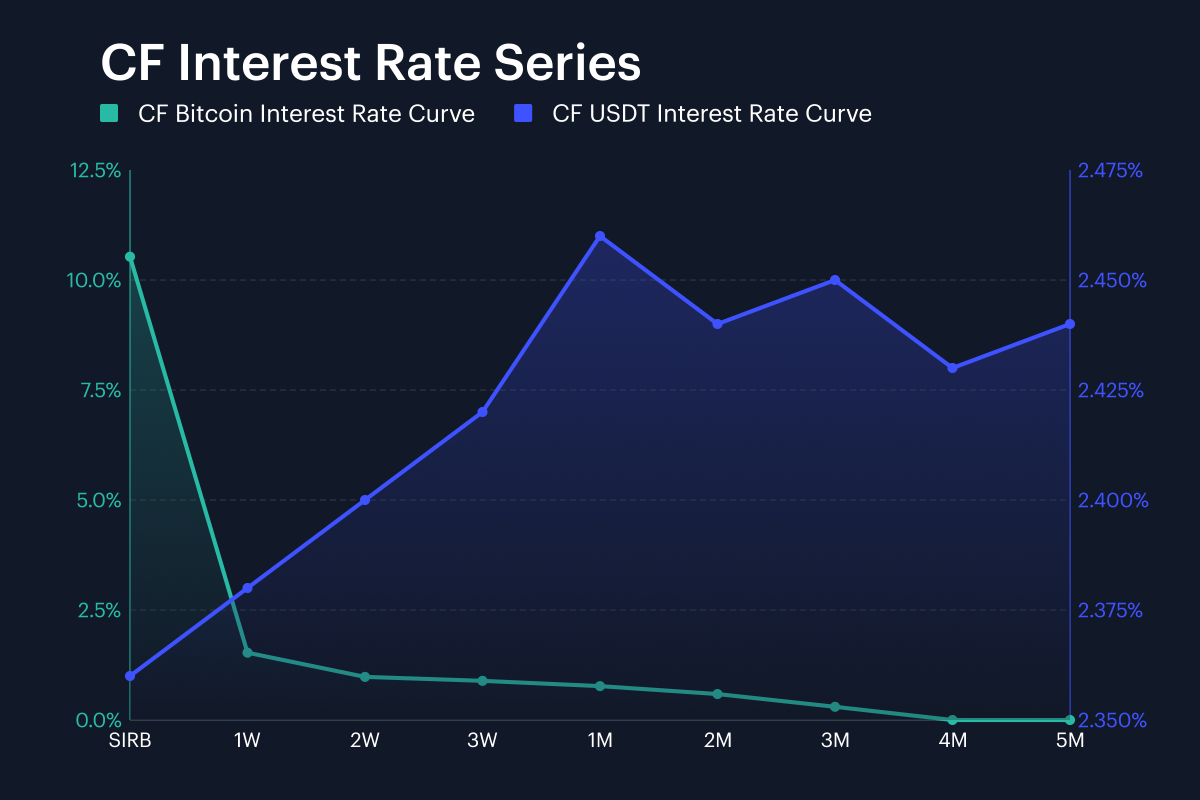
Funding conditions once again diverged across our CF BIRC curves, with Bitcoin’s exhibiting a front-end kink, and USDT’s repricing higher across almost the entire term structure. The Session Interest Rate for Bitcoin (SIRB) moved from 11.37% at the end of the prior week to 10.53% at the close of the most recent week, down 84.2 basis points. Inside the curve, however, BTC 1W rose from 0.55% to 1.53%, a 97.8 basis-point jump, while BTC 3M fell from 0.46% to 0.30%, down 15.3 basis points. That left the front-end gap between 1W and 3M at 1.23 percentage points, versus 0.09 percentage points a week earlier. In USDT funding, the session rate increased from 2.25% to 2.36%, up 10.8 basis points, and the 1W to 3M sector moved from 2.27% and 2.31%, to 2.38% and 2.45%, increases of 10.6 and 13.2 basis points. Across both curves, tenor-by-tenor changes ran from -84.2 basis points in SIRB, to 97.8 basis points in 1W. The result is a clear split between a kinked BTC funding curve, and a broadly higher USDT curve. This suggests short-dated Bitcoin funding stress side by side with firmer dollar stablecoin rates further out the curve.
The information contained within is for educational and informational purposes ONLY. It is not intended nor should it be considered an invitation or inducement to buy or sell any of the underlying instruments cited including but not limited to cryptoassets, financial instruments or any instruments that reference any index provided by CF Benchmarks Ltd. This communication is not intended to persuade or incite you to buy or sell security or securities noted within. Any commentary provided is the opinion of the author and should not be considered a personalised recommendation. Please contact your financial adviser or professional before making an investment decision.
Note: Some of the underlying instruments cited within this material may be restricted to certain customer categories in certain jurisdictions.
Changes to the Token Market Price Benchmarks Series - Market Prices – 21 July 2026
The Administrator has confirmed changes to the Token Market Price Family for the period 14 July 2026 to 21 July 2026.

CF Benchmarks
Softer CPI Reprices July Hike Risk & Lifts Digital Assets
Digital assets extended their recovery over the past week as cooler US inflation prints repriced Fed expectations; the bid was broad across the large cap indices, growth factor leadership returned, stablecoin funding repriced lower, and stress stayed isolated in names hit by token-specific news.
Mark Pilipczuk
Notice of the Demising of CF Dai-Dollar Settlement Price and Spot Rate
The Administrator announces that it will demise the CF Dai-Dollar Settlement Price (DAIUSD_RR) and CF Dai-Dollar Spot Rate (DAIUSD_RTI) which are members of the CF Digital Asset Index Family.
CF Benchmarks
By clicking Accept, you consent to CF Benchmarks's use of cookies.
Visit Cookie Settings to learn how CF Benchmarks uses cookies and to adjust your preferences.