
Mar 10, 2025
Weekly Index Highlights, March 10, 2025
Market Performance Update
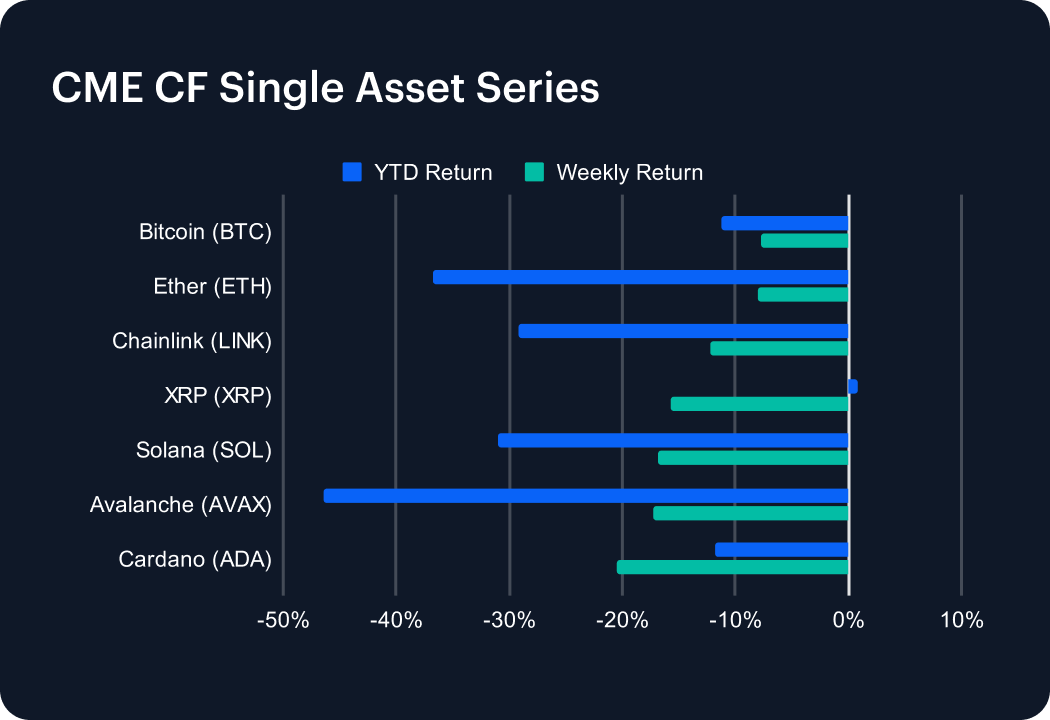
The digital asset market experienced another volatile week, with major cryptocurrencies continuing their decline. Bitcoin (BTC) dropped -7.76%, pushing its year-to-date (YTD) loss to -11.25%. Ether (ETH) fell -8.00% weekly, deepening its YTD downturn to -36.77%. Chainlink (LINK) saw a sharper pullback, losing -12.18% and extending its YTD decline to -29.17%. Avalanche (AVAX) took a heavy hit, plunging -17.32% and bringing its YTD loss to -46.49%. Solana (SOL) slid -16.79%, now down -30.94% YTD. Cardano (ADA) suffered the steepest weekly drop, falling -20.55% to a YTD return of -11.78%. Meanwhile, XRP tumbled -15.70%, but it remains slightly positive for the year at 0.81%. Market sentiment remains cautious amid ongoing uncertainty.
Sector Analysis
The CF DACS segments experienced a sharp downturn this week, with steep losses across all sub-categories. Bitcoin Cash (BCH) stood out as the only major gainer, rising +7.26% in the Store of Value & Payment segment. However, broader market sentiment remained weak. The Meme Coin segment saw the biggest laggard, with WIF plunging -35.71%, while PEPE (-23.50%) and BONK (-21.90%) also suffered. In the General Purpose Smart Contract Platforms segment, Fantom (FTM) was the worst performer, sinking -29.54%, followed by EGLD, down 21.52%. The Social segment also struggled, as PRIME tumbled -29.07%. In the Infrastructure sub-category, ZRO dropped -26.24%, while STRK fell -22.75%. Small-cap tokens continued to underperform their large-cap counterparts as risk appetite waned.
Staking Metrics
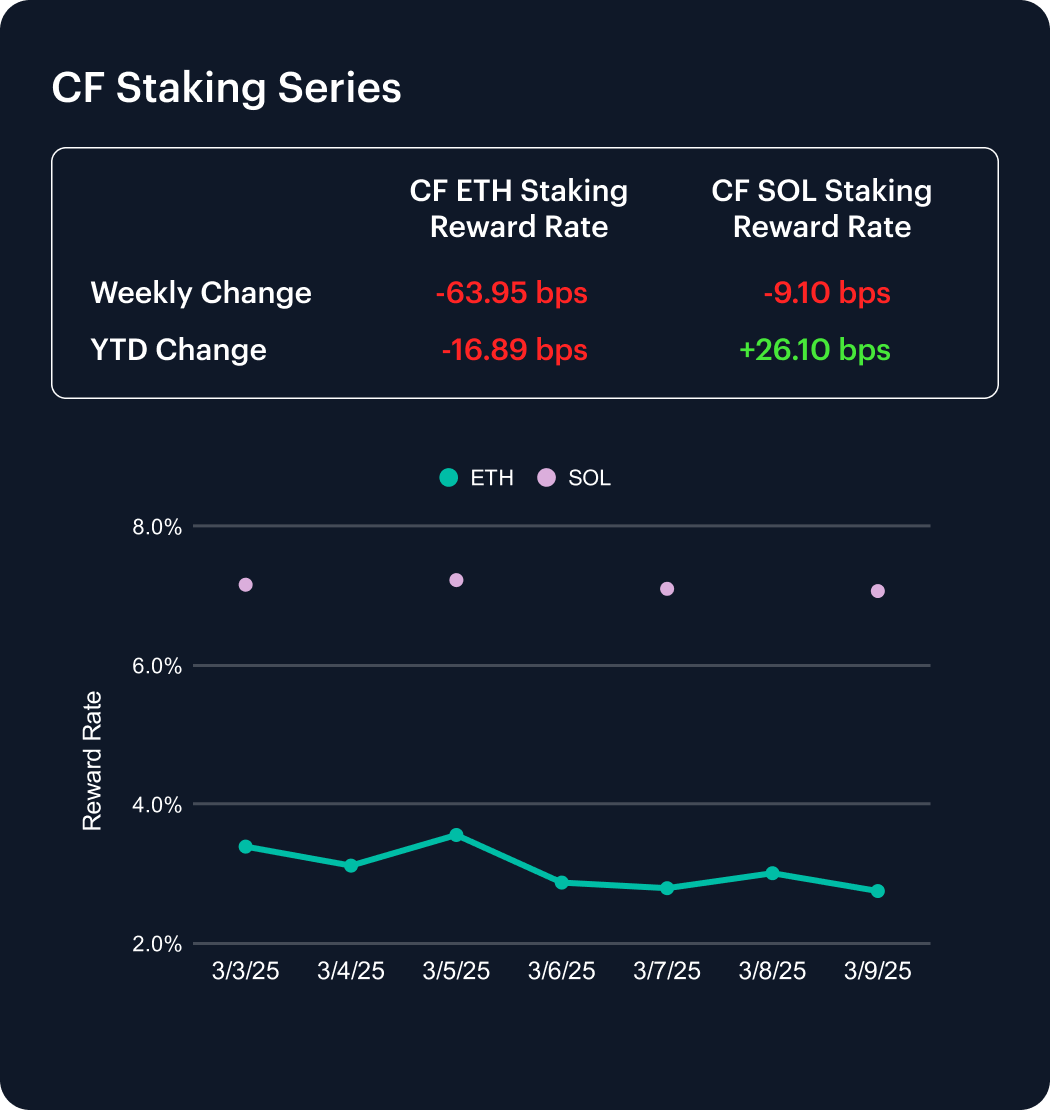
The CF Ether Staking Reward Rate Index (ETH_SRR) saw a significant decline, dropping 63.95 basis points over the past week to 2.75%, reflecting an -18.84% weekly decline. The YTD change also remains negative, down 16.89 bps since the start of the year. The reward rate exhibited sharp intraweek fluctuations, peaking at 3.56% before retreating.
Meanwhile, the CF SOL Staking Reward Rate Index (SOL_SRR) edged down 9.1 basis points to 7.07%, marking a modest -1.27% weekly dip but maintaining a strong 26.10 bps YTD gain. These trends highlight Ethereum’s continued volatility and downward momentum, while Solana sustains its long-term staking yield growth.
Market Cap Index Performance
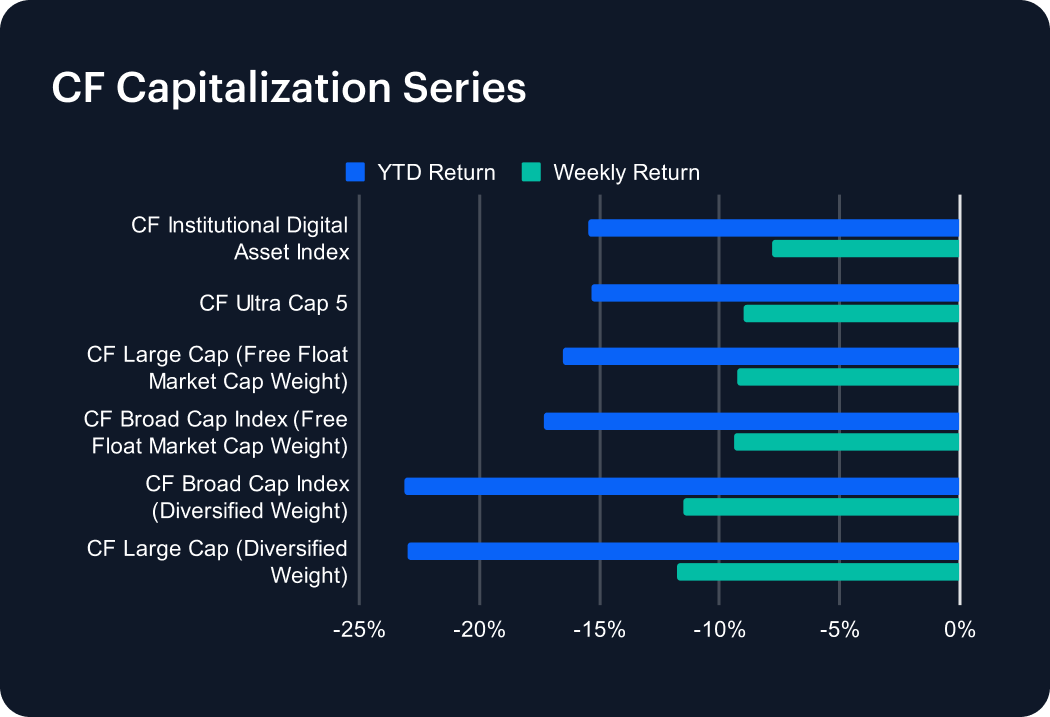
Our CF Capitalization Series experienced broad-based declines this past week, with diversified-weighted indices underperforming their free-float weighted counterparts. The CF Large Cap Index (Diversified Weight) led the downturn, plunging -11.75% for the week, deepening its YTD loss to -23.00%. The CF Broad Cap Index (Diversified Weight) followed closely, sliding -11.52%. Among free-float market cap-weighted indices, the CF Broad Cap Index fell -9.39%, while the CF Large Cap Index dropped -9.27%, extending their YTD losses to -17.31% and -16.52%, respectively. The CF Institutional Digital Asset Index declined -7.79%, while the CF Ultra Cap 5 struggled with a -9.02% weekly drop. As markets moved further to the downside, small-cap tokens continued to face significant pressure.
Classification Series Analysis
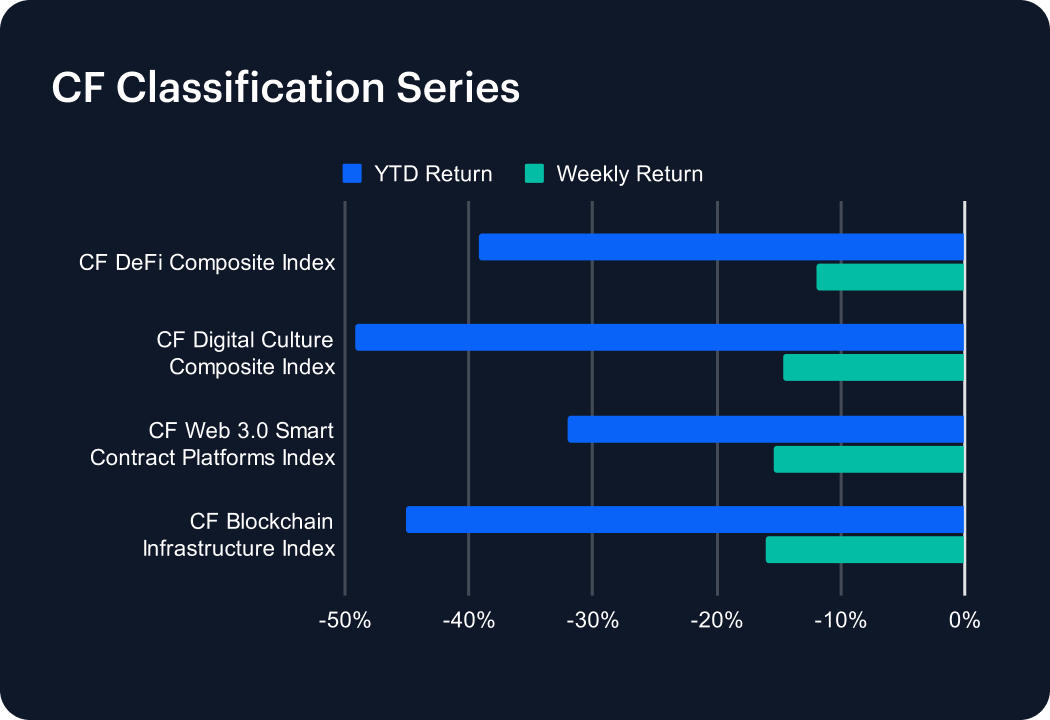
The CF Classification Series experienced broad declines this past week, reflecting continued weakness across digital asset verticals. The CF Blockchain Infrastructure Index led the downturn, sinking -16.06% for the week and deepening its YTD decline to -45.13%. The CF Web 3.0 Smart Contract Platforms Index followed closely, dropping -15.47% and extending its YTD loss to -32.01%. The CF Digital Culture Composite Index also struggled, plunging -14.62% weekly and pushing its YTD decline to -49.15%. Meanwhile, the CF DeFi Composite Index slid -11.93%, with its YTD drop widening to -39.25%. This week’s selloff underscores persistent challenges across sectors, as weak sentiment and sustained market pressures act as a headwind across the board.
Volatility Index
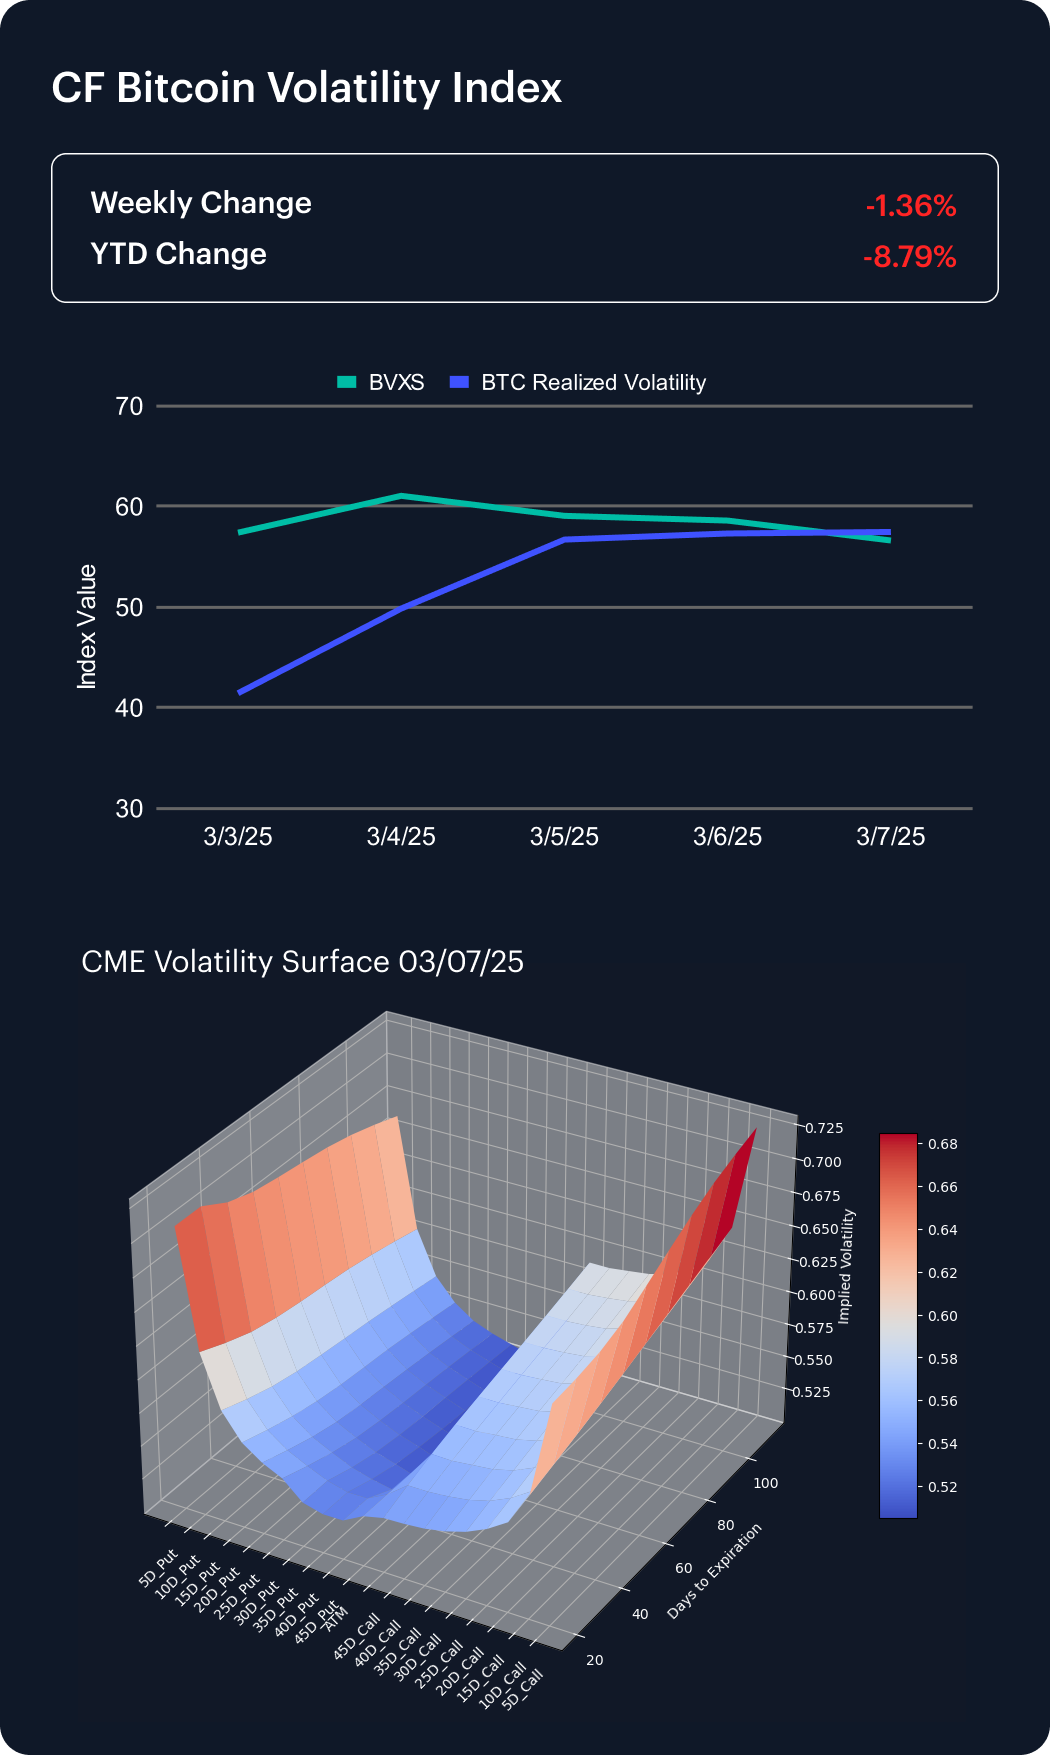
The CF Bitcoin Volatility Index Settlement Rate (BVXS) remained volatile this past week, ultimately declining -1.36% to settle at 56.64, extending its YTD drop to -8.79%. Realized volatility surged, starting the week at 41.46 and peaking at 57.49, reflecting increased short-term price fluctuations.
An analysis of the CME Bitcoin Volatility Surface indicates that while convexity remains elevated, implied volatility has continued to rise, particularly for shorter-dated options. However, the skew has moved slightly negative across the board, suggesting a shift in sentiment toward downside protection, with increased demand for puts over calls. This signals a more cautious outlook, as traders hedge against potential drawdowns, even as convexity remains high, leaving room for sharp price swings and heightened sensitivity to market movements.
Interest Rate Analysis
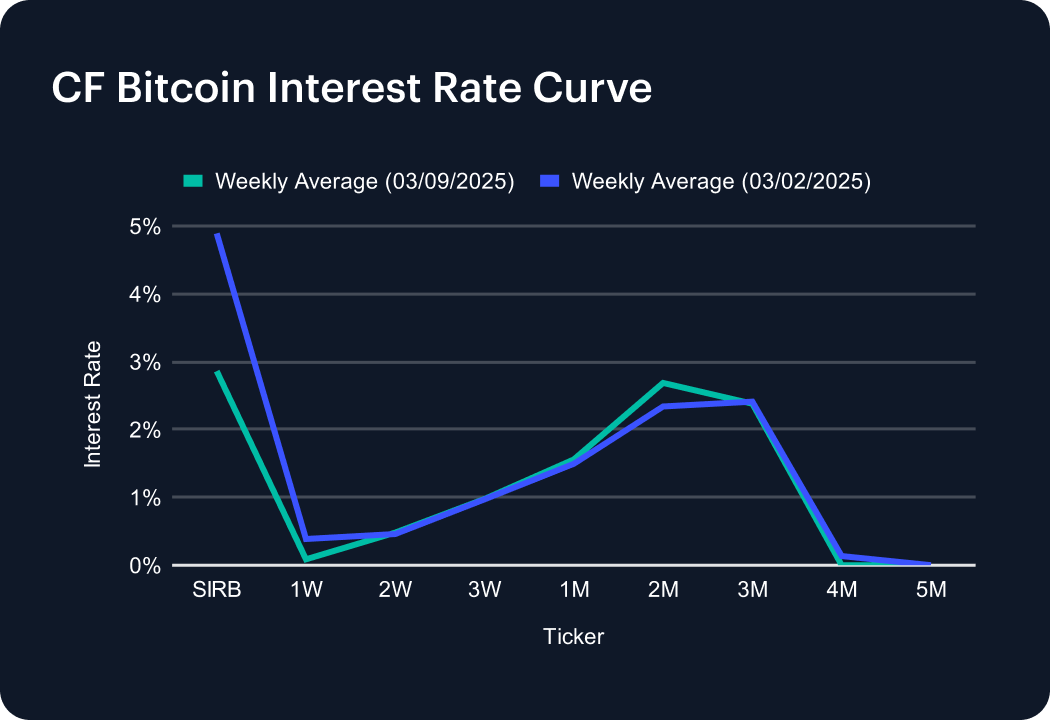
The CF Bitcoin Interest Rate Curve saw a broad decline this past week, with short-term rates falling while medium-term tenors showed mixed movements. The SIRB dropped to 2.86%, down from 4.89% the previous week, reflecting easing short-term borrowing costs. The 1-Week rate declined sharply to 0.09%, while the 2-Week, 3-Week, and 1-Month rates edged higher to 0.48%, 0.98%, and 1.56%, respectively. Medium-term rates were mixed, with the 2-Month rate rising to 2.69%, while the 3-Month rate dipped slightly to 2.38%. The 4-Month and 5-Month tenors fell to 0.00%, indicating a lack of market demand. These shifts suggest a decrease in demand for short term borrowing.
The information contained within is for educational and informational purposes ONLY. It is not intended nor should it be considered an invitation or inducement to buy or sell any of the underlying instruments cited including but not limited to cryptoassets, financial instruments or any instruments that reference any index provided by CF Benchmarks Ltd. This communication is not intended to persuade or incite you to buy or sell security or securities noted within. Any commentary provided is the opinion of the author and should not be considered a personalised recommendation. Please contact your financial adviser or professional before making an investment decision.
Note: Some of the underlying instruments cited within this material may be restricted to certain customer categories in certain jurisdictions.
Changes to the Token Market Price Benchmarks Series - Market Prices – 21 July 2026
The Administrator has confirmed changes to the Token Market Price Family for the period 14 July 2026 to 21 July 2026.

CF Benchmarks
Softer CPI Reprices July Hike Risk & Lifts Digital Assets
Digital assets extended their recovery over the past week as cooler US inflation prints repriced Fed expectations; the bid was broad across the large cap indices, growth factor leadership returned, stablecoin funding repriced lower, and stress stayed isolated in names hit by token-specific news.
Mark Pilipczuk
Notice of the Demising of CF Dai-Dollar Settlement Price and Spot Rate
The Administrator announces that it will demise the CF Dai-Dollar Settlement Price (DAIUSD_RR) and CF Dai-Dollar Spot Rate (DAIUSD_RTI) which are members of the CF Digital Asset Index Family.
CF Benchmarks
By clicking Accept, you consent to CF Benchmarks's use of cookies.
Visit Cookie Settings to learn how CF Benchmarks uses cookies and to adjust your preferences.