
Jul 07, 2025
Weekly Index Highlights, July 07, 2025
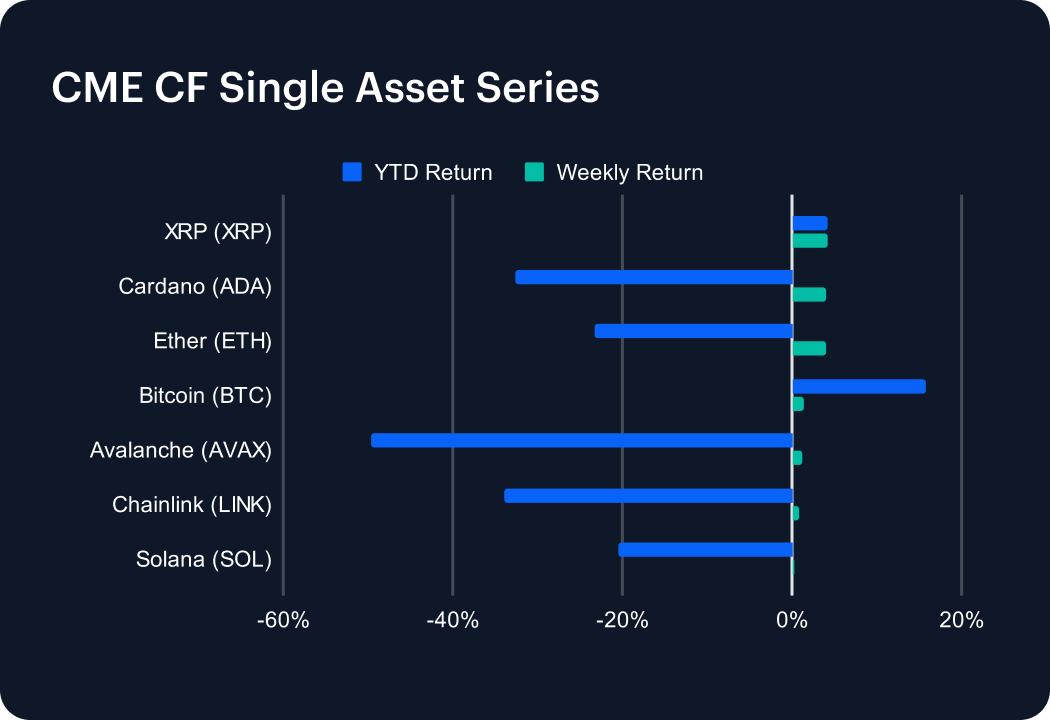
Market Performance Update
The digital-asset market extended its rebound last week, with all seven major tokens closing higher. Ripple’s XRP (XRP) set the pace, rising 4.26% and widening its year-to-date advance to 4.21%. Cardano (ADA) followed with a 4.09% lift, trimming its 2025 deficit to -32.53%. Ether (ETH) added 4.07%, reducing its YTD loss to -23.32%, while Bitcoin (BTC) edged up 1.47% to raise its yearly return to 15.85%. Avalanche (AVAX) and Chainlink (LINK) appreciated 1.23% and 0.90%, easing their slides to -49.68% and -33.93%, respectively. Solana (SOL) inched 0.19% higher, leaving it down -20.50% YTD. Regulatory progress and the growing US deficit continued to underpin sentiment across digital assets.
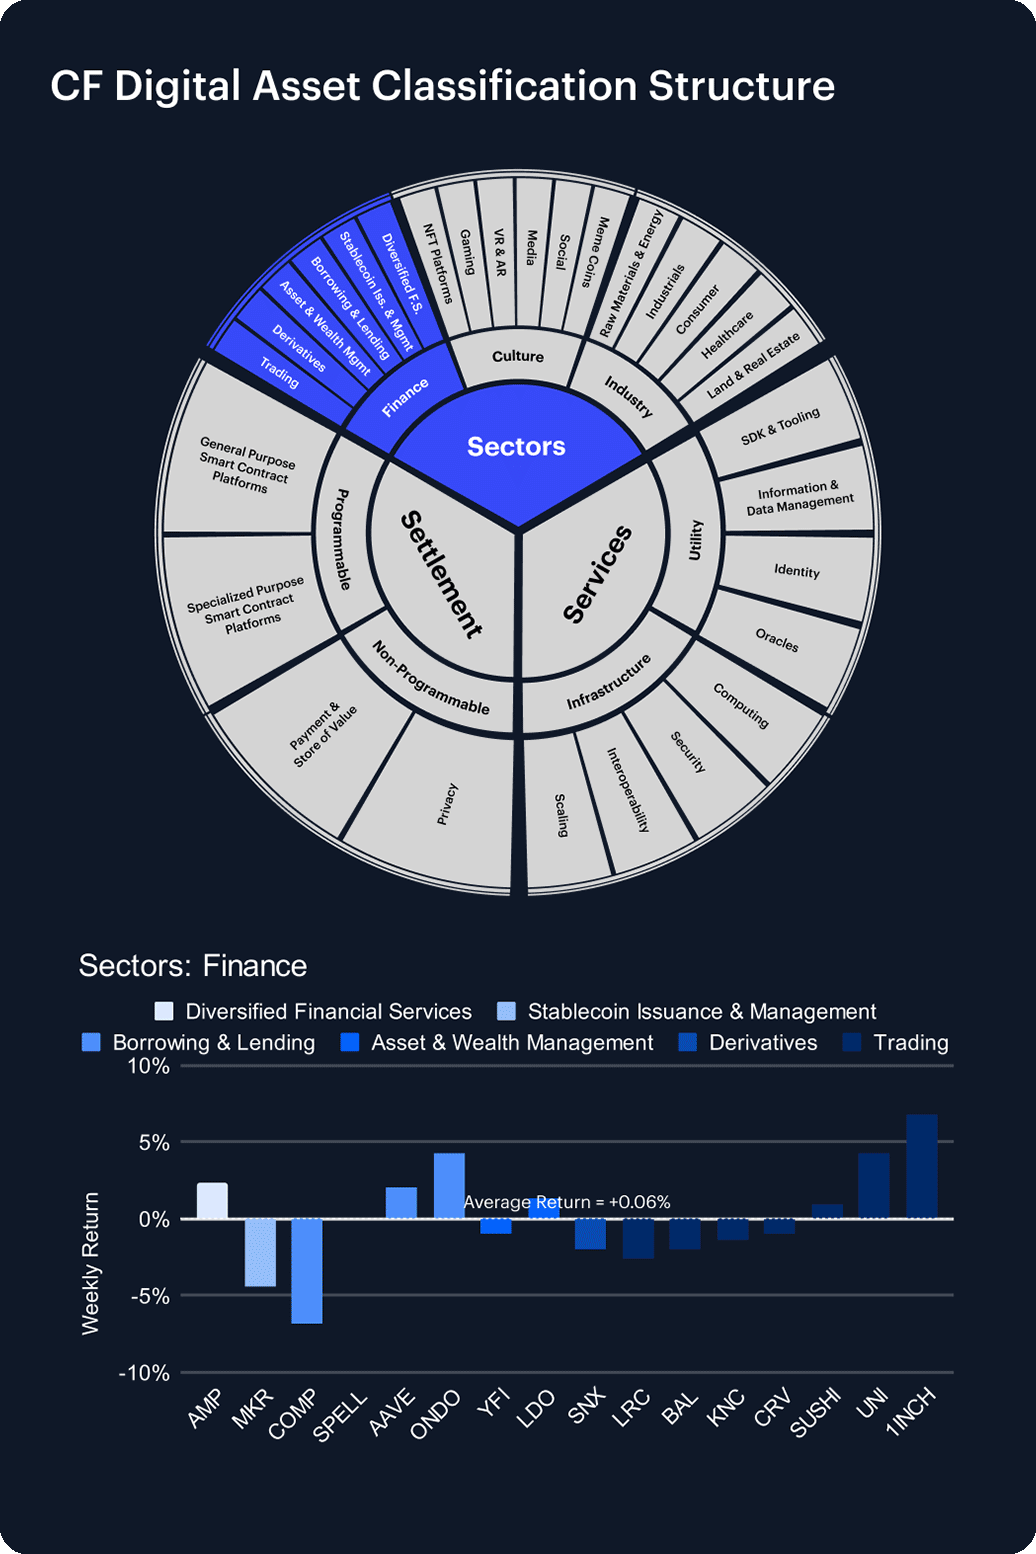
Sector Analysis
The DACS segments logged another broad-based advance last week, though leadership rotated sharply toward meme coins and scaling tokens. Meme Coin BONK (+60.40%) stole the spotlight, dwarfing every other mover. TIA (+8.28%) and 1INCH (+6.78%) followed, while MANA (+6.09%) and SUI (+6.05%) rounded out the top five. The Settlement category was lifted by XRP (+4.26%) and Cardano (+4.09%), and the Finance sub-category gained with ONDO (+4.28%) and AAVE (+2.07%). The Culture sub-category was mixed, as RARI slid –5.53% despite gains in other Meme Coins. The sharpest pullbacks came from SEI (–10.79%), Aptos (–7.24%) and COMP (–6.78%), with scaling tokens ARB (–5.70%) and SKL (–5.56%) also lagging. Dispersion narrowed but the bias remained decisively upward.
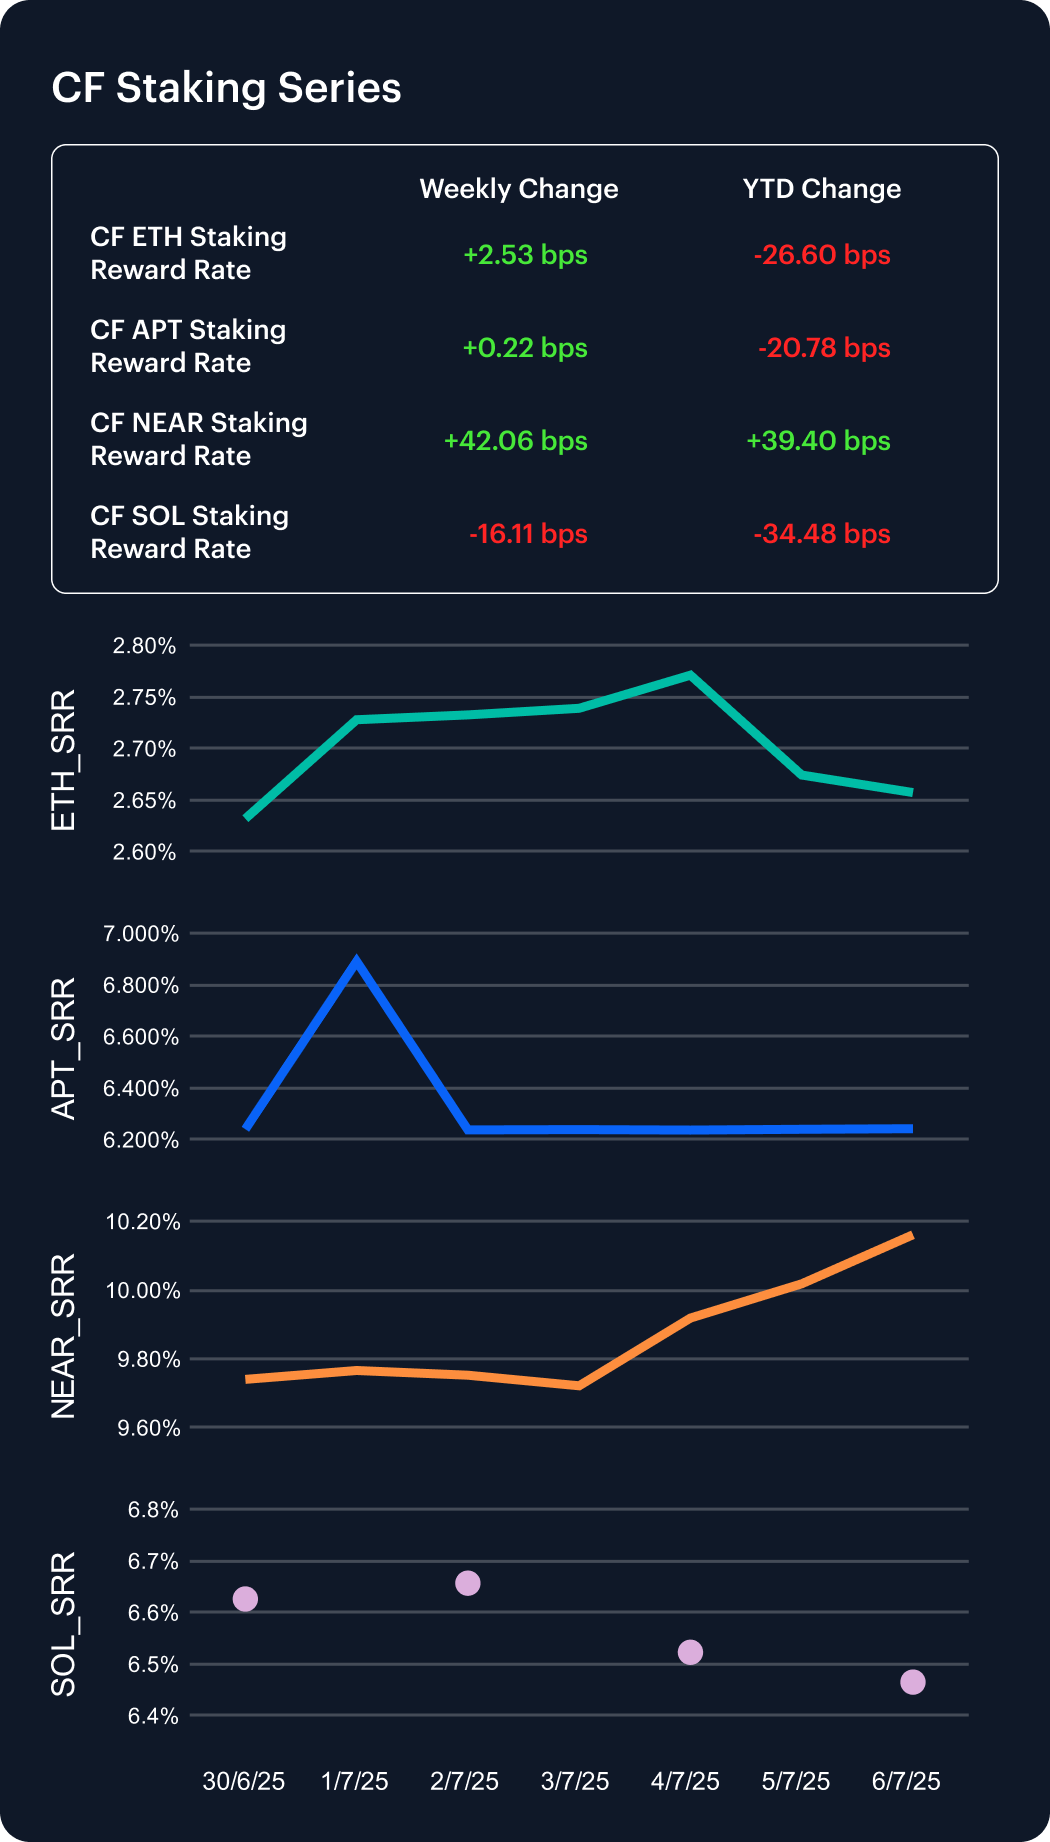
Staking Metrics
Staking yields diverged afresh last week, headlined by NEAR’s outsized surge. The CF NEAR Staking Reward Rate Index jumped 42 bps to 10.16%, lifting its year-to-date advance to 4.0%. Ether’s ETH_SRR inched 3 bps higher to 2.66%, shaving its 2025 decline to –9.1% yet still hovering near record lows. Aptos yields were virtually flat at 6.24%, leaving them 21 bps below New-Year levels. Solana was the sole laggard: SOL_SRR slid 16 bps to 6.46%, deepening its YTD drop to –5.1%. Varied on-chain activity and inflation dynamics continue to widen the reward gap across proof-of-stake networks.
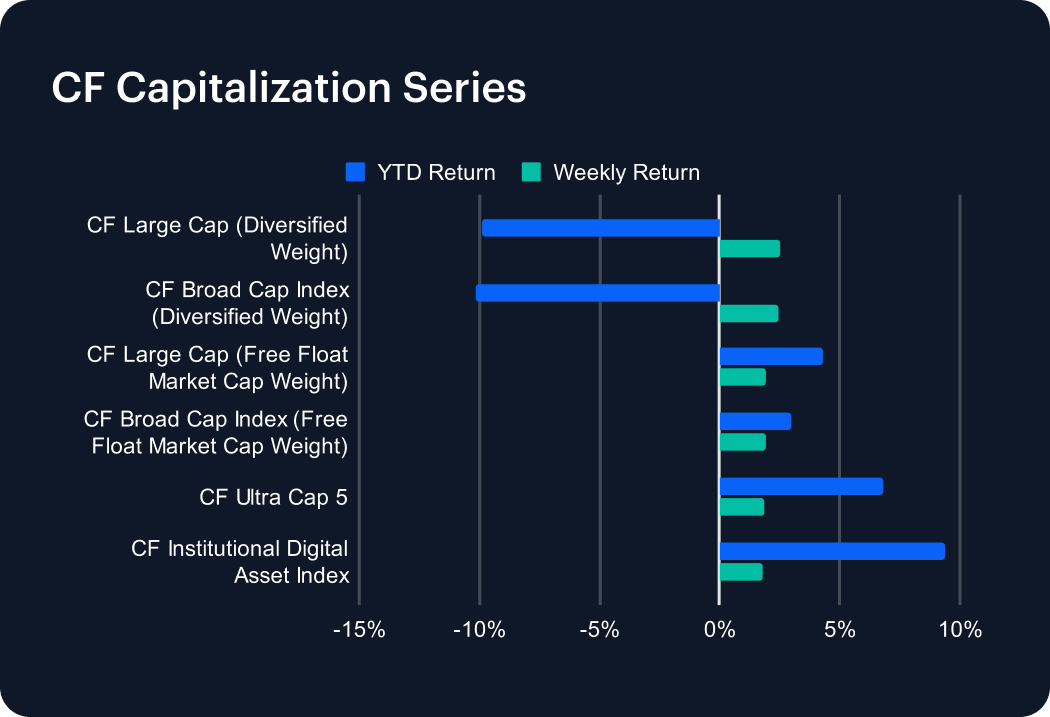
Market Cap Index Performance
The CF Capitalization Series notched a second straight advance, though weekly gains cooled to roughly 2%. Diversified-weight benchmarks led: the CF Large Cap (Diversified) rose 2.51%, edging the CF Broad Cap (Diversified) at 2.44%, trimming their year-to-date deficits to –9.91% and –10.14%, respectively. Free-float gauges lagged slightly, yet both extended 2025 gains; the CF Large Cap (Free-Float) climbed 1.91% to +4.28% YTD, while the CF Broad Cap (Free-Float) added 1.90% to +3.01%. The CF Ultra Cap 5 gained 1.86%, lifting its YTD return to 6.81%. Still wearing the performance crown, the CF Institutional Digital Asset Index advanced 1.76% on the week and now stands 9.36% higher year-to-date.
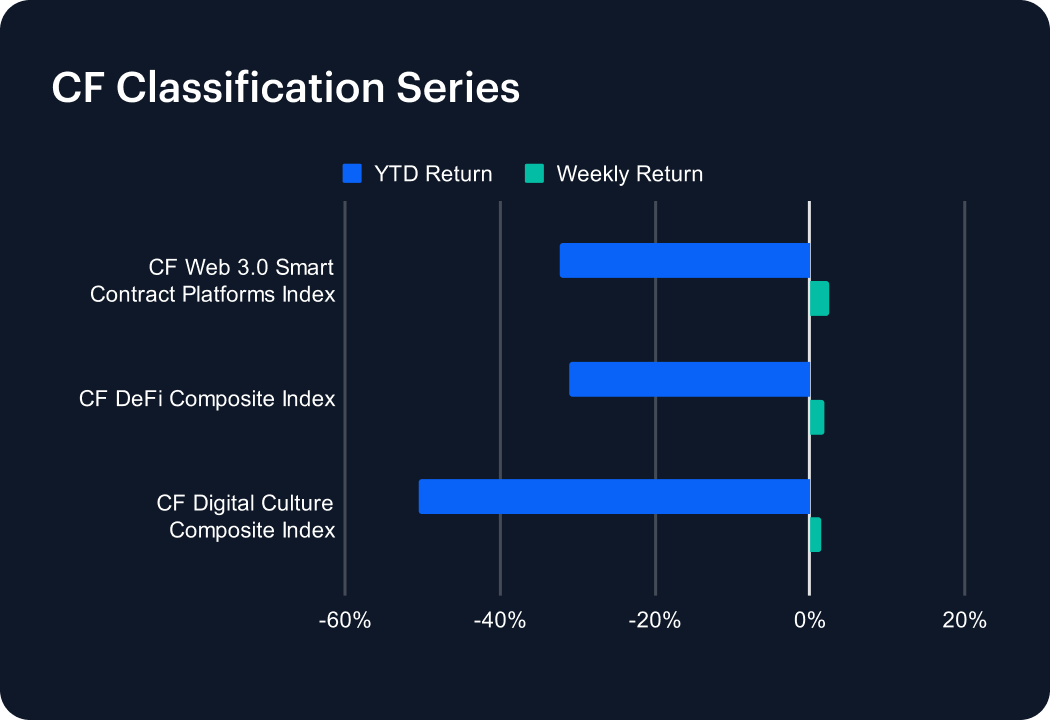
Classification Series Analysis
The CF Classification Series extended its recovery, as each thematic benchmark notched another weekly gain. The CF Web 3.0 Smart-Contract Platforms Index paced the trio, climbing 2.45% and shaving its 2025 loss to –32.19%. The CF DeFi Composite Index added 1.85%, narrowing its year-to-date decline to –31.01%, while the CF Digital Culture Composite Index advanced 1.48% but remains the laggard at –50.46% YTD. Although this second straight weekly rise hints that risk appetite is gradually rebuilding across high-beta corners of the market, the still-steep double-digit deficits highlight how much ground valuations must cover before reclaiming their early-January peaks.
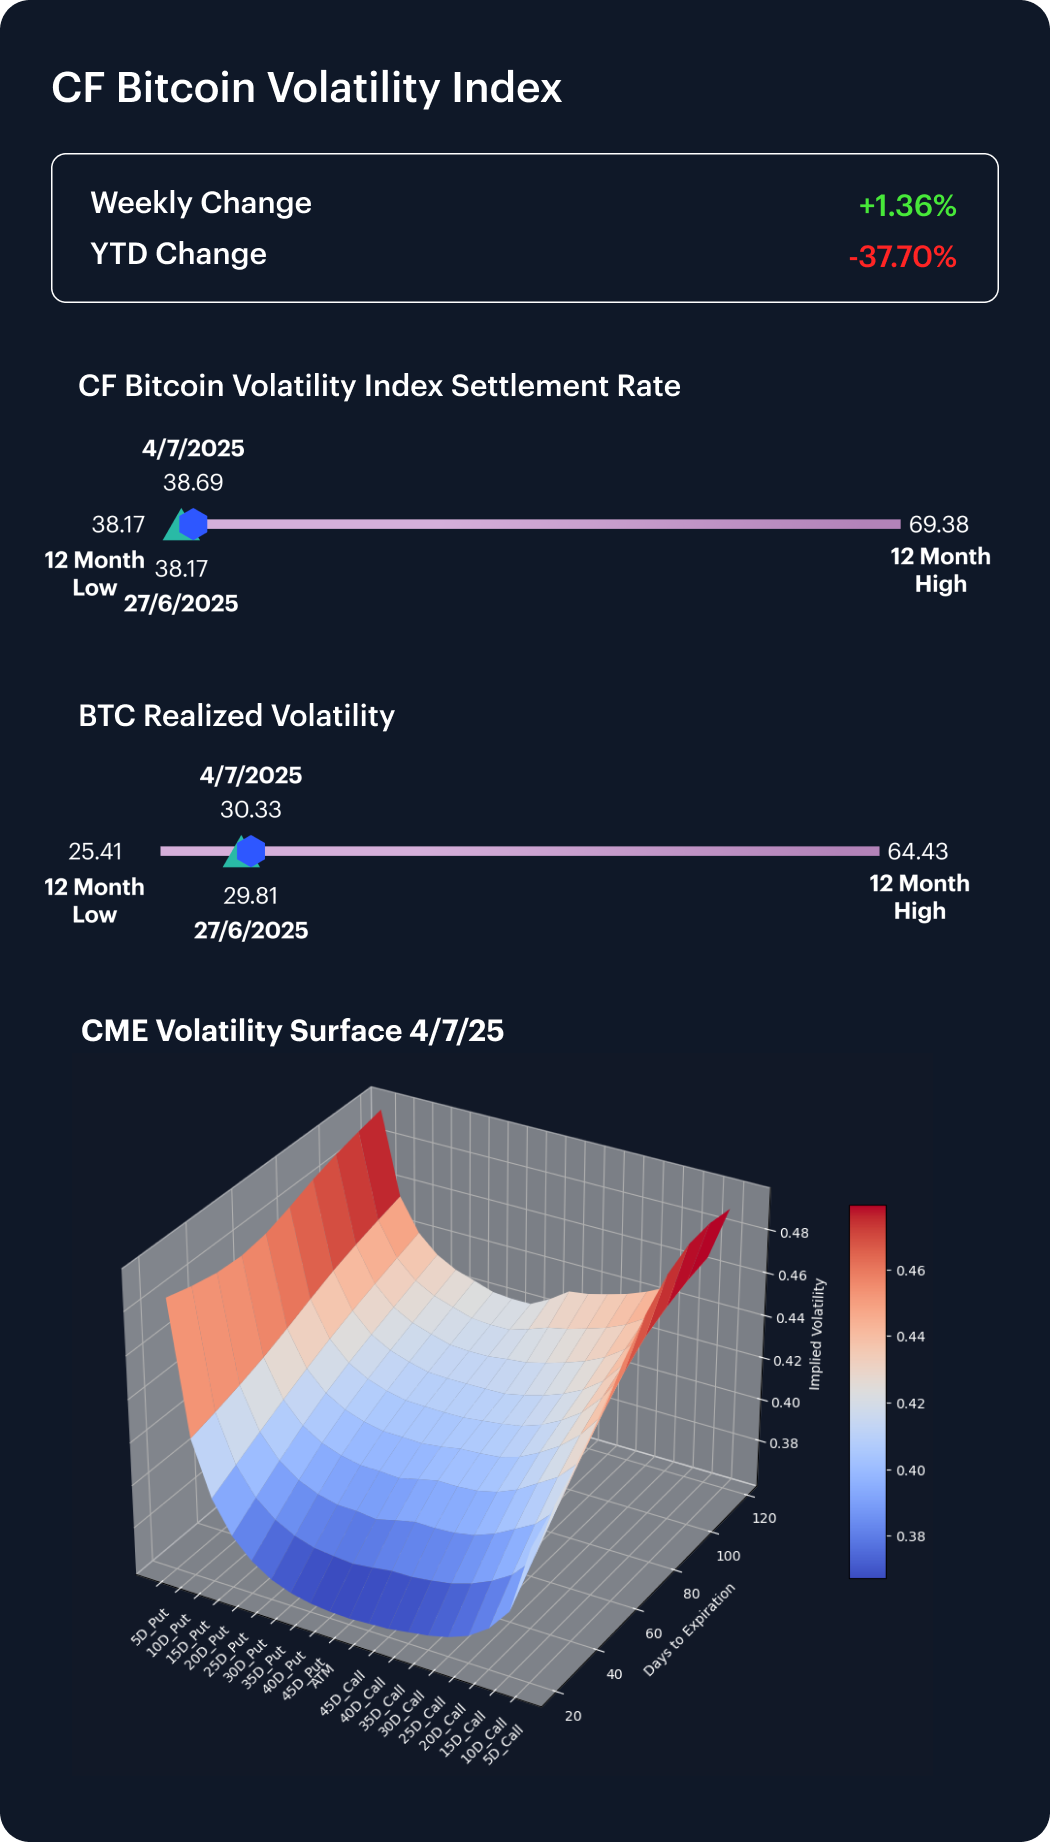
Volatility
The CF Bitcoin Volatility Index Settlement Rate (BVXS) edged up to 38.69 last week, a 1.4% increase that keeps it roughly 38% below its 1-January mark and only a shade above June’s 12-month trough at 38.17. Realized volatility continued to increase, reaching 30.33 from 29.81 (+1.8%), reflecting livelier spot swings even as option premia stay muted. Aggregate skew across the 10-, 15- and 20-delta remains slightly negative, yet closer to zero than the prior week, and the 25-delta skew actually flipped positive to +0.23. Sub-60-day volatility remains the softest part of the surface, while longer tenors still command a premium. The blend of firmer realized prints, recovering skew and depressed front-end IV suggests traders are dialing back crash insurance and cautiously resuming directional risk.
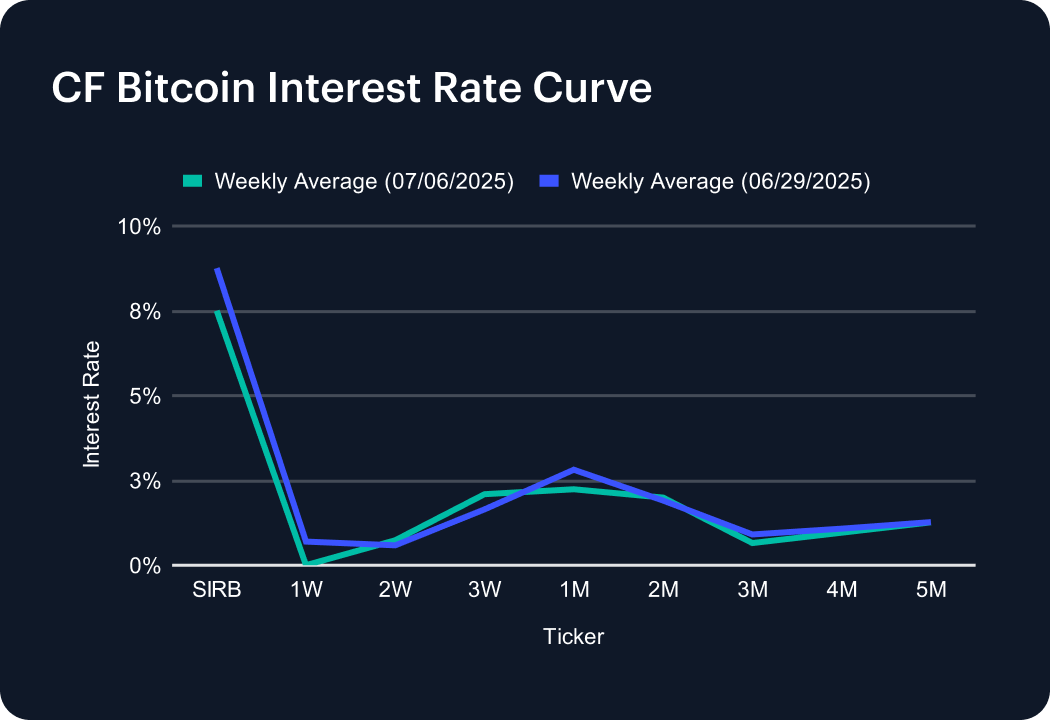
Interest Rate Analysis
Short-term funding costs eased last week as the CF Bitcoin Interest Rate Curve shifted lower at most nodes, unwinding much of the prior spike. The Short-Term Interest Rate Benchmark (SIRB) fell 126 bps to 7.50%, reversing two-thirds of the earlier surge. The 1-week tenor plunged 70 bps to 0.00%, while 2- and 3-week points firmed 14 bps and 44 bps to 0.73% and 2.09%, carving a pronounced hump in the near curve. One-month rates retreated 57 bps to 2.24%, and tenors beyond two months slipped 1–26 bps, leaving the back end near 1.0 – 1.3%. The result is a flatter curve anchored by a sharply lower policy rate and scattered mid-curve premiums.
The information contained within is for educational and informational purposes ONLY. It is not intended nor should it be considered an invitation or inducement to buy or sell any of the underlying instruments cited including but not limited to cryptoassets, financial instruments or any instruments that reference any index provided by CF Benchmarks Ltd. This communication is not intended to persuade or incite you to buy or sell security or securities noted within. Any commentary provided is the opinion of the author and should not be considered a personalised recommendation. Please contact your financial adviser or professional before making an investment decision.
Note: Some of the underlying instruments cited within this material may be restricted to certain customer categories in certain jurisdictions.
Changes to the Token Market Price Benchmarks Series - Market Prices – 21 July 2026
The Administrator has confirmed changes to the Token Market Price Family for the period 14 July 2026 to 21 July 2026.

CF Benchmarks
Softer CPI Reprices July Hike Risk & Lifts Digital Assets
Digital assets extended their recovery over the past week as cooler US inflation prints repriced Fed expectations; the bid was broad across the large cap indices, growth factor leadership returned, stablecoin funding repriced lower, and stress stayed isolated in names hit by token-specific news.
Mark Pilipczuk
Notice of the Demising of CF Dai-Dollar Settlement Price and Spot Rate
The Administrator announces that it will demise the CF Dai-Dollar Settlement Price (DAIUSD_RR) and CF Dai-Dollar Spot Rate (DAIUSD_RTI) which are members of the CF Digital Asset Index Family.
CF Benchmarks
By clicking Accept, you consent to CF Benchmarks's use of cookies.
Visit Cookie Settings to learn how CF Benchmarks uses cookies and to adjust your preferences.