
Feb 17, 2025
Weekly Index Highlights, February 17, 2025
Market Performance Update
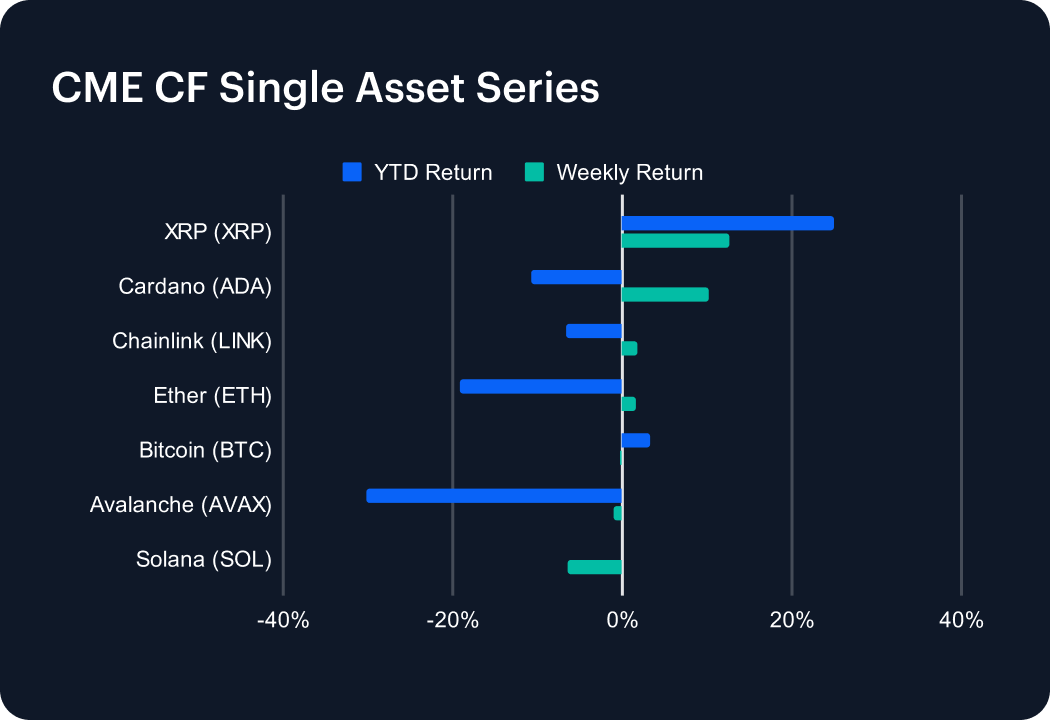
The digital asset market saw mixed performance over the past week, with several assets posting strong recoveries while others continued to decline. XRP (XRP) led the gains, surging +12.53% weekly, pushing its YTD return to +24.95%. Cardano (ADA) followed with a +10.23% rise, though it remains -10.77% YTD. Chainlink (LINK) and Ether (ETH) saw modest gains of +1.80% and +1.57%, with ETH still down -19.18% YTD. Bitcoin (BTC) remained relatively stable, slipping -0.23% but holding a +3.24% YTD gain. Meanwhile, Avalanche (AVAX) dipped -1.03%, deepening its -30.28% YTD loss, while Solana (SOL) suffered the steepest weekly decline at -6.50%, pushing its YTD return to -0.09%. Market sentiment remains divided as volatility continues.

Sector Analysis
The CF DACS segments experienced divergent performance this week, with clear leaders and laggards. Lido DAO (LDO) soared +19.08%, leading the Asset & Wealth Management segment, while Fantom (FTM) surged +23.43% among General Purpose Smart Contract Platforms. XRP’s strong +12.53% gain, lead the Non-Programable settlement tokens +6.09% higher for the week. In the Computing segment, Helium (HNT) led with +11.69%, while Jasmy (JASMY) lagged at -3.11%. SuperVerse (SUPER) gained +10.24% in the Gaming segment, contributing to the Culture sub-category’s +2.32% rise. Derivatives platform Synthetix (SNX) rebounded +3.51%, contrasting with Spell (SPELL) in Borrowing & Lending, which fell -9.13%. The scaling sector saw Polygon (POL) rise +6.53%, while TIA struggled at -5.71%. Market conditions remain volatile, with sector-specific catalysts driving momentum.
Staking Metrics
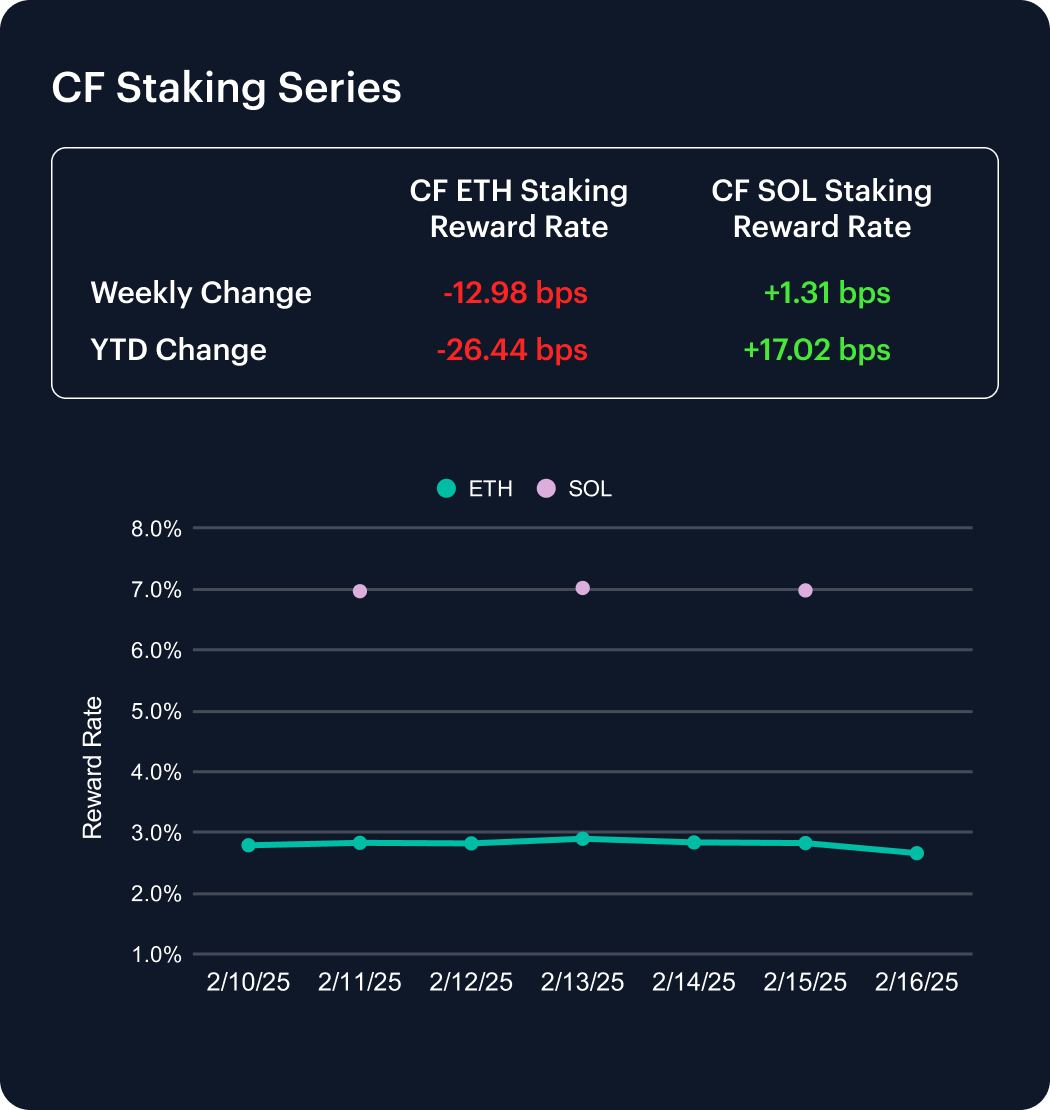
The CF Ether Staking Reward Rate Index (ETH_SRR) continued its decline, dropping -12.98 basis points over the past week to 2.66%, reflecting a -4.65% weekly decrease and a YTD decline of -26.44 bps. The reward rate fluctuated throughout the week, peaking at 2.90% before trending downward.
Meanwhile, the CF SOL Staking Reward Rate Index (SOL_SRR) showed resilience, rising 1.31 basis points to 6.98%, marking a 0.19% weekly gain and a YTD increase of 17.02 bps. These shifts highlight Ethereum’s continued yield compression while Solana’s staking rates maintain steady upward momentum.
Market Cap Index Performance
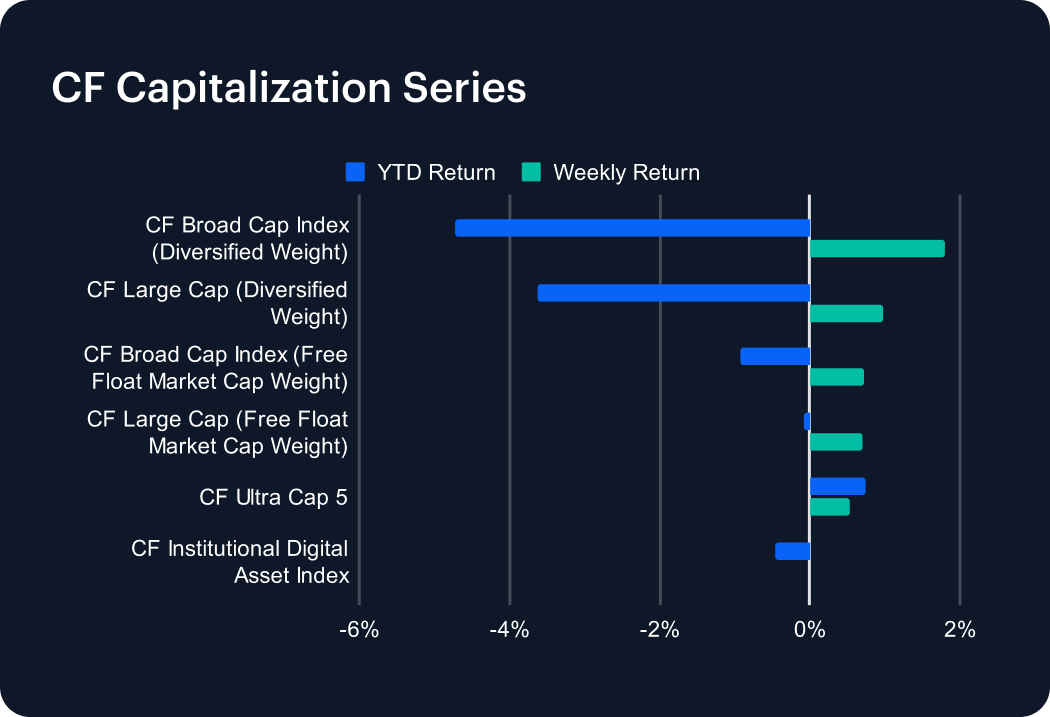
Our CF Capitalization Series saw broad-based gains this past week, with diversified weighted indices outperforming their free-float counterparts. The CF Broad Cap Index (Diversified Weight) led the recovery, rising +1.79% for the week, trimming its YTD loss to -4.72%. The CF Large Cap Index (Diversified Weight) also gained +0.97%, bringing its YTD return to -3.63%. Meanwhile, free float market cap-weighted indices saw moderate gains, with the CF Large Cap Index and CF Broad Cap Index up +0.70% and +0.73%, respectively. The CF Ultra Cap 5 rose +0.54%, while the CF Institutional Digital Asset Index inched +0.01% higher. These gains suggest a shift in sentiment, with smaller-cap assets recovering faster than their large-cap counterparts.
Classification Series Analysis
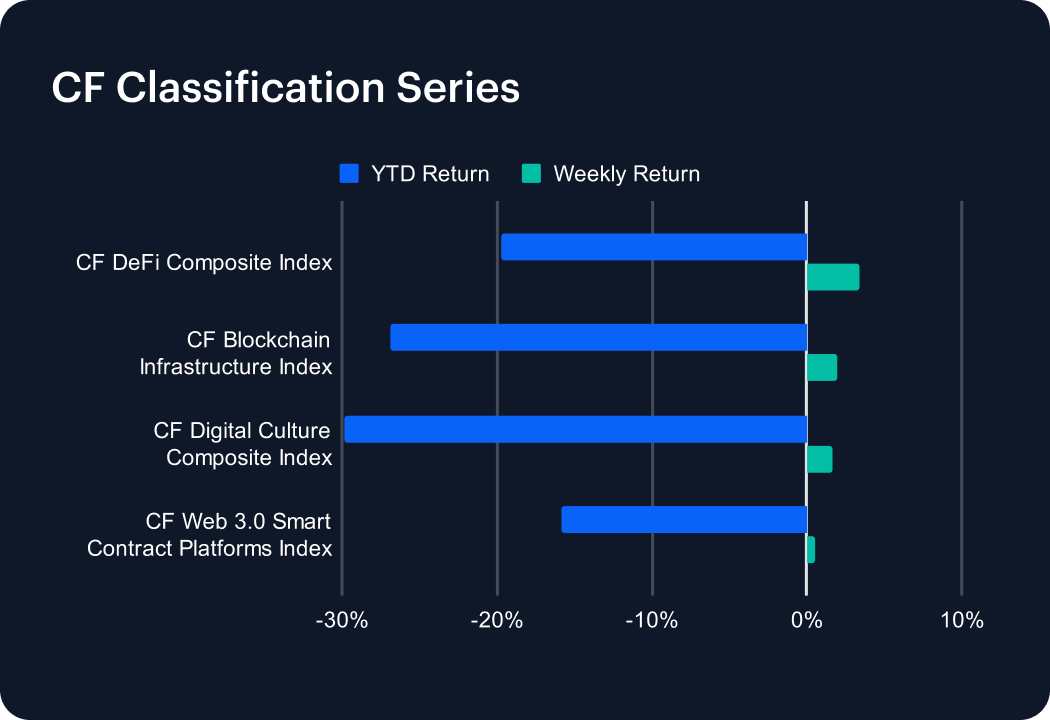
The CF Classification Series saw a broad recovery this past week, signaling a potential shift in sentiment across digital asset verticals. The CF DeFi Composite Index led gains, rising +3.40% for the week, trimming its YTD loss to -19.74%. The CF Blockchain Infrastructure Index followed with a +1.94% gain, bringing its YTD performance to -26.87%. Meanwhile, the CF Digital Culture Composite Index rose +1.64%, though it remains down -29.85% YTD. The CF Web 3.0 Smart Contract Platforms Index posted a more modest +0.52% gain, improving its YTD return to -15.83%. While this week’s gains suggest some stabilization, the sector remains under pressure, with longer-term losses still weighing on sentiment.
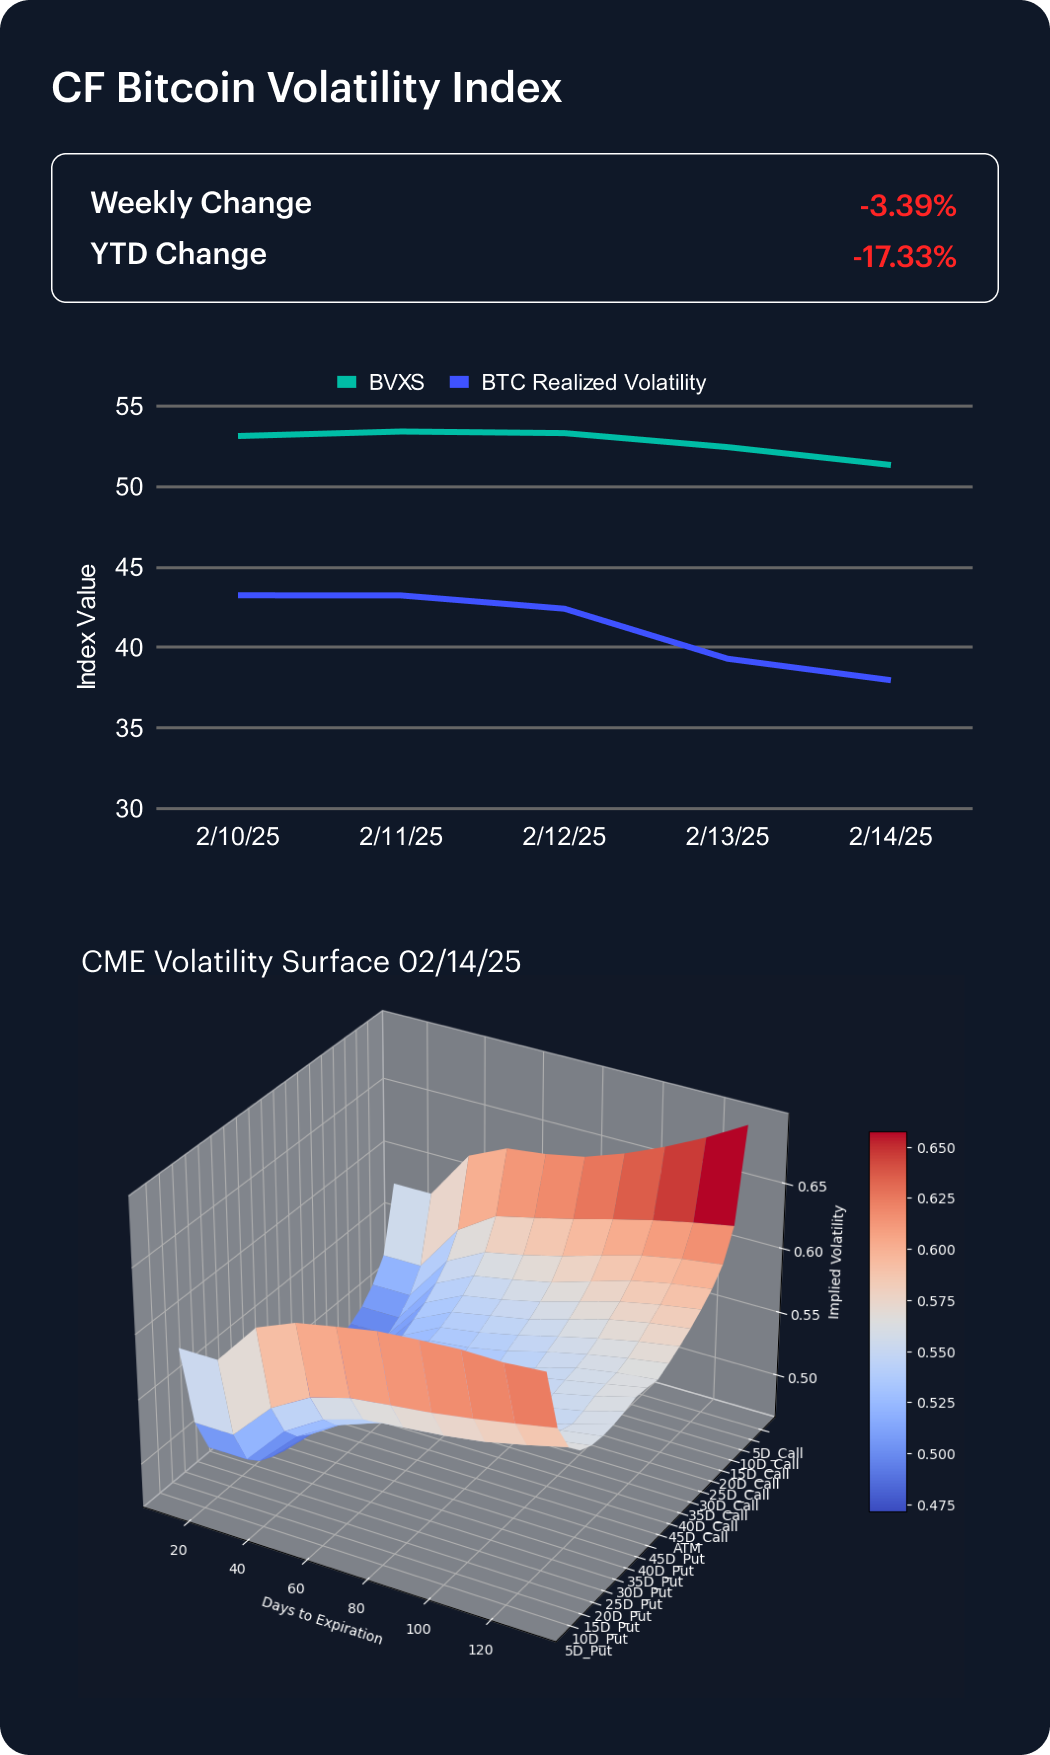
Volatility Index
The CF Bitcoin Volatility Index Settlement Rate (BVXS) declined further this past week, dropping -3.39% to settle at 51.34, deepening its YTD decline to -17.33%. Realized volatility also trended lower, beginning the week at 43.25 and ending at 37.97, signaling a continued reduction in short-term price fluctuations.
An analysis of the CME Bitcoin Volatility Surface suggests rising convexity despite a flattening skew across strike ranges as of February 14, 2025. Notably, the 10-delta and 15-delta skew have turned positive, signaling a bullish shift in sentiment as put hedging activity declined over the past week. While lower implied and realized volatility indicate a calmer market, the increase in convexity suggests the potential for sudden price movements, particularly over longer timeframes, as option sensitivity to price changes becomes more pronounced.
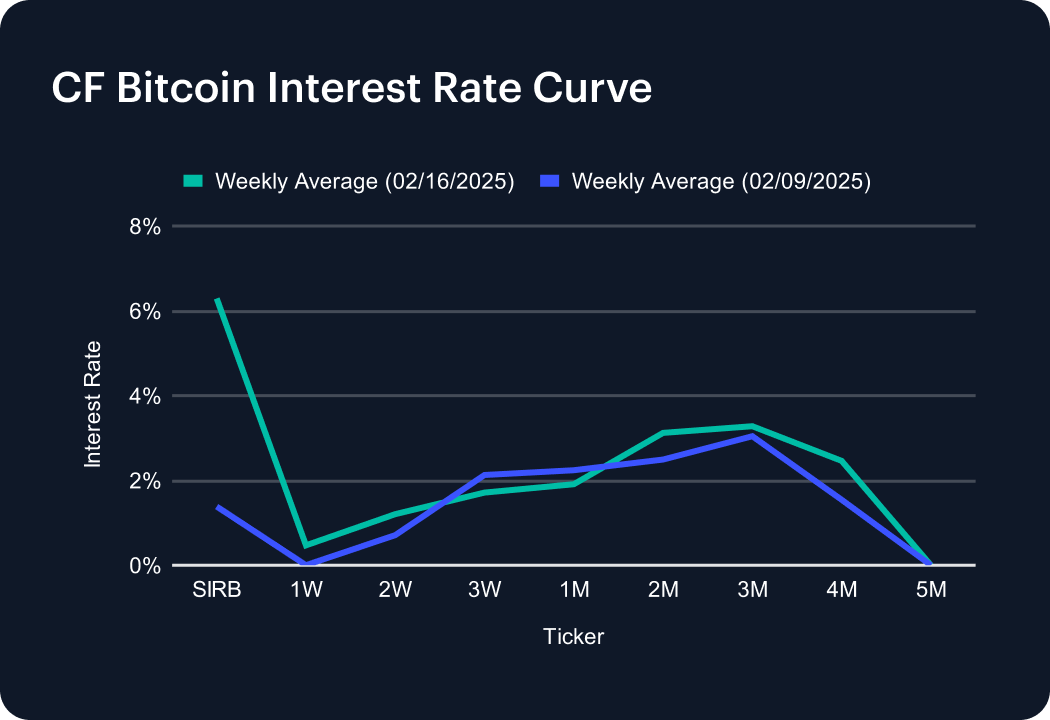
Interest Rate Analysis
The CF Bitcoin Interest Rate Curve saw a broad repricing this past week, with short-term rates rising while medium-term tenors experienced mixed adjustments. The SIRB surged to 6.29%, up sharply from 1.38% the previous week, indicating increased short-term borrowing costs. The 1-Week rate rebounded to 0.47%, while the 2-Week rate climbed to 1.20%. However, the 3-Week and 1-Month tenors declined to 1.71% and 1.91%, respectively. Medium-term tenors strengthened, with the 2-Month and 3-Month rates rising to 3.12% and 3.28%, while the 4-Month rate increased to 2.46%. These shifts suggest dynamic liquidity conditions and fluctuating borrowing demand across maturities.
The information contained within is for educational and informational purposes ONLY. It is not intended nor should it be considered an invitation or inducement to buy or sell any of the underlying instruments cited including but not limited to cryptoassets, financial instruments or any instruments that reference any index provided by CF Benchmarks Ltd. This communication is not intended to persuade or incite you to buy or sell security or securities noted within. Any commentary provided is the opinion of the author and should not be considered a personalised recommendation. Please contact your financial adviser or professional before making an investment decision.
Note: Some of the underlying instruments cited within this material may be restricted to certain customer categories in certain jurisdictions.
Changes to the Token Market Price Benchmarks Series - Market Prices – 21 July 2026
The Administrator has confirmed changes to the Token Market Price Family for the period 14 July 2026 to 21 July 2026.

CF Benchmarks
Softer CPI Reprices July Hike Risk & Lifts Digital Assets
Digital assets extended their recovery over the past week as cooler US inflation prints repriced Fed expectations; the bid was broad across the large cap indices, growth factor leadership returned, stablecoin funding repriced lower, and stress stayed isolated in names hit by token-specific news.
Mark Pilipczuk
Notice of the Demising of CF Dai-Dollar Settlement Price and Spot Rate
The Administrator announces that it will demise the CF Dai-Dollar Settlement Price (DAIUSD_RR) and CF Dai-Dollar Spot Rate (DAIUSD_RTI) which are members of the CF Digital Asset Index Family.
CF Benchmarks
By clicking Accept, you consent to CF Benchmarks's use of cookies.
Visit Cookie Settings to learn how CF Benchmarks uses cookies and to adjust your preferences.