
Dec 23, 2024
Weekly Index Highlights, December 23, 2024
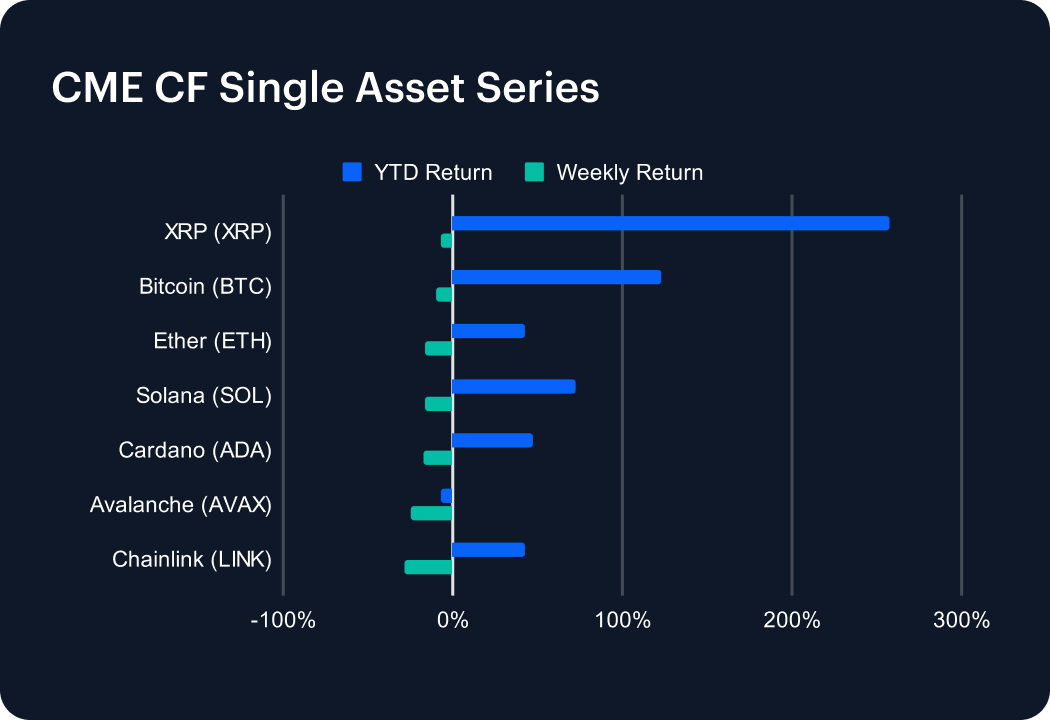
A second consecutive, though this time more emphatic, weekly retreat among risky asset classes in the wake of a recalibrated monetary policy outlook, equated to all CME CF Single Asset indices declining in unison, and Bitcoin’s first weekly decline since Trump’s election win. Chainlink (LINK) -28.06%, surrendered most gains from its recent firmer stretch. XRP relatively outperformed, edging back just -6.64%. The picture shaping up for the year shows XRP leading with a year-to-date (YTD) return of +257.44%, followed by Bitcoin, now +123.14 YTD (after slipping -10.23% for the week). Solana (SOL) is a clear third YTD, +71.97%. The remainder in this series, Cardano (ADA), LINK, and Ether (ETH), show roughly adjacent YTD performances, rising +48.63%, +42.82%, +42.74% respectively.

All active key categories declined with few areas of meaningful relative outperformance. The Non-programmable Sub-category fell -12.52% on average. The deepest underperforming Sub-category, Utility, fell an average -25.45%. Infrastructure was in close vicinity, sliding -24.97% on average. DeFi, Programmable, and Culture Sub-categories were also proximate, and closely matched, with respective average pullbacks of -23.00%, -21.60%, and -21.59%. LINK’s -28.06% weekly fall compares to the median relative performer in the Utility Sub-category, Biconomy (BICO), -24.84%, whose fall was virtually identical to The Graph’s (GRT) down -24.86%. Culture Sub-category differentials were more distributed. Media segment token Livepeer (LPT) slipped -5.94%, and Meme Coin BONK retreated -9.74%. Hedera (HBAR) was the least-dented among Programmable protocol tokens, -8.13%; Injective (INJ) the worst off, -28.92%. Infrastructure losses ranged between POL’s -20.25%, and Helium’s (HNT) -29.19%.
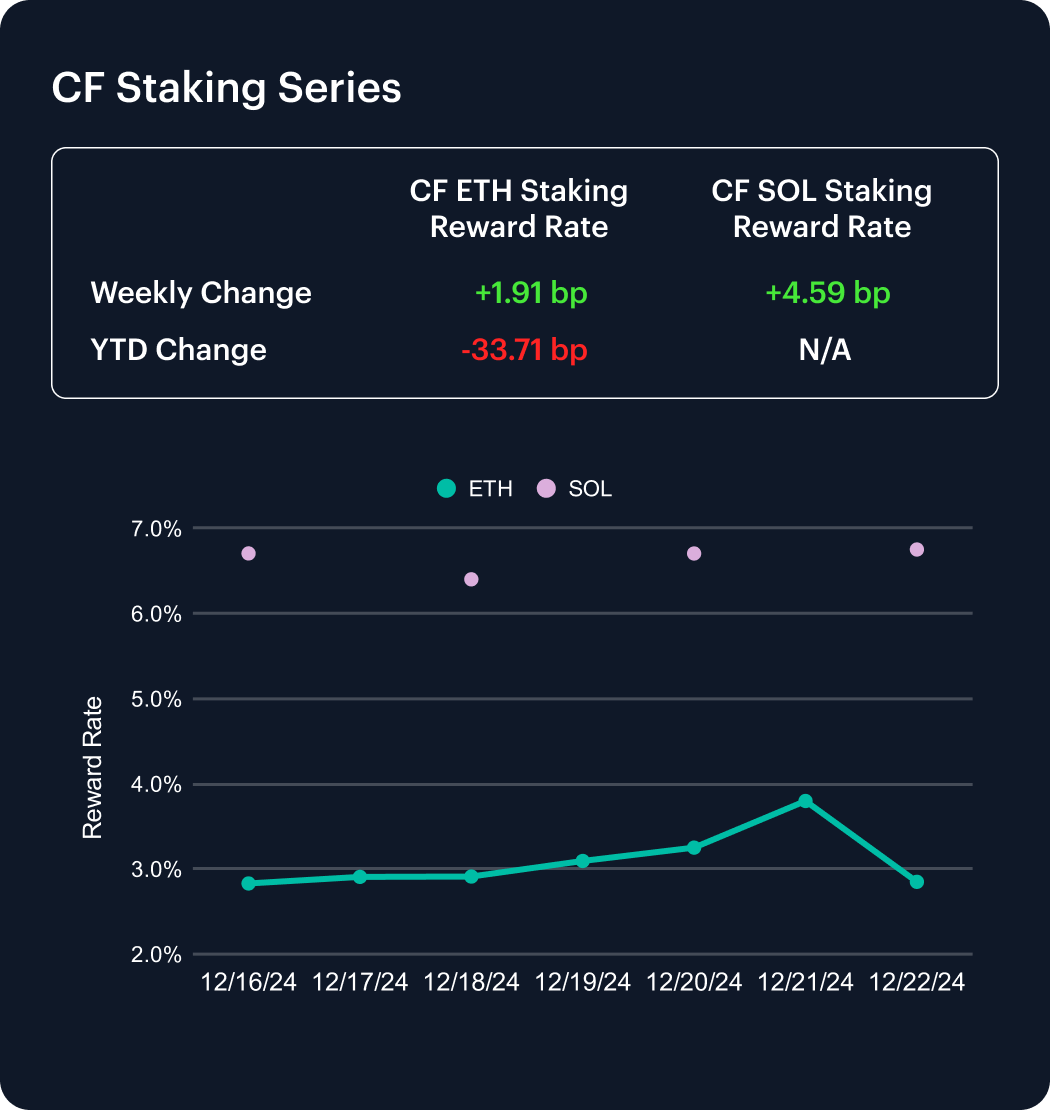
The CF Ether Staking Reward Rate Index (ETH_SRR) posted a marginal weekly uptick that doesn’t materially negate its declining late-year trend. After gliding a tad higher over the course of the business week, reward rates dropped emphatically by almost a full point in percentage terms, on December 21st–22nd, erasing almost the entire week’s lift, leaving an absolute uptick of 1.91 basis points (bp). Ethereum staking rewards now look more certain to fall year-on-year, given they are down -33.71 bp YTD. By contrast, the CF SOL Staking Reward Rate Index (SOL_SRR) may have resumed its positive medium-term trend after rising a weekly 4.59 bp. Visit the SOL_SRR web page for color on its YTD performance. Incepted on November 12th, 2024, backtested values are available back to March 2nd, 2024. The index is currently indicated down -10.29% since that date.
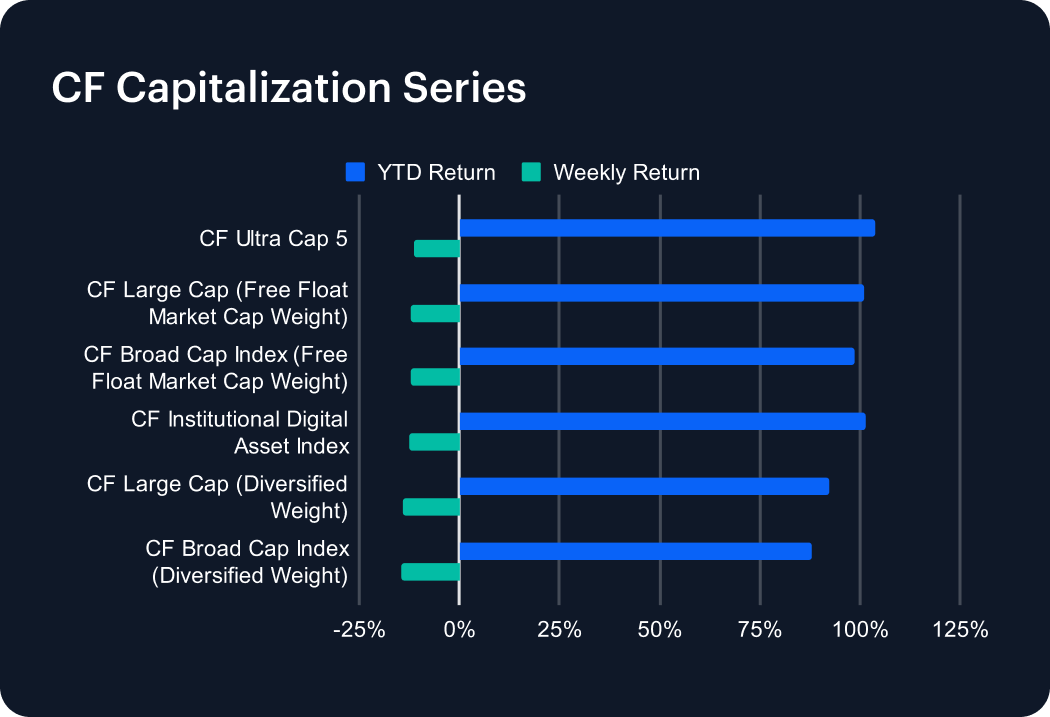
All Capitalization series indices closed the week lower, led by the wider-ranging CF Large Cap (Diversified Weight), -14.46%, vs. the least worse off benchmark, the CF Ultra Cap 5, which lost -11.39%. The nominal underperformance of our most diversified gauge signifies the relatively stronger downward pressure from medium-to-small cap altcoins over the week, as compared to large and ‘mega’ caps. And it’s mega caps that are set to outperform on a yearly basis, with the CF Ultra Cap 5 sitting at +103.65% YTD, and the CF Institutional Digital Asset Index, constituting BTC and ETH at +101.58%. The CF Broad Cap Index (Diversified Weight) is on course to relatively underperform YTD as well, with a 2024 return of +87.83%.
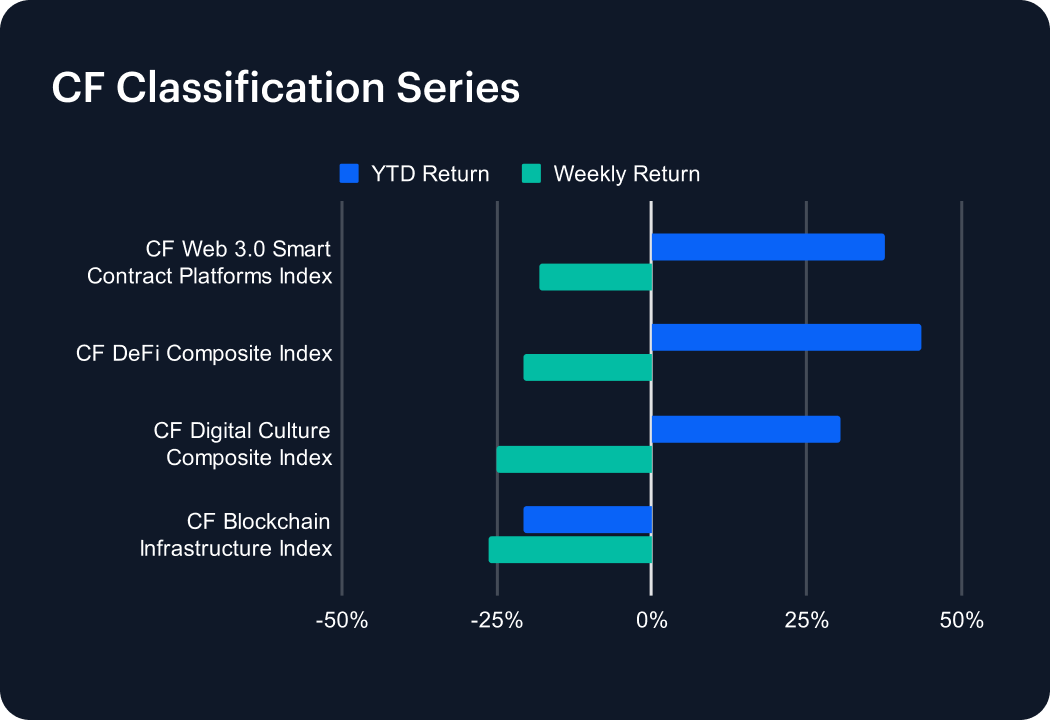
The CF Blockchain Infrastructure Index is now the only CF Classification Series index on course to decline for the year, with a YTD fall of -20.68% right now, after posting the biggest tumble for the week, down -26.27%. The CF DeFi Composite Index looks retrospectively to have been the best bet in this series given its +43.44% YTD performance, despite sliding -20.79% over the week. Still, the remaining two benchmarks in this series also look set for creditable YTD performances. The CF Web 3.0 Smart Contract Platforms Index stands + 37.66%, after declining -18.09% for the week, and the CF Digital Culture Composite Index is up +30.48% YTD, following a -25.05% weekly fall.
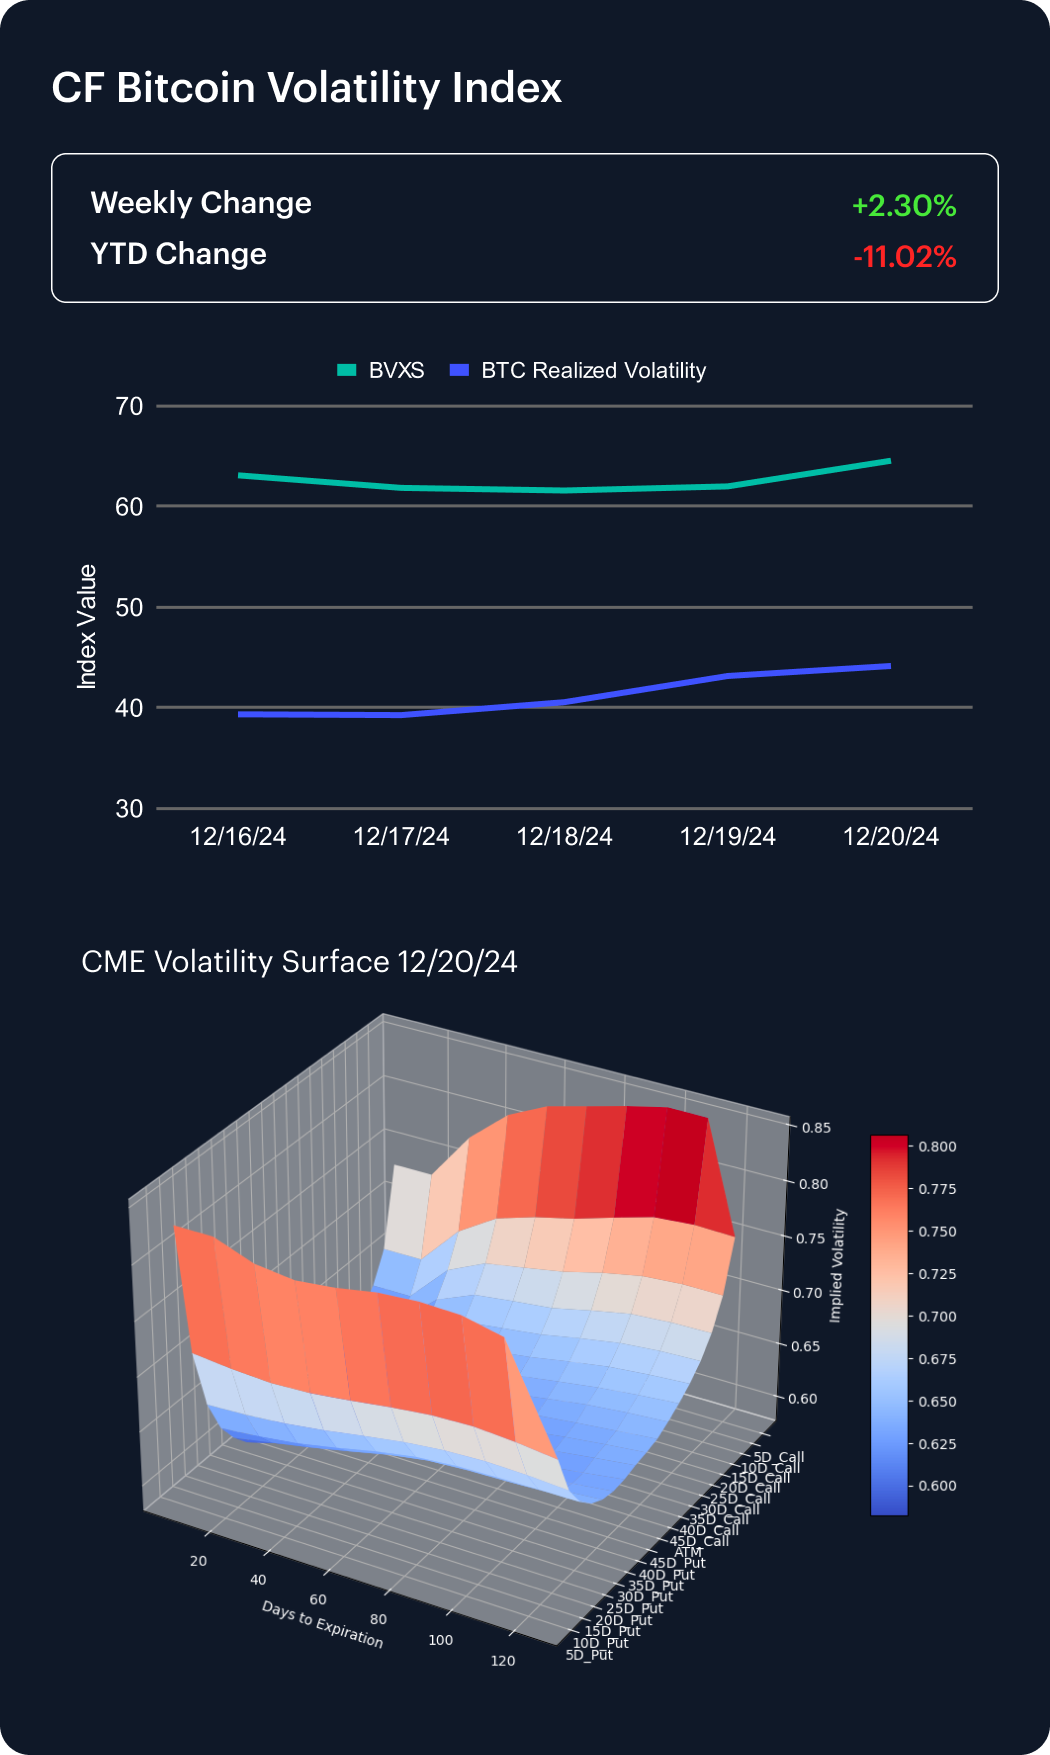
Our CF Bitcoin Volatility Index Settlement Rate (BVXS) indicates CME Bitcoin implied volatility has now risen, albeit modestly, for two consecutive weeks. The index added +2.30% in the recent week, remaining weaker overall for the year. Its YTD change is now -11.02%. Meanwhile, it’s worth noting the strong negative convexity – comprised of so-called ‘volatility smiles’ – across the CME Bitcoin Volatility Surface, as of Friday December 20th, with 5-delta calls and puts at the tails, as depicted by our model on the BVXS web page. Broadly speaking, this structure suggests higher demand, possibly fleeting, for out of the money strikes, perhaps indicating increased risk aversion, quite likely related to the short-lived upswing in realized volatility witnessed during the week, following the Federal Reserve’s rate decision and statement.
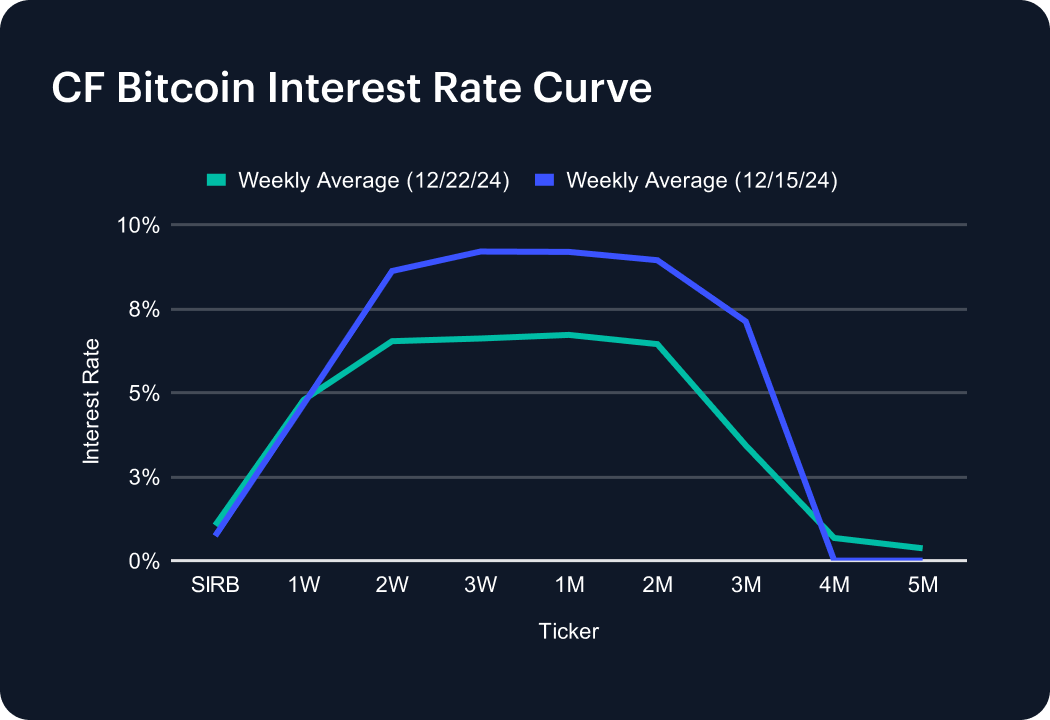
Residual Fed decision impact may also be visible across our CF Bitcoin Interest Rate Curve. Most notably, 4-Month and 5-Month tenors sprang back to life after weeks of indicative inactivity. The 4-Month rate closed the week at 0.67%; the 5-Month at 0.37%. The slowest moving tenor was the weekly, ticking up 12 basis points to 4.78%, with Session reflecting a similar sentiment by edging up 0.30 of a percentage point to 1.05%. The general tendency across the structure was actually to contract, most evidently at the longer end; the 3-Month pulled in by 3.69 points to 3.43%. Also of note, rates of 2-Week through 2-Month are now available in a contained range, bookended by rates at those tenors now standing at 6.53% and 6.44% respectively. Most fell approximately 2 to 2.5 points over the week.
The information contained within is for educational and informational purposes ONLY. It is not intended nor should it be considered an invitation or inducement to buy or sell any of the underlying instruments cited including but not limited to cryptoassets, financial instruments or any instruments that reference any index provided by CF Benchmarks Ltd. This communication is not intended to persuade or incite you to buy or sell security or securities noted within. Any commentary provided is the opinion of the author and should not be considered a personalised recommendation. Please contact your financial adviser or professional before making an investment decision.
Note: Some of the underlying instruments cited within this material may be restricted to certain customer categories in certain jurisdictions.
Changes to the Token Market Price Benchmarks Series - Market Prices – 21 July 2026
The Administrator has confirmed changes to the Token Market Price Family for the period 14 July 2026 to 21 July 2026.

CF Benchmarks
Softer CPI Reprices July Hike Risk & Lifts Digital Assets
Digital assets extended their recovery over the past week as cooler US inflation prints repriced Fed expectations; the bid was broad across the large cap indices, growth factor leadership returned, stablecoin funding repriced lower, and stress stayed isolated in names hit by token-specific news.
Mark Pilipczuk
Notice of the Demising of CF Dai-Dollar Settlement Price and Spot Rate
The Administrator announces that it will demise the CF Dai-Dollar Settlement Price (DAIUSD_RR) and CF Dai-Dollar Spot Rate (DAIUSD_RTI) which are members of the CF Digital Asset Index Family.
CF Benchmarks
By clicking Accept, you consent to CF Benchmarks's use of cookies.
Visit Cookie Settings to learn how CF Benchmarks uses cookies and to adjust your preferences.