
Dec 02, 2024
Weekly Index Highlights, December 2, 2024
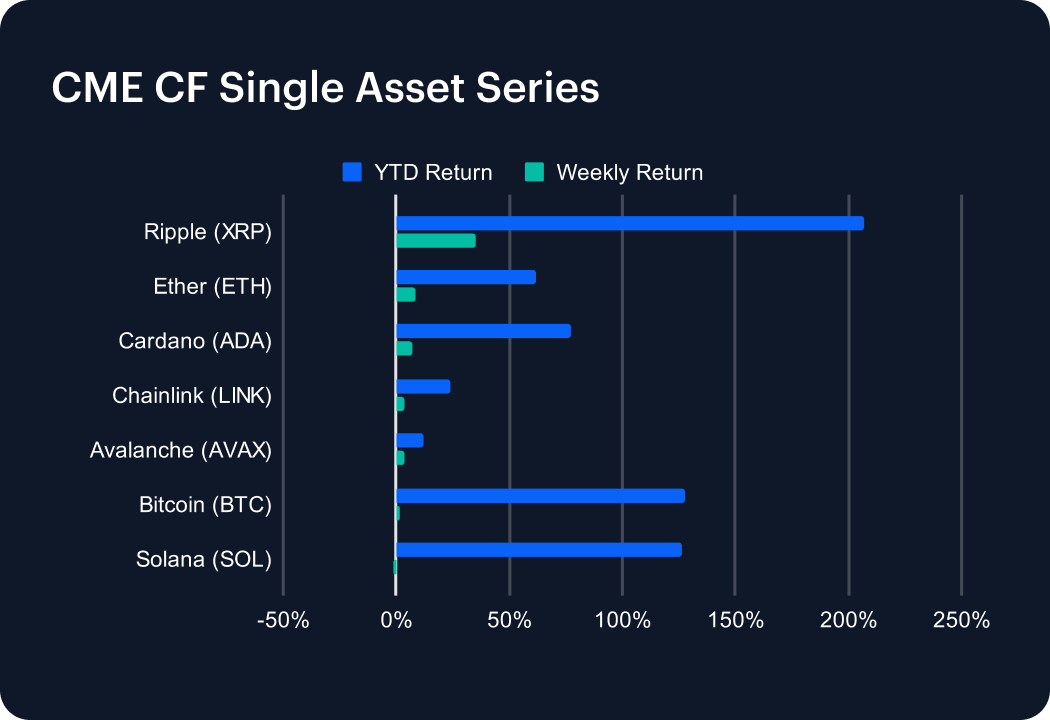
Just like gains across broader U.S. markets, the overall crypto rally is extending, albeit at a more measured and selective pace. Our flagship Bitcoin and Ether benchmarks in the CME CF series notched relatively modest advances in the most recent week, even against the backdrop of record inflows for their respective U.S. ETFs. The CME CF Bitcoin Reference Rate (BRR) added just +1.51%, while the CME CF Ether-Dollar Reference Rate (ETHUSD_RR) rose +8.31%. Meanwhile, XRP continued to rip, leaping a further +35.36% over the week, potentially aided by news underlining the crypto-aligned nature of the incoming administration, and unconfirmed reports the New York Department of Financial Services was set to grant Ripple Labs permission to launch a U.S. dollar stablecoin.
All active CF DACS sub-categories rose on average. DeFi and Culture advanced +14.61%; Infrastructure ground +17.82% higher, Programmable gained +15.36%, and Non-programmable, +11.21%. Still, investors clearly singled out certain tokens for outsize increases. Algorand (ALGO) surged +78.69% ahead of the ALGO staking rewards launch; pumping the Programmable sub-category and General Purpose Smart Contract Platforms segment, including Hedera (HBAR) +40.15%, EOS, +30.39%, and Tezos (XTZ), +29.79%. Solana (SOL) underperformed, dipping -1.40%. XRP was top weekly Non-programmable gainer (see CME CF section) while LayerZero (ZRO), in the Interoperability segment, paced the Infrastructure Sub-category, with a +46.49% jump; though SKALE (SKL), topped Scaling, with a +32.20% rise. Diversified Financial Services segment token AMP led DeFi, advancing +36.43%. As for Culture, Echelon Prime (PRIME) in the Gaming segment, outperformed; outshining rivals (e.g., IMX, which added +20.16%). SHIB, +29.58%, starred among Meme Coins.
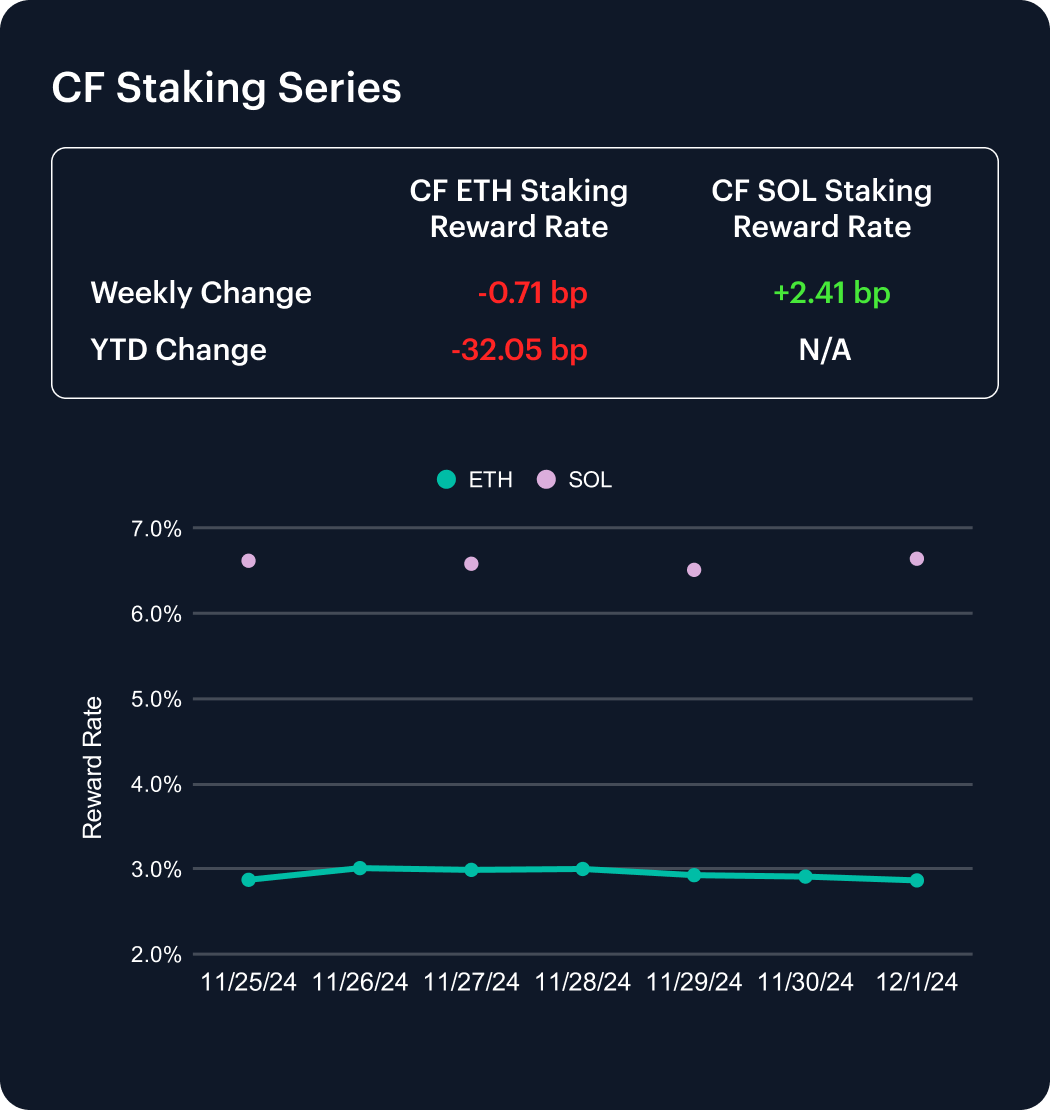
Suspense as to whether ETH staking rewards, as measured by our CF ETH Staking Reward Rate Index (ETH_SRR), will end lower or higher than the year before continued, as ETH_SRR dipped marginally week-on-week, -0.71 basis points (bp), nudging the year-to-date (YTD) change a bit further into the negative to stand at -32.05 bp. Although there are few grounds as yet to pinpoint a trend from the second asset to be launched in our CF Staking Series, Solana, the CF SOL Staking Reward Rate Index (SOL_SRR) has appeared slightly more robust than ETH_SRR of late; inching +2.41 bp ahead over the week.
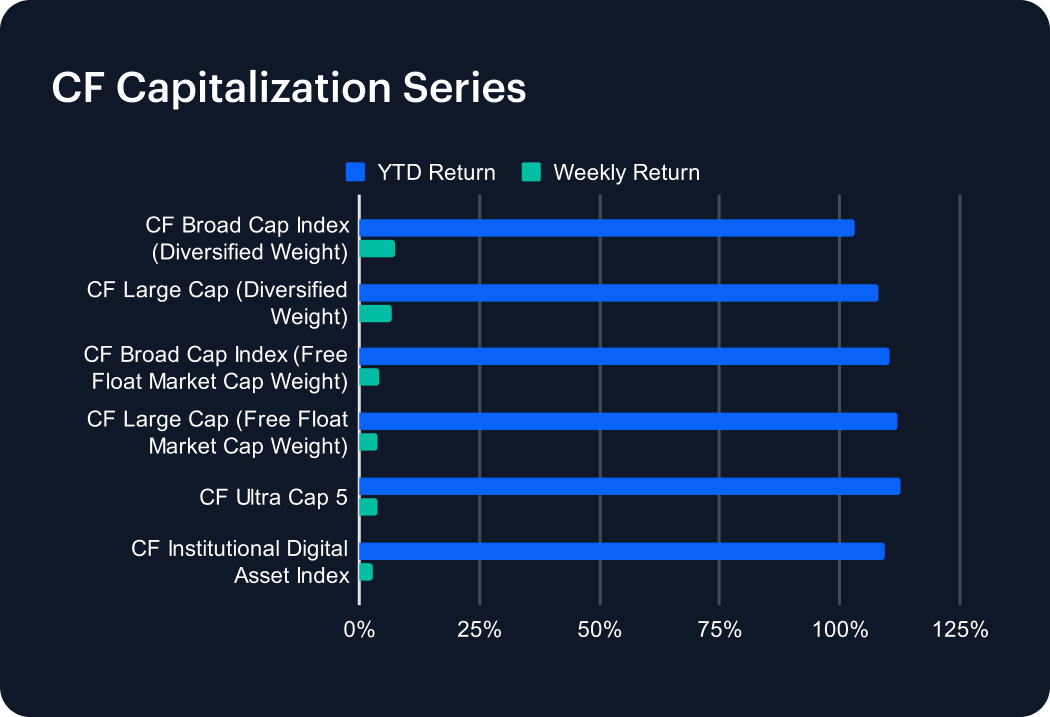
The moderate push further out along the distribution of the capitalization tail seen last week appears to show. The CF Broad Cap Index (Diversified Weight) led this series with a +7.29% rise, closely followed by the CF Large Cap (Diversified Weight), +6.68%. Meanwhile, the CF Ultra Cap 5 and CF Institutional Digital Asset Index (the latter measuring aggregate Bitcoin and Ether returns) moved ahead by just +3.69% and +2.70% respectively.
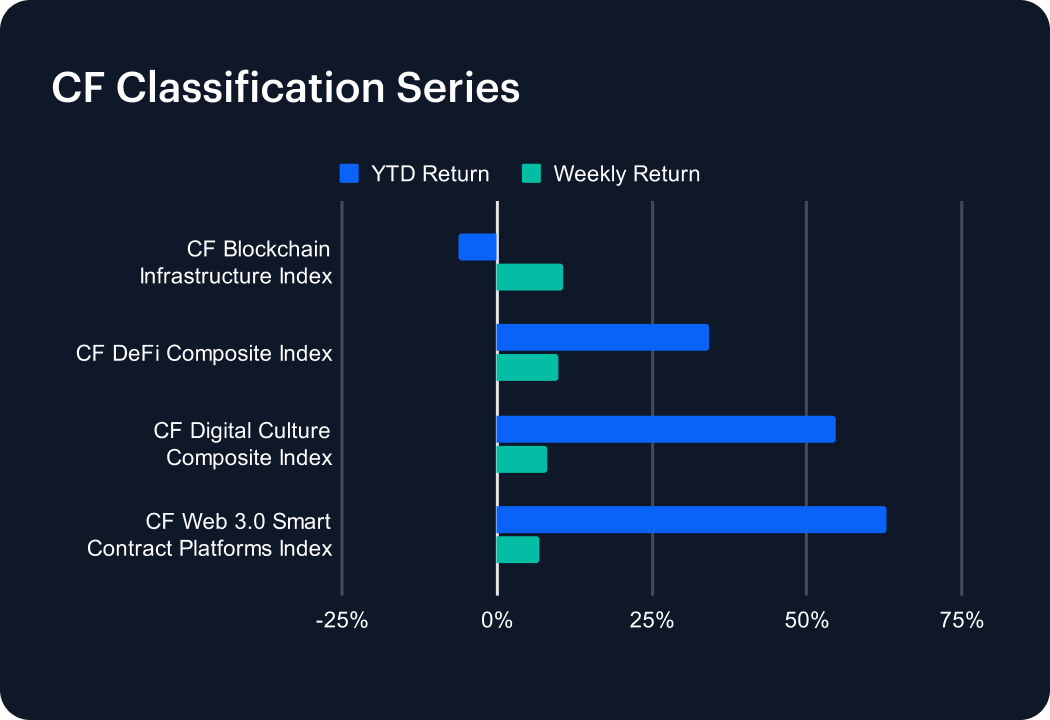
The CF Blockchain Infrastructure Index’s apparent bid to finish 2024 with a positive return continued, with a weekly advance of +10.65%, outperforming this series. (It was underpinned by the broad revival of Infrastructure sub-category tokens spotlighted in the CF DACS section). The index remains the series YTD underperformer though, down -6.11%. The CF Web 3.0 Smart Contract Platforms Index is still by far the best performer of the year, now +62.84% YTD, after gaining +6.87% for the week.
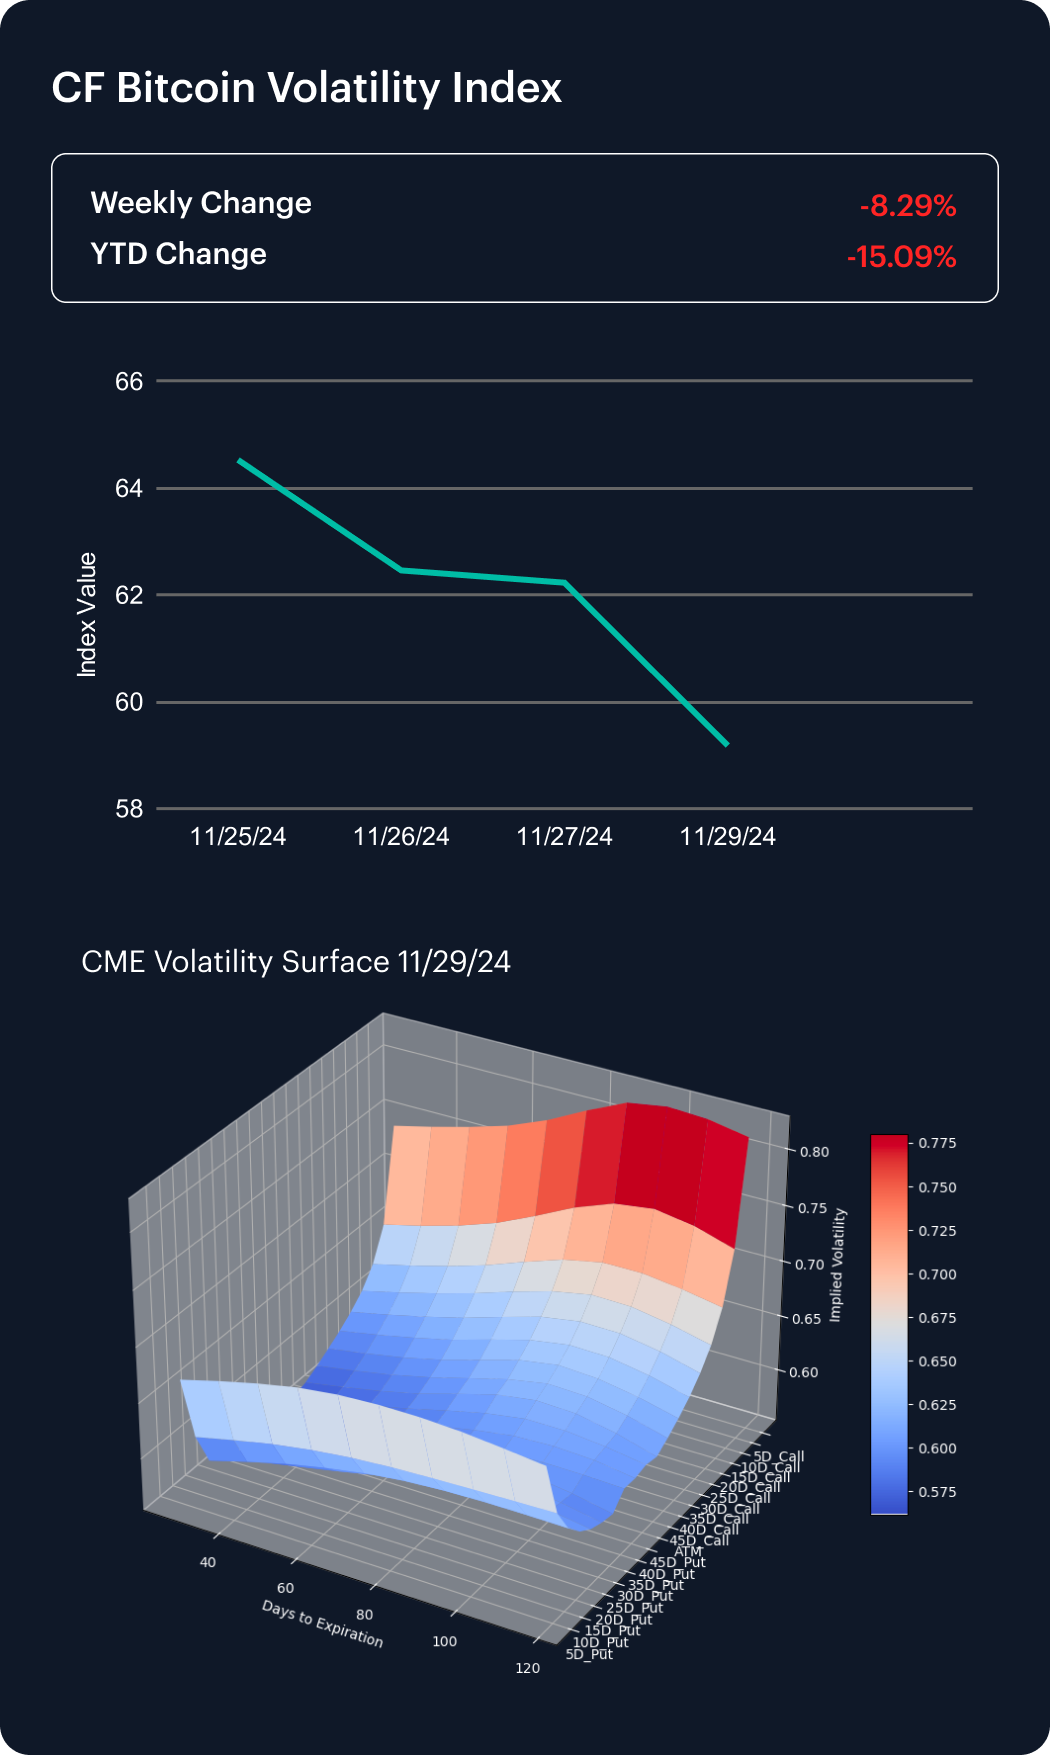
A structural disposal of CME Bitcoin implied volatility is now even more clearly afoot, as the latest mild updraft seen recently for the CF Bitcoin Volatility Index Settlement Rate (BVXS) was definitively quashed, with the weekly change dropping -8.29%, leaving the YTD change at -15.09%. Looking at the 30-Day Constant Maturity Volatility Skew Visualization depicted on our BVXS web page, it's evident that following a dip to the flattest skew in weeks at the end of November, the 30-Day Constant Maturity Volatility Skew shows all deltas turning positive. The highest is the 10-delta call skew, reflecting strong appetite for upside exposure.
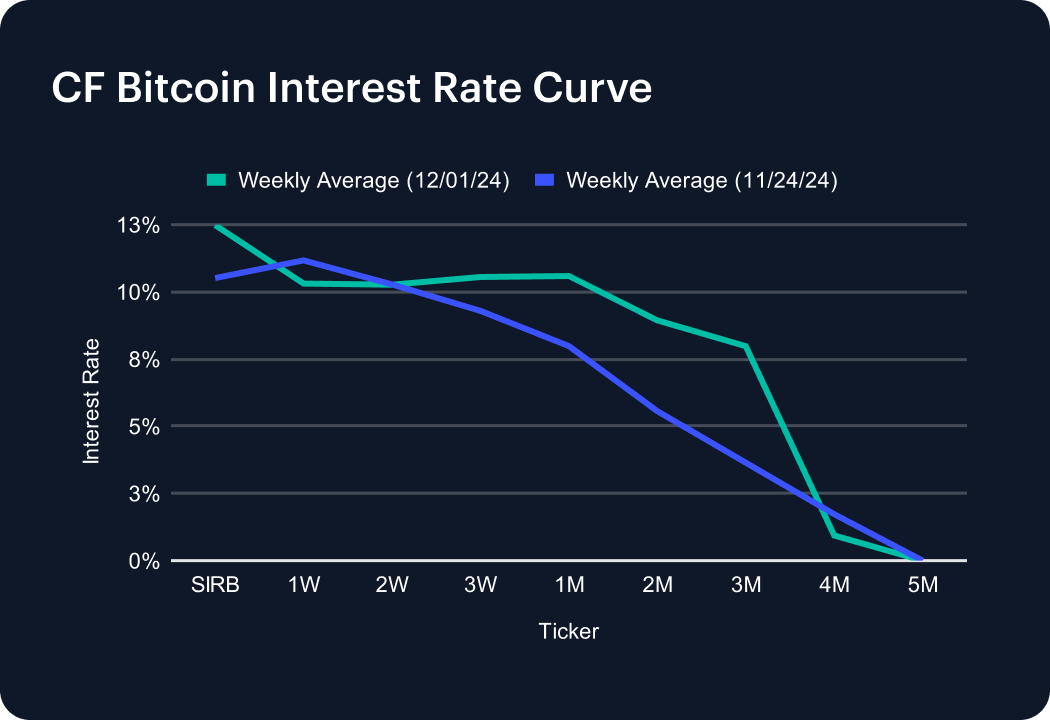
The pattern of inferred activity towards the front and middle of the structure looks intact, though note the only reduction between the Session rate out to the 3-Month tenor was seen at the 1-Week level. Still, it was a relatively mild retreat of 0.86 of a percentage point; leaving the rate at 10.31%. Meanwhile, the Session rate moved up 1.97 percentage points. There were also mild increases at the 2-Week and 3-Week tenor; more at the latter, which expanded to 10.55% from 9.29% the prior week. Curve expansion continued through 1-Month to 3-Month tenors, before deteriorating at the 4-Month, which contracted by 0.79 of a point to 0.94%; with a persistence of literally zero interest at the 5-month tenor.
The information contained within is for educational and informational purposes ONLY. It is not intended nor should it be considered an invitation or inducement to buy or sell any of the underlying instruments cited including but not limited to cryptoassets, financial instruments or any instruments that reference any index provided by CF Benchmarks Ltd. This communication is not intended to persuade or incite you to buy or sell security or securities noted within. Any commentary provided is the opinion of the author and should not be considered a personalised recommendation. Please contact your financial adviser or professional before making an investment decision.
Note: Some of the underlying instruments cited within this material may be restricted to certain customer categories in certain jurisdictions.
Changes to the Token Market Price Benchmarks Series - Market Prices – 21 July 2026
The Administrator has confirmed changes to the Token Market Price Family for the period 14 July 2026 to 21 July 2026.

CF Benchmarks
Softer CPI Reprices July Hike Risk & Lifts Digital Assets
Digital assets extended their recovery over the past week as cooler US inflation prints repriced Fed expectations; the bid was broad across the large cap indices, growth factor leadership returned, stablecoin funding repriced lower, and stress stayed isolated in names hit by token-specific news.
Mark Pilipczuk
Notice of the Demising of CF Dai-Dollar Settlement Price and Spot Rate
The Administrator announces that it will demise the CF Dai-Dollar Settlement Price (DAIUSD_RR) and CF Dai-Dollar Spot Rate (DAIUSD_RTI) which are members of the CF Digital Asset Index Family.
CF Benchmarks
By clicking Accept, you consent to CF Benchmarks's use of cookies.
Visit Cookie Settings to learn how CF Benchmarks uses cookies and to adjust your preferences.